



Abstract
Background
Social vulnerability indices were created to measure resiliency to environmental disasters based on socioeconomic and population characteristics of discrete geographic regions. They are comprised of multiple validated constructs that can also potentially identify geographically vulnerable populations after injury. Our objective was to determine if these indices correlate with injury fatality rates in the US.
Methods
We evaluated three social vulnerability indices: The Hazards & Vulnerability Research Institute’s Social Vulnerability Index (SoVI), the CDC Social Vulnerability Index (SVI) and the Economic Innovation Group’s Distressed Community Index (DCI). We analyzed SVI sub-indices and common individual census variables as indicators of socioeconomic status. Outcomes included age-adjusted county-level overall, firearm, and motor vehicle collision (MVC) deaths per 100,000 population. Linear regression determined the association of injury fatality rates with the SoVI, SVI, and DCI. Bivariate choropleth mapping identified geographic variation and spatial autocorrelation of overall fatality, SoVI, and DCI.
Results
3,137 US counties were included. Only 24.6% of counties fell into the same vulnerability quartile for all three indices. Despite this, all indices were associated with increasing fatality rates for overall, firearm, and MVC fatality. The DCI performed best by model fit, explanation of variance, and diagnostic performance on overall injury fatality. There is significant geographic variation in SoVI, DCI, and injury fatality rates at the county-level across the US, with moderate spatial autocorrelation of SoVI (Moran’s I 0.35, p<0.01) and high autocorrelation of injury fatality rates (Moran’s I 0.77, p<0.01) and DCI (Moran’s I 0.53, p<0.01).
Conclusions
While the indices contribute unique information, higher social vulnerability is associated with higher injury fatality across all indices. These indices may be useful in the epidemiologic and geographic assessment of injury-related fatality rates. Further study is warranted to determine if these indices outperform traditional measures of socioeconomic status and related constructs used in trauma research.
Keywords: Geospatial, Social Vulnerability, Trauma Fatality, Distressed Communities
BACKGROUND
The social determinants of health encompass a vast array of social domains such as economic status, education, neighborhood environment, healthcare access, and social factors, which together contribute up to 50% of preventable mortality among all deaths in the United States1. To date, no universal measure captures the complexity of these factors in healthcare, despite the consensus on its importance. Health disparities influence access to care, healthcare quality, community, and individual well-being, and extend outward from the individual to impact their neighborhood. These disparities can be traced to social variation which underlies the concept of social vulnerability. Social determinants of health have an inherent geospatial component representing neighborhood or regional attributes, providing information on where these disparities occur and has emerged as key components to consider in the pursuit of improved patient outcomes2, 3. Even in an acute event such as trauma, social disparities influence outcomes and fatality, but simple measures, such as the widely used household income or education level fail to capture the full picture. Similarly, the association of race and trauma fatality is well described but this, again, represents just one aspect in the continuum of social determinants of health4. The implementation of a geographic multifaceted social vulnerability measure would allow for a more holistic approach to the disparities we observe and could be vital in public health approaches to injury in the United States.
Previous work consolidated census-based data into several different constructs incorporating elements of the social determinants of health, yet there is no widespread utilization in healthcare research. Socioeconomic status, for example, is one domain of social determinants of health commonly evaluated using a heterogenous array of variables and approaches. Moreover, a meta-analysis of these constructs by Bell et al5 discovered considerable variation in the makeup of composite social determinants of health indices, making it difficult to substantiate which could be useful and in what settings they should be applied. Notwithstanding, the study concluded that 74–98% of all constructs were predictive of injury risk.
Social vulnerability indices measure and rank the degree of community vulnerability, but most were initially created to measure regional resiliency to environmental disasters based on several socioeconomic and population characteristics of a discrete geographic region6. They contain multiple constructs that embody social and geographical determinants of health and have been robustly validated.7 In this way, they may hold valuable insight for health outcomes, particularly after injury. Multiple studies demonstrate the strength of existing indices regarding the identification of surgical risk, hospital discharge status and readmission rates8–10. Prior work illustrates distressed communities around a single trauma center predict youth gun violence and identified three census variables correlated with intentional trauma11, 12. However, the association of social vulnerability indices with injury related fatality rates on a broader scale remains unknown.
Therefore, our objective was to determine if three county-level social vulnerability indices correlate with injury fatality in the US. In addition, we sought to characterize the geographic variation in these indices and injury fatality across the US.
METHODS
Study Design & Population
We performed a retrospective, county-level analysis of all US counties, excluding only US territorial counties. We evaluated three county-ranked, publicly available social vulnerability indices: The Hazards & Vulnerability Research Institute’s Social Vulnerability Index (SoVI) 2010–2014, the Center for Disease Control’s (CDC) Social Vulnerability Index (SVI) 2014, and the Economic Innovations Group’s Distressed Community Index (DCI) 2012–2016. Datasets including the year 2014 were the most recent in aligning all data to a common time-period.
Social Vulnerability Indices
Both the SoVI and SVI assess vulnerability in terms of preparedness and potential for recovery in the event of an environmental disaster and cover domains such as a socioeconomic, household makeup, and housing vacancy. Apart from these similarities, the SoVI adds elements of races and a more comprehensive list of housing composition. The DCI focuses on economics and ranks counties in the context of financial and community prosperity. These indices are calculated at the county-level and transformed into percentile ranks for all US counties, ranging between 0 and 100 with larger values indicative of greater social vulnerability. We selected these indices as they are well documented and have been robustly derived and validated.
In addition, we analyzed the four SVI sub-indices (socioeconomic status, disabled populations, minority populations, and housing and transport status) and three individual US census county variables from 2010–2014 5-year estimates (median income, proportion of population attaining at least a high school degree, and proportion of population below the poverty level). We choose these census variables because they have been used for indicators of socioeconomic status in prior work. The variables and methods used to create each index can be found in the Supplemental Methods (Appendix, Table A.1).
Outcomes
Our primary outcome was age-adjusted county-level overall injury fatality rate expressed as injury related deaths per 100,000 population. We also separately evaluated firearm and motor vehicle collision (MVC) injury fatality rates to explore injuries that more prevalently impact urban and rural areas, respectively. Data were originally sampled from the National Vital Statistics System (NVSS) and obtained via the CDC Web-based Injury Statistics Query and Reporting System (WISQARS) 2008–2014 for each county.
Statistical Analysis
Spearman’s correlation coefficients were used to determine the strength and direction of correlation between indices and injury fatality ranked with high, moderate, and low strength13. Linear regression was examined the association between fatality rate and each index, sub-index, and individual census variables. Stepwise multivariable linear regression was performed, starting with all 10 variables, until low collinearity (Variance Inflation Factor <5), highest possible adjusted r-squared value, and lowest possible Bayesian Information Criteria (BIC) was achieved for each fatality rate, indicating the strongest, best-fit model.
Binary variables were created with top quintile county fatality and top quartile ranked indices and tested for diagnostic performance. The diagnostic performance of each index for predicting overall, firearm, and MVC trauma fatality rates included sensitivity, specificity, positive predictive values (PPV), negative predictive value (NPV), area under the receiver operating characteristic curve (AUC), and accuracy.
Linear regression models are reported as coefficients with 95% confidence intervals (CI). Continuous data are reported as median (interquartile range [IQR]). Reported p-values were 2-tailed, and a p-value <0.05 was considered statistically significant. All analyses were performed using Stata version 15MP (StataCorps LP, College Station, TX).
Geospatial Analysis
Terciles of county fatality, SoVI, and DCI values were individually calculated and bivariate choropleth mapping was utilized to identify nine combinations of fatality rate and social vulnerability index (low, medium, high tercile values) to visually assess geographic variation in fatality rates and social vulnerability indices. This was performed for SoVI and DCI separately. We also used Moran’s I to evaluate spatial autocorrelation of injury fatality rates, SoVI, and DCI across the contiguous United States. We excluded Hawaiian and Alaskan counties for this analysis because it relies on geographic adjacency. Moran’s I is a measure of spatial autocorrelation, ranging from −1 (completely dispersed in space) to +1 (perfectly correlated in space) and can be interpreted similarly to a correlation coefficient. This represents a measure of how dissimilar or similar a county’s injury fatality rate, SoVI, or DCI is when compared to neighboring counties. In other words, it evaluates whether counties with similar injury fatality rates or social vulnerability rankings tend to be grouped closer together or spread farther apart from each other.
To evaluate the impact of trauma center geographic access on the relationship between social vulnerability and fatality rates, we also incorporated the proximity of trauma center locations. Locations for all level 1 and level 2 trauma centers were obtained from the American Trauma Society Trauma Information Exchange Program and were geolocated and mapped. We then calculated the median population weighted centroid for each county in the US by spatially joining US Census blocks with population counts to each county. Next, we computed the straight-line Euclidean distance from each county centroid to the nearest trauma center. Lastly, we tested the interaction between distance to the closest trauma center and social vulnerability indices, as well as included the distance to the nearest trauma center in the univariate linear regression models described above. For significant interactions, we performed stratified models across quartiles of distance to the nearest trauma center. All geospatial analysis was performed using ArcGIS v10.8 software (ESRI, Redlands, CA).
RESULTS
Performance of Social Vulnerability Indices
There were 3,137 US counties included. Nationwide mean age-adjusted fatality rates were 75.0 (59.5, 86.3), 13.1 (9.1, 16.3), 18.5 (11.7, 23.7) per 100,000 for overall, firearm, and MVC, respectively. Only 24.6% of counties fell into the same vulnerability quintile for all three indices. SVI was moderately correlated with SoVI (spearman’s rho=0.47, p<0.001) and strongly correlated with DCI (spearman’s rho=0.73, p<0.001). SoVI was moderately correlated with DCI (spearman’s rho=0.54, p<0.001). DCI was the most correlated to overall fatality (spearman’s rho=0.52, p<0.001 vs. SoVI: spearman’s rho=0.33, p<0.001; and SVI: spearman’s rho=0.34, p<0.001), as well as firearm fatality (spearman’s rho=0.59, p<0.001 vs. SoVI: spearman’s rho=0.37, p<0.001; and SVI: spearman’s rho=0.48, p<0.001), and MVC fatality (spearman’s rho=0.62, p<0.001 vs. SoVI: spearman’s rho=0.33, p<0.001; and SVI: spearman’s rho=0.44, p<0.001).
All indices, census variables, and SVI sub-indices demonstrated a statistically significant association with increasing fatality rates for overall, firearm, and MVC fatality rates in linear regression (Table 1). Census median income and high school degree obtainment along with SVI’s minority sub-index showed a consistently inverse association with each fatality rate. The DCI was the best-fitted model in all linear regression models, with the highest r2 and lowest BIC for each fatality rate examined. Comparing lowest to highest quintile of social vulnerability resulted in a 52.3%, 36.3%, and 33.1% increase in overall fatality rates for the DCI, SoVI, and SVI, respectively. For firearm fatality, lowest to highest quintiles resulted in an increase of 93.5%, 63.8%, and 82.4% for the DCI, SoVI, and SVI, respectively. Lastly, MVC fatality, from lowest to highest social vulnerability quintiles resulted in an increase of 131.6%, 69.1%, and 86.6% for the DCI, SoVI, and SVI, respectively (Table 2).
Table 1:
Association of Social Vulnerability Indices, Census Variables, and SVI sub-Indices with County Trauma Fatality Rates
| Coefficient (95%CI) | P- Value | Adjusted R- squared | BIC | |
|---|---|---|---|---|
| Overall Fatality | ||||
| Index | ||||
| DCI | 0.39 (0.36, 0.41) | p<0.001 | 0.2373 | 26131.74 |
| SVI | 0.26 (0.23, 0.29) | p<0.001 | 0.0984 | 26730.76 |
| SoVI | 0.28 (0.25, 0.30) | p<0.001 | 0.1112 | 26688.54 |
| Census Variables | ||||
| Median Income* | −0.44 (−0.51, −0.38) | p<0.001 | 0.0542 | 26534.5 |
| High School Degree Obtainment | -−.17 (−1.30, −1.04) | p<0.001 | 0.0989 | 26423.84 |
| Percent Below Poverty level | 1.42 (1.30, 1.54) | p<0.001 | 0.1605 | 26248.07 |
| SVI Sub- Indices | ||||
| SES | 0.34(0.31, 0.37) | p<0.001 | 0.1717 | 26480.65 |
| Disabled population | 0.34(0.32, 0.37) | p<0.001 | 0.1756 | 26466.51 |
| Minority | −0.11 (−0.14, −0.08) | p<0.001 | 0.0163 | 26988.06 |
| Housing Transport | 0.05(0.015, 0.0075) | p<0.001 | 0.0030 | 27027.86 |
| Firearm Fatality | ||||
| Index | ||||
| DCI | 0.11 (0.10, 0.11) | p<0.001 | 0.3073 | 10217.28 |
| SVI | 0.09 (0.08, 0.10) | p<0.001 | 0.1923 | 10570.54 |
| SoVI | 0.08 (0.07, 0.09) | p<0.001 | 0.1391 | 10680.2 |
| Census Variables | ||||
| Median Income* | −0.08 (−0.10, −0.06) | p<0.001 | 0.0462 | 10670.12 |
| High School Degree Obtainment | −0.42 (−0.46, −0.37) | p<0.001 | 0.1703 | 10439.61 |
| Percent Below Poverty level | 0.45 (0.41, 0.49) | p<0.001 | 0.2301 | 10311.31 |
| SVI Sub- Indices | ||||
| SES | 0.11 (0.10, 0.12) | p<0.001 | 0.2712 | 10393.49 |
| Disabled population | 0.10 (0.09, 0.11) | p<0.001 | 0.2380 | 10470.34 |
| Minority | −0.015 (−0.026, −0.005) | p<0.001 | 0.0048 | 10929.78 |
| Housing Transport | 0.028 (0.018, 0.038) | p<0.001 | 0.0167 | 10909.12 |
| MVC Fatality | ||||
| Index | ||||
| DCI | 0.18 (0.17, 0.19) | p<0.001 | 0.3115 | 14910.21 |
| SVI | 0.11 (0.10, 0.13) | p<0.001 | 0.1030 | 15374.79 |
| SoVI | 0.14(0.13, 0.15) | p<0.001 | 0.1578 | 15509.21 |
| Census Variables | ||||
| Median Income* | −0.22(−0.25, −0.19) | p<0.001 | 0.0982 | 15468.54 |
| High School Degree Obtainment | −0.80 (−0.86, −0.74) | p<0.001 | 0.2438 | 15103.3 |
| Percent Below Poverty level | 0.72 (0.66, 0.78) | p<0.001 | 0.2162 | 15206.92 |
| SVI Sub- Indices | ||||
| SES | 0.18 (0.16, 0.19) | p<0.001 | 0.2558 | 15111.12 |
| Disabled population | 0.18 (0.17, 0.19) | p<0.001 | 0.2865 | 15021.39 |
| Minority | −0.04 (−0.06, −0.03) | p<0.001 | 0.0157 | 15707.21 |
| Housing Transport | 0.017 (0.002, 0.03) | p<0.001 | 0.0023 | 15735.85 |
DCI, Distressed Community Index; SVI, CDC’s Social Vulnerability Index; SoVI, The Hazards & Vulnerability Research Institute’s Social Vulnerability Index; MVC, Motor Vehicle Collision, SES, Socioeconomic Status; BIC, Bayesian Information Criteria.
Per $10,000 increase
Table 2:
Mean adjusted fatality by Social Vulnerability Quintile*
| DCI | SoVI | SVI | |
|---|---|---|---|
| Overall Fatality | |||
| 1st | 59.15 (57.89, 60.42) | 63.91 (62.35, 65.47) | 63.33 (61.75, 64.91) |
| 2nd | 67.45 (66.14, 68.77) | 71.28 (69.70, 72.86) | 69.86 (68.26, 71.46) |
| 3rd | 75.85 (74.30, 77.39) | 75.10 (73.57, 76.63) | 74.97 (73.35, 76.59) |
| 4th | 81.86 (80.14, 83.58) | 78.37 (76.74, 80.00) | 81.04 (79.23, 82.85) |
| 5th | 90.07 (87.86, 92.28) | 87.12 (74.54, 89.69) | 84.30 (82.07, 86.54) |
| Firearm Fatality | |||
| 1st | 9.22 (8.86, 9.58) | 10.34 (9.89, 10.79) | 9.18 (8.67, 9.69) |
| 2nd | 11.35 (10.87, 11.82) | 11.98 (11.46, 12.50) | 10.74 (10.22, 11.27) |
| 3rd | 13.10 (12.60, 13.60) | 13.38 (12.91, 13.86) | 12.63 (12.13, 13.14) |
| 4th | 15.32 (14.74, 15.90) | 14.46 (13.90, 15.02) | 14.31 (13.81, 14.80) |
| 5th | 17.84 (17.21, 18. 47) | 16.94 (15.97, 17.91) | 16.74 (16.10, 17.38) |
| MVC Fatality | |||
| 1st | 11.67 (11.07, 12.26) | 14.08 (13.34, 14.82) | 13.07 (12.34, 13.80) |
| 2nd | 15.01 (14.41, 15.61) | 17.55 (16.74, 18.36) | 15.10 (14.24, 15.97) |
| 3rd | 18.81 (17.96, 19.65) | 18.83 (18.09, 19.57) | 17.26 (16.54, 17.99) |
| 4th | 20.73 (19.94, 21.53) | 20.15 (19.33, 20.96) | 20.04 (19.20, 20.88) |
| 5th | 27.03 (26.06, 28.00) | 23.81 (22.42, 25.20) | 24.39 (23.46, 25.32) |
DCI, Distressed Community Index; SVI, CDC’s Social Vulnerability Index; SoVI, The Hazards & Vulnerability Research Institute’s Social Vulnerability Index; MVC, Motor Vehicle Collision.
1st Quintile is the least socially vulnerable, 5th quintile is the most socially vulnerable
The final multivariable stepwise model included slightly different variables for each fatality rate, but each model included the Census’s poverty and median income variables, the DCI, and the SVI’s housing and transport sub-index (Table 3). The DCI was the only full index to be included in any of the final multivariable regression models.
Table 3:
Final Regression Model for County Overall, Firearm, and MVC Fatality Rate
| Coefficient (95% CI) | VIF | P-value | R-square | |
|---|---|---|---|---|
| Overall Fatality | 0.3037 | |||
| Census Poverty | 0.80 (0.62, 0.97) | 2.81 | <0.001 | |
| Census Median Income* | −0.14 (−0.20, −0.08) | 1.18 | <0.001 | |
| DCI | 0.31 (0.27, 0.34) | 2.49 | <0.001 | |
| SVI Minority | −0.09 (−0.11, −0.06) | 1.31 | <0.001 | |
| SVI Housing and Transport | −0.16 (−0.19, −0.13) | 1.80 | <0.001 | |
| Firearm Fatality | ||||
| DCI | 0.08 (0.07, 0.10) | 2.71 | <0.001 | |
| Census Poverty | 0.24 (0.17, 0.29) | 3.07 | <0.001 | |
| SVI Housing and Transport | −0.04 (−0.05, −0.03) | 1.60 | <0.001 | |
| Census Median Income* | −0.02 (−0.04, −0.006) | 1.14 | <0.001 | |
| MVC Fatality | ||||
| DCI | 0.10 (0.09, 0.12) | 3.52 | <0.001 | |
| SVI Housing and Transport | −0.09 (−0.11, −0.08) | 1.83 | <0.001 | |
| SVI Minority | −0.02 (−0.03, −0.01) | 1.47 | <0.001 | |
| Census Poverty | 0.30 (0.21, 0.39) | 3.23 | <0.001 | |
| Census Median Income* | −0.10 (−0.13, −0.08) | 1.20 | <0.001 | |
| Census High School Degree | −0.39 (−0.47, −0.31) | 2.34 | <0.001 | |
DCI, Distressed Community Index; SVI, CDC’s Social Vulnerability Index; SoVI, The Hazards & Vulnerability Research Institute’s Social Vulnerability Index; MVC, Motor Vehicle Collision; VIF, Variation Inflation Factor.
Per $10,000 increase
The top-quintile DCI outperformed the top-quintiles of SVI and SoVI in all diagnostic performance characteristics (sensitivity, specificity, PPV, NPV, AUC, and accuracy) for all trauma fatality types (Table 4). The DCI had an AUC of 0.653, 0.695, and 0.719 for overall, firearm, and motor vehicle collision fatality, respectively.
Table 4:
Diagnostic Performance: Top Quartile Indices Predicting Top Quartile Age-Adjusted Mortalities
| Sensitivity | Specificity | PPV | NPV | AUC | Accuracy | |
|---|---|---|---|---|---|---|
| Overall Fatality | ||||||
| SVI | 37.7% | 78% | 36.3% | 79% | 0.578 | 67.9% |
| SoVI | 39.4% | 81.1% | 41% | 80.1% | 0.603 | 70.6% |
| DCI | 48.5% | 82% | 47.4% | 82.7% | 0.653 | 73.6% |
| Firearm Fatality | ||||||
| SVI | 50.2% | 79.4% | 44.8% | 82.7% | 0.648 | 72.1% |
| SoVI | 35.1% | 86.6% | 46.6% | 80% | 0.609 | 73.7% |
| DCI | 52.3% | 86.8% | 56.8% | 84.5% | 0.695 | 78.2% |
| MVC Fatality | ||||||
| SVI | 52.3% | 79.1% | 45.4% | 83.3% | 0.657 | 72.4% |
| SoVI | 35% | 84.7% | 43.2% | 79.6% | 0.598 | 72.3% |
| DCI | 58.1% | 85.7% | 57.4% | 86% | 0.719 | 78.8% |
PPV, positive predictive value; NPV, negative predictive value; AUC, Area Under the Curve; DCI, Distressed Community Index; SVI, CDC’s Social Vulnerability Index; SoVI, The Hazards & Vulnerability Research Institute’s Social Vulnerability Index; MVC, Motor Vehicle Collision.
Geospatial Variation
We observed significant geospatial variation across the nation in both social vulnerability and trauma fatality as demonstrated with DCI (Figure 1) and SoVI (Figure 2). Clusters of similar DCI and trauma fatality rates are confirmed by a highly correlated Moran’s I of 0.53 and 0.77, respectively. SoVI is moderately autocorrelated at 0.35. There are clusters of low county social vulnerability and county fatality in the Northeast and Midwest of the US, as well as Washington state, southern Texas, Florida, and California. Whereas there are clusters of high county social vulnerability and county fatality in the Southeast, Southcentral, and Northwest of the US.
Figure 1:
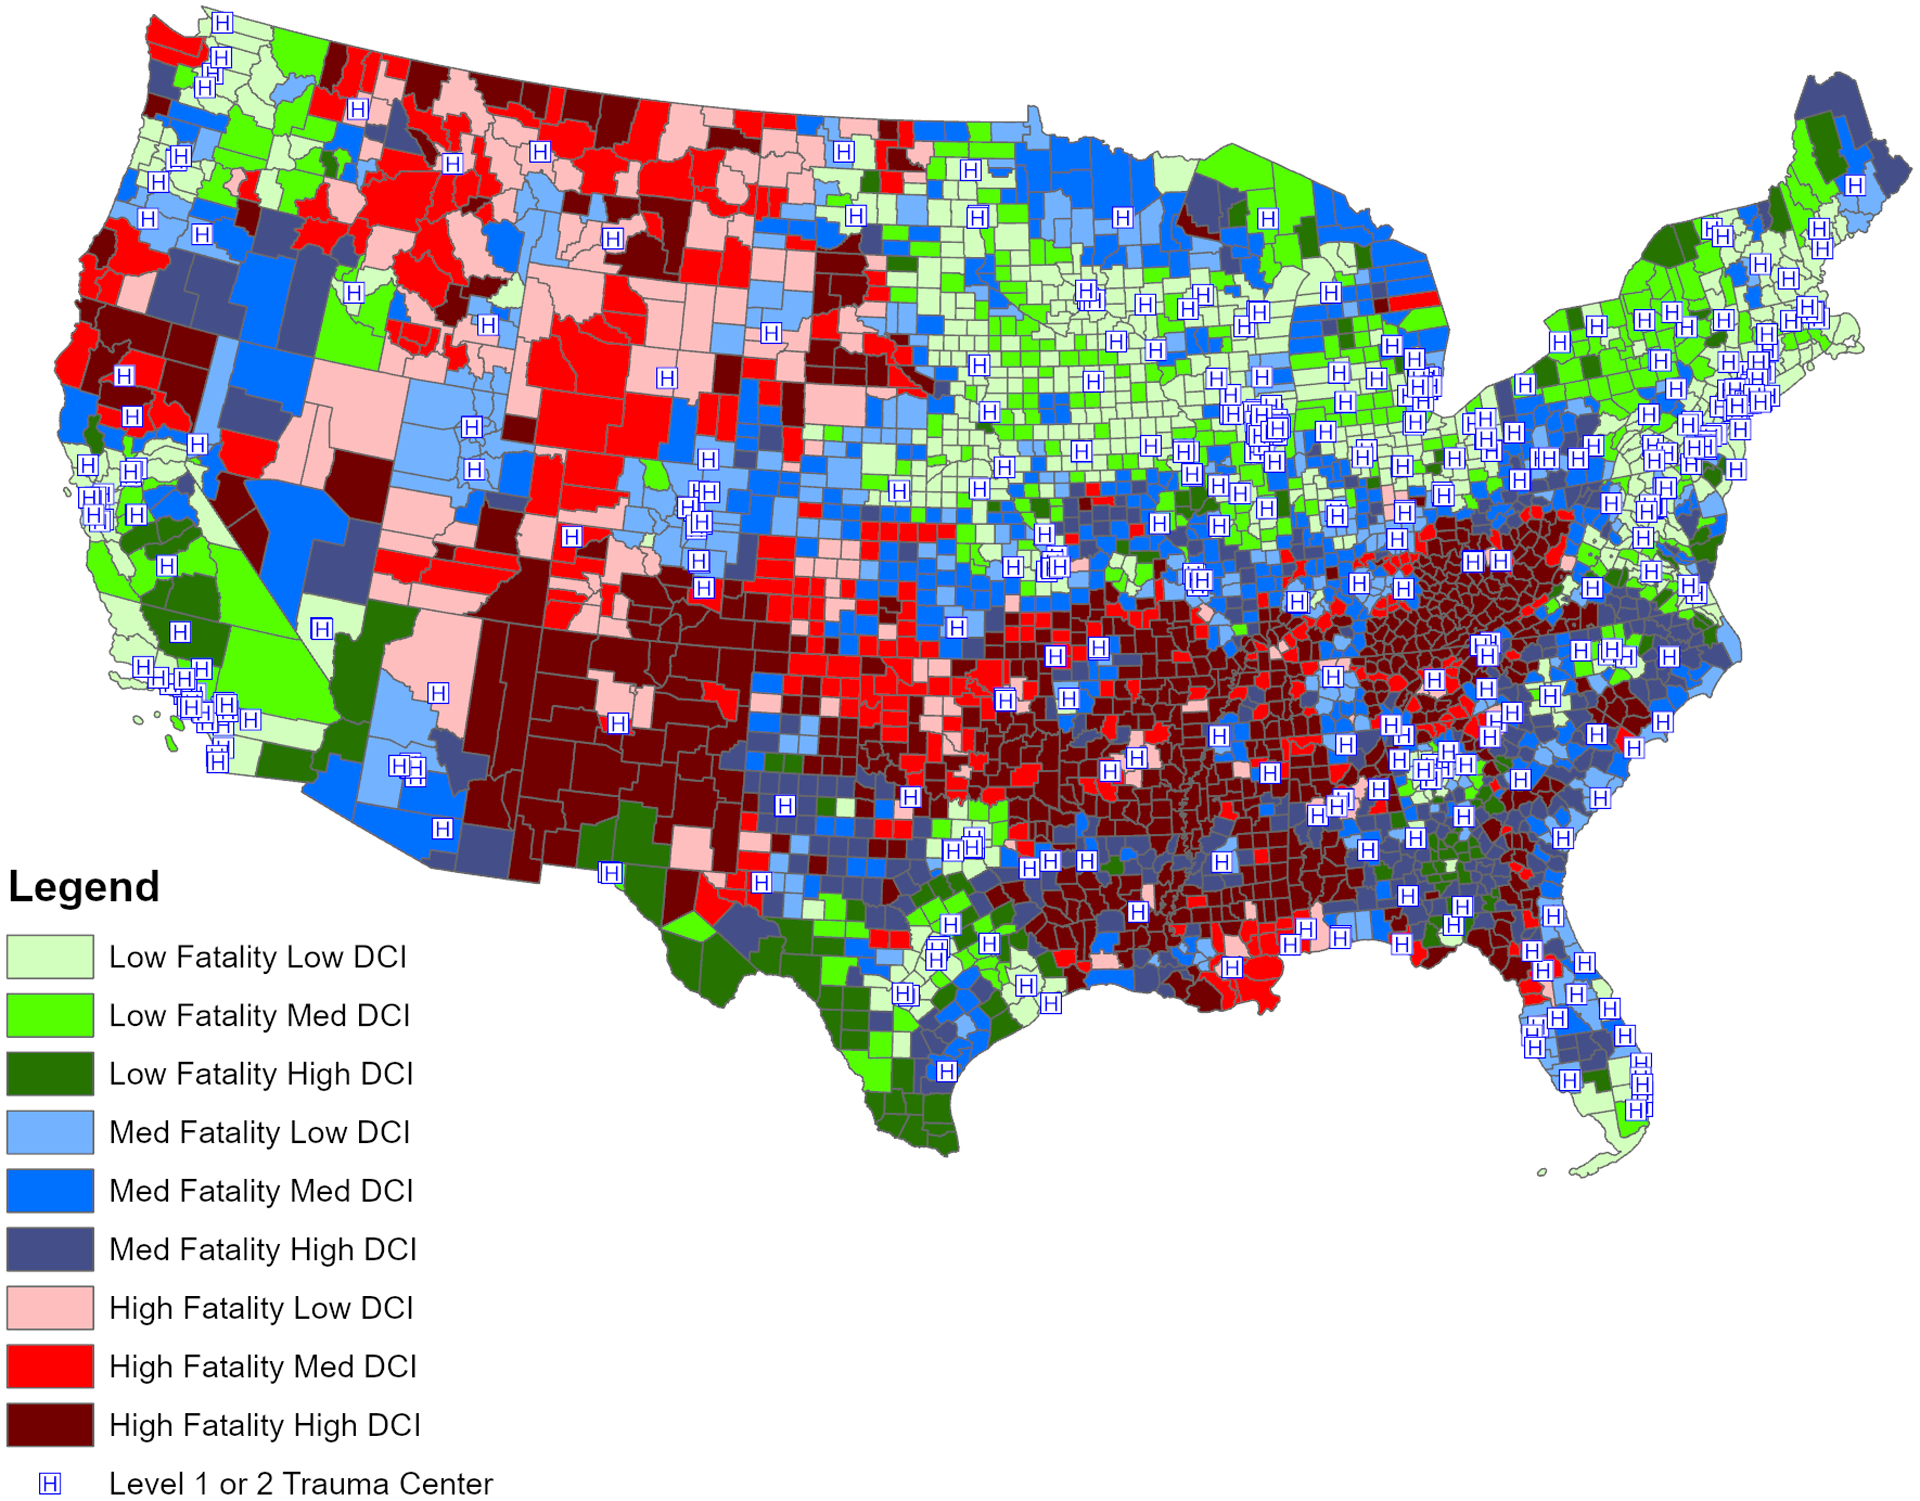
Bivariate choropleth map of all-cause trauma fatality and distressed community index (DCI) at the county level within the US. Terciles of trauma fatality (in low, medium, and high) are shaded as green, blue, and red, respectively. The gradients of each color from light to dark signify the low, medium, and high terciles of DCI. Level 1 or 2 Trauma Centers are overlaid.
Figure 2:

Bivariate choropleth map of all-cause trauma fatality and social vulnerability index (SoVI) at the county level within the US. Terciles of trauma fatality (in low, medium, and high) are shaded as green, blue, and red, respectively. The gradients of each color from light to dark signify the low, medium, and high terciles of SoVI. Level 1 or 2 Trauma Centers are overlaid.
Impact of Trauma System Access
Distance slightly attenuated the association across all indices and trauma fatality rates, as compared to correlation coefficients exhibited in Table 1, yet both distance and indices were statistically significant in each model (Appendix, Table A.2). Distance is a significant moderator for SVI across all fatality groups, whereas distance is only a significant moderator for firearm fatality within the SoVI, and there were no observed moderation effects for DCI. For SVI models, the magnitude of the effect of SVI on mortality tends to decrease as distance to the nearest trauma center increased for overall (distance Q1: 0.21; 0.17,0.25; p<0.001; Q2: 0.22; 0.18,0.27; p<0.001; Q3: 0.21; 0.16,0.26; p<0.001; Q4: 0.16; 0.09, 0.23; p<0.001) and firearm fatality rates (Q1: 0.08; 0.07,0.09; p<0.001; Q2: 0.09; 0.07,0.10; p<0.001; Q3: 0.08; 0.05,0.10; p<0.001; Q4: 0.02; −0.01, 0.04; p=0.27), while the magnitude of the effect for SVI on MVC fatality rates tends to increase as distance to the nearest trauma center increased (distance Q1: 0.06; 0.05,0.08; p<0.001; Q2: 0.11; 0.09,0.14; p<0.001; Q3: 0.13; 0.10.0.16; p<0.001; Q4: 0.09; 0.04,0.14; p<0.001). Within the SoVI model, the magnitude of the effect of SoVI on firearm mortality tends to decrease as distance increased (distance Q1: 0.06; 0.05,0.08; p<0.001; Q2: 0.05; 0.03,0.07; p<0.001; Q3: 0.06; 0.03,0.08; p<0.001; Q4: 0.03; 0.004,0.06; p<0.001).
DISCUSSION
Higher county social vulnerability correlates with higher county trauma fatality rates across all three indices examined. Despite this consensus, the indices were not created equal. DCI had the highest correlation coefficients, the best fit models, and the greatest diagnostic performance and AUC for each fatality rate. In addition to the DCI, variables such as the Census’s poverty and median income variables and the SVI’s housing and transport sub-index were highly associated with injury fatality rates at the county level. From a nationwide perspective, there is significant geographic variation in social vulnerability and injury fatality rates throughout the United States, with identifiable clusters of similar high and low fatality rate and social vulnerability. Upon further analysis, accounting for access to the nearest trauma center slightly attenuated the association across all indices but the association remained statistically significant, showing that while proximity to a trauma center does indeed lower fatality rates, the indices themselves were still important predictors of trauma fatality.
The goal of this study was to demonstrate that the utility of these ready-made, validated, and easy-to-implement social vulnerability indices extend beyond their intended use of natural disaster preparedness. In the US, the wide range of variation not only in vulnerability index values, but income, access to care, community resources, and educational levels are expressed in health disparities, including the burden of trauma fatality14. Trauma fatality inequitably affects communities that are more socially vulnerable, as seen with the clear upward trend of all-cause trauma fatality through the social vulnerability quintiles of each our three indices. According to the Economic Innovations Group, 16% of the US lives in the most socially vulnerable quintile, whereas 26% live in a least socially vulnerable quintile15. For the most socially vulnerable populations in our study, county trauma fatality rates increased by 33.1%−131.6% when compared with their least socially vulnerable counterparts. This large difference speaks to significant gaps in social issues impacting outcomes after injury.
Of note, the social vulnerability indices analyzed in our study are not synonymous with one another. Despite overlap in component variable themes, only a quarter of US counties fall within the same quintile across the three indices, indicating they capture related but distinct information. Further, the SoVI, SVI, and DCI perform differently when applied to county trauma fatality. Moreover, including more variables is not necessarily better. There was an inverse effect from number of census variables to strength in trauma correlation: where the DCI performed the strongest with just seven socioeconomic component variables, SVI performs moderately with 15 socioeconomic variables, and SoVI has the lowest association but has by far the most variables at twenty-nine. Nevertheless, each index added to trauma fatality prediction as seen in the diagnostic criteria assessment. We show that these indices alone explain between 10–31% of variation in county trauma fatality rates. Nearly half of county MVC fatality rate variation was explained using the final multivariable model of social vulnerability variables. Notably, poverty as an individual census variable had a strong association with injury fatalities rates and is an important concept to evaluate in the context of injury fatalities across the US.
The 2008 World Health Organization report states that ‘health follows a social gradient,’ and highlighted the importance of countries accurately capturing and implementing specific clinical, public health, and policies based on socioeconomic variation16. In other countries, such as New Zealand and the UK, deprivation indices inform and determine public health policies. These universally implemented indices are based on many dimensions of health such as housing, employment, and income. The US could benefit from a similar approach, as without a proper account of county disadvantage and vulnerability health interventions may render limited benefit17.
Social vulnerability indices have been evolving since the creation of the US’s first index in 1980’s18. In the past, researchers often used socioeconomic status and variables such as “occupation,” “income,” or “education level” as a proxy for the social determinants of health. Not until the SoVI was created in 2003 was a more in depth, multi-dimensional tool available, with the others to follow19. Previous disparity work relied heavily on individual census variables8, 20, however, there are several potential disadvantages to this approach. First, power will limit the number of variables investigators can include in a model, making it difficult or impossible to include all the potentially relevant confounders. Further, there is no clear consensus or guide of which composite of individual census variables is most important to include. Thus, utilizing a single validated index that captures multiple constructs of social determinants of health is an attractive prospect. In recent years, researchers have begun testing these ready-made and publicly available indices against long-term health outcomes. SVI was shown to be strongly associated with comorbidities in addition to being an accurate measure of surgical risk assessment8–10, 21. Consistent with our findings, a 2018 single area study (focused on residents from a single county vs. nonresident patients from surrounding counties) determined violent deaths are significantly higher in economically distressed areas by 52%, which falls within our nationwide estimates11. This prior study also showed that the DCI for the location of injury was a significant predictor in violent firearm events. Likewise, DCI was our strongest predictor in firearm fatality, explaining 31% of the variance of the age-adjusted firearm fatality rate.
Our study also utilized geospatial mapping to further analyze the geospatial determinants of health. Previous trauma geospatial analyses in the context of social disparity are confounded by limited size and only found trivial clusters of similar values12. However, we found significant clustering of both injury fatality rates and social vulnerability across the US when using a broader scope. In addition, we identified outliers within the US that could be studied with more granular healthcare systems and resource data in future directions.
This study is, to our knowledge, the first to compare the performance of three indices of social vulnerability in the context of injury outcomes across the US and begins to tease out the strengths and weaknesses in the vast array of socioeconomic indices for trauma. Importantly, these indices have the ability to identify and promote awareness on the factors that make a community more socially vulnerable. A targeted upstream approach, rather than a reactionary response , such as policy change, trauma resource allocation, and community outreach programs could address and level these inequities to better equip communities and their patients to respond to injury and improve patient outcomes22. This paper only scratches the surface of social vulnerability index importance in trauma and provides a first step towards improving health equity in the US. Further exploration of other publicly available composite indices such as the Area Deprivation Index (ADI) or Community Needs Index (CNI) may prove useful in social disparity research.
This investigation has several limitations to acknowledge. First, our study utilizes retrospective data from four different datasets which precludes casualty. In addition, these four datasets do not span a unified timeline. Community changes during these years could skew some of the results. Moreover, the data is seven years old at the time of publication, lagged due to the decennial nature of the census and availability of the most recent social vulnerability indices. Also, county level data cannot account for the complexities of patient-specific data. Although, this nation-wide analysis is generalizable, it is exploratory in that it describes correlation and geographical variation of trauma fatality and social vulnerability.
Conclusion
Increasing social vulnerability is associated with higher injury fatality rates in the US. There is significant social vulnerability and trauma fatality rate variation throughout the US, alluding to a missing link in trauma outcomes research. Our study identified high risk areas in the country for both trauma fatality and social vulnerability. The DCI performs the best across different types of injury fatality, and this validated index appears to be useful as an easy-to-implement method to account for social determinants of health in epidemiologic trauma outcomes studies. Future work should evaluate the utility of these indices with patient level data.
Supplementary Material
Acknowledgments and Research Data
The data that support the findings of this study are publicly available from the Economic Innovations Group at: https://eig.org/dci; the Center for Disease Control and Prevention Agency for Toxic Substance and Disease Registry at: https://www.atsdr.cdc.gov/placeandhealth/svi/index.html; University of South Carolina Hazards & Social Vulnerability Research Institute at: http://artsandsciences.sc.edu/geog/hvri/sovi%C2%AE-0; and Center for Disease Control and Prevention at Prevention and Control at: https://www.cdc.gov/injury/wisqars/index.html.
Dr. Deeb is supported by National Institutes of Health [Grant: 2T32GM008516-26, 2020]
Funding:
No funding or support was directly received to perform the current study.
Footnotes
This paper has been presented as a Quick Shot presentation at the 16th Annual Academic Surgical Congress, February 2–4th, 2021; Virtual Experience.
Conflicts of Interest:
The authors declare no funding or conflicts of interest.
References
- 1.Braveman P, Gottlieb L. The social determinants of health: it’s time to consider the causes of the causes. Public Health Rep. 2014;129Suppl 2:19–31. [DOI] [PMC free article] [PubMed] [Google Scholar]
- 2.Kolak M, Bhatt J, Park YH, Padrón NA, Molefe A. Quantification of Neighborhood-Level Social Determinants of Health in the Continental United States. JAMA Network Open. 2020;3:e1919928–e1919928. [DOI] [PMC free article] [PubMed] [Google Scholar]
- 3.Haider AH, Weygandt PL, Bentley JM, Monn MF, Rehman KA, Zarzaur BL, Crandall ML, Cornwell EE, Cooper LA. Disparities in trauma care and outcomes in the United States: a systematic review and meta-analysis. J Trauma Acute Care Surg. 2013;74:1195–1205. [DOI] [PMC free article] [PubMed] [Google Scholar]
- 4.Ertl A, Sheats KJ, Petrosky E, Betz CJ, Yuan K, Fowler KA. Surveillance for Violent Deaths - National Violent Death Reporting System, 32 States, 2016. MMWR Surveill Summ. 2019;68:1–36. [DOI] [PMC free article] [PubMed] [Google Scholar]
- 5.Bell N, Arrington A, Adams SA. Census-based socioeconomic indicators for monitoring injury causes in the USA: a review. Inj Prev. 2015;21:278–284. [DOI] [PMC free article] [PubMed] [Google Scholar]
- 6.Flanagan BEG, Edward W; Hallisey Elaine J.; Heitgerd Janet L.; and Lewis Brian. A Social Vulnerability Index for Disaster Management. JHSEM 8. [Google Scholar]
- 7.Bakkensen LA, Fox-Lent C, Read LK, Linkov I. Validating Resilience and Vulnerability Indices in the Context of Natural Disasters. Risk Anal. 2017;37:982–1004. [DOI] [PubMed] [Google Scholar]
- 8.Carmichael H, Moore A, Steward L, Velopulos CG. Using the Social Vulnerability Index to Examine Local Disparities in Emergent and Elective Cholecystectomy. J Surg Res. 2019;243:160–164. [DOI] [PubMed] [Google Scholar]
- 9.Huang DD, Shehada MZ, Chapple KM, Rubalcava NS, Dameworth JL, Goslar PW, Israr S, Petersen SR, Weinberg JA. Community Need Index (CNI): a simple tool to predict emergency department utilization after hospital discharge from the trauma service. Trauma Surg Acute Care Open. 2019;4:e000239. [DOI] [PMC free article] [PubMed] [Google Scholar]
- 10.Mehaffey JH, Hawkins RB, Charles EJ, Turrentine FE, Kaplan B, Fogel S, Harris C, Reines D, Posadas J, Ailawadi G, et al. Community level socioeconomic status association with surgical outcomes and resource utilisation in a regional cohort: a prospective registry analysis. BMJ Qual Saf. 2020;29:232–237. [DOI] [PubMed] [Google Scholar]
- 11.Tracy BM, Smith RN, Miller K, Clayton E, Bailey K, Gerrin C, Eversley-Kelso T, Carney D, MacNew H. Community distress predicts youth gun violence. J Pediatr Surg. 2019;54:2375–2381. [DOI] [PubMed] [Google Scholar]
- 12.Lasecki CH, Mujica FC, Stutsman S, Williams AY, Ding L, Simmons JD, Brevard SB. Geospatial mapping can be used to identify geographic areas and social factors associated with intentional injury as targets for prevention efforts distinct to a given community. J Trauma Acute Care Surg. 2018;84:70–74. [DOI] [PMC free article] [PubMed] [Google Scholar]
- 13.Schober P, Boer C, Schwarte LA. Correlation Coefficients: Appropriate Use and Interpretation. Anesth & Analg. 2018;126:1763–1768. [DOI] [PubMed] [Google Scholar]
- 14.Medicine Io. Unequal Treatment: Confronting Racial and Ethnic Disparities in Health Care. Washington, DC: The National Academies Press; 2003: 780. [PubMed] [Google Scholar]
- 15.Group EI. The Spaces Between Us. Available at: https://eig.org/wp-content/uploads/2020/10/EIG-2020-DCI-Report.pdf.Accessed:1/20/2021, 2021.
- 16.Organization WH. Closing the gap in a generation. Available at: https://www.who.int/publications/i/item/WHO-IER-CSDH-08.1.Accessed:1/20/2021, 2021.
- 17.Kind AJH, Buckingham WR. Making Neighborhood-Disadvantage Metrics Accessible - The Neighborhood Atlas. N Engl J Med. 2018;378:2456–2458. [DOI] [PMC free article] [PubMed] [Google Scholar]
- 18.Stevens G, Cho JH. Socioeconomic indexes and the new 1980 census occupational classification scheme. Soc Sci Res. 1985;14:142–168. [Google Scholar]
- 19.Cutter SL, Boruff BJ, Shirley WL. Social Vulnerability to Environmental Hazards*. Soc Sci Q. 2003;84:242–261. [Google Scholar]
- 20.Cinat ME, Wilson SE, Lush S, Atkins C. Significant correlation of trauma epidemiology with the economic conditions of a community. Arch Surg. 2004;139:1350–1355. [DOI] [PubMed] [Google Scholar]
- 21.Nguyen TN, Ngangue P, Bouhali T, Ryan BL, Stewart M, Fortin M. Social Vulnerability in Patients with Multimorbidity: A Cross-Sectional Analysis. Int J Environ Res Public Health. 2019;16. [DOI] [PMC free article] [PubMed] [Google Scholar]
- 22.Dave G, Wolfe MK, Corbie-Smith G. Role of hospitals in addressing social determinants of health: A groundwater approach. Prev Med Rep. 2021;21:101315. [DOI] [PMC free article] [PubMed] [Google Scholar]
Associated Data
This section collects any data citations, data availability statements, or supplementary materials included in this article.