Abstract
Flexible medical instruments, such as Continuum Dexterous Manipulators (CDM), constitute an important class of tools for minimally invasive surgery. Accurate CDM shape reconstruction during surgery is of great importance, yet a challenging task. Fiber Bragg grating (FBG) sensors have demonstrated great potential in shape sensing and consequently tip position estimation of CDMs. However, due to the limited number of sensing locations, these sensors can only accurately recover basic shapes, and become unreliable in the presence of obstacles or many inflection points such as s-bends. Optical Frequency Domain Reflectometry (OFDR), on the other hand, can achieve much higher spatial resolution, and can therefore accurately reconstruct more complex shapes. Additionally, Random Optical Gratings by Ultraviolet laser Exposure (ROGUEs) can be written in the fibers to increase signal to noise ratio of the sensors. In this comparison study, the tip position error is used as a metric to compare both FBG and OFDR shape reconstructions for a 35 mm long CDM developed for orthopedic surgeries, using a pair of stereo cameras as ground truth. Three sets of experiments were conducted to measure the accuracy of each technique in various surgical scenarios. The tip position error for the OFDR (and FBG) technique was found to be 0.32 (0.83) mm in free-bending environment, 0.41 (0.80) mm when interacting with obstacles, and 0.45 (2.27) mm in s-bending. Moreover, the maximum tip position error remains sub-millimeter for the OFDR reconstruction, while it reaches 3.40 mm for FBG reconstruction. These results propose a cost-effective, robust and more accurate alternative to FBG sensors for reconstructing complex CDM shapes.
I. Introduction
Minimally Invasive Surgery (MIS) has aroused a lot of interest because of the many advantages it offers, such as smaller incisions, shorter recovery times, and reduced pain. In this context, CDMs can be used in surgical tasks where significant dexterity and compliance is required [1] [2]. Compared to rigid link robots, CDMs can adopt various shapes, consequently, enhancing the reach of surgeons in confined spaces. [3] However, due to their flexibility, accurate shape sensing of the CDM can be challenging. In recent years, optical fiber sensors such as FBGs have been investigated as a way to provide shape sensing capabilities inside surgical needles and CDMs. Because of their small size, flexibility and insensitivity to electromagnetic fields, optical fiber sensors are perfect for such applications. Typically, each sensing fiber contains a few FBGs written along the fiber length at specific intervals, and as such they allow measurements of the instrument’s curvature at those limited predetermined locations. The spatial resolution of such sensors will thus be given by the distance between each of the FBGs written in the sensing fibers. Accurate shape reconstructions of CDMs when bending with relatively small curvature in free-of-obstacle environments have been demonstrated in the literature [4]. However, due to the limited spatial resolution, FBG-based sensors have difficulty resolving complex shapes where the curvature varies a lot along the instrument’s length. Examples of such cases are when the CDM is: 1) interacting with obstacles, 2) actuated to complex shapes such as s-bends, or 3) actuated to large curvatures. Since the CDM movement inside the human body is obviously a lot more complex than in free space, obstacles are to be expected, and there is therefore a need to be able to resolve those complex shapes, by using a fiber with more distributed sensors along its length.
OFDR is an interferometric technique that was first developed as a way to measure optical fibers’ reflectivity, and therefore detect losses or breaks in the fibers. Froggatt et al. [5] showed that it could also be used for sensing strain and temperature variations along a fiber’s length in the same way as a regular FBG, but in a completely distributed approach. As such, regular fiber can be used instead of expensive FBG sensors, and spatial resolution is no longer dependant on the physical position of those FBGs in the fiber, but rather on the fiber interrogator parameters. OFDR-based sensing has since been demonstrated to be very accurate for temperature and strain sensing [6], but also for distributed shape sensing [7]–[9]. OFDR interrogators are currently available with very fast acquisition speed (250 Hz) and spatial resolutions of less than 1 mm. However, signal to noise ratio (SNR) is typically very low due to the small backscattering of regular optical fibers. This limits the sensing accuracy that can be obtained with such high acquisition speeds and spatial resolutions.
In order to enhance the sensing accuracy, Random Optical Gratings by Ultraviolet Emission (ROGUEs) can be written in the fiber core to increase backscatter by up to 50 dB. This enhancement in backscatter results in more than an order of magnitude improvement in sensing accuracy [10]. As such, those sensors can provide very accurate measurements at a high acquisition rate and spatial resolution.
In this paper, we fabricate and incorporate both the FBG- and OFDR-based sensors into a surgical CDM developed for orthopedic MIS and provide a full comparison of the shape reconstruction results in all potential surgical scenarios: 1) free environment CDM articulation, 2) CDM articulation when interacting with obstacles, and 3) complex shapes such as s-bending. To the best of our knowledge, this is the first implementation of OFDR in CDM shape sensing, and the first study comparing it to the conventional FBG technology.
II. Methods
A. FBG-based sensing
In conventional shape reconstruction approach, first the strain at each FBG node is found by (1) and then based on the sensor’s geometry, a system of nonlinear equations (2) is solved at each cross section with three FBG nodes (fibers a, b, and c placed in a triangular configuration (Fig. 1(a)) to find curvature (κ), the curvature angle (ϕ), and a common strain bias (ϵ0) at each active area cross section of the sensor:
| (1) |
| (2) |
where λB is the Bragg wavelength, pe is the strain constant for optical fiber and r, γ are geometrical parameters that can be found by calibration [11]. Of note, the wavelength shift reported in (1) is a function of temperature and mechanical strain. However, the longitudinal temperature variations along the sensor’s length will be included in the common strain bias ϵ0 and cancelled out by the algorithm, while the transverse temperature variations between fibers is considered negligible. Assuming a relationship (typically linear) between curvature and arc length, and dividing the sensor length to n sufficiently small segments, curvature (κ) and its direction (ϕ) can be extrapolated at each segment (3). Using the curvature at each segment (κi for i = 1, …, n) slope of each segment can be found via (4). By attaching an appropriate local coordinate frame to the beginning of each segment (Fig. 1-a), the overall sensor (and CDM) shape can be reconstructed segment by segment, and consequently, the CDM tip position can be found:
| (3) |
| (4) |
| (5) |
Fig. 1.
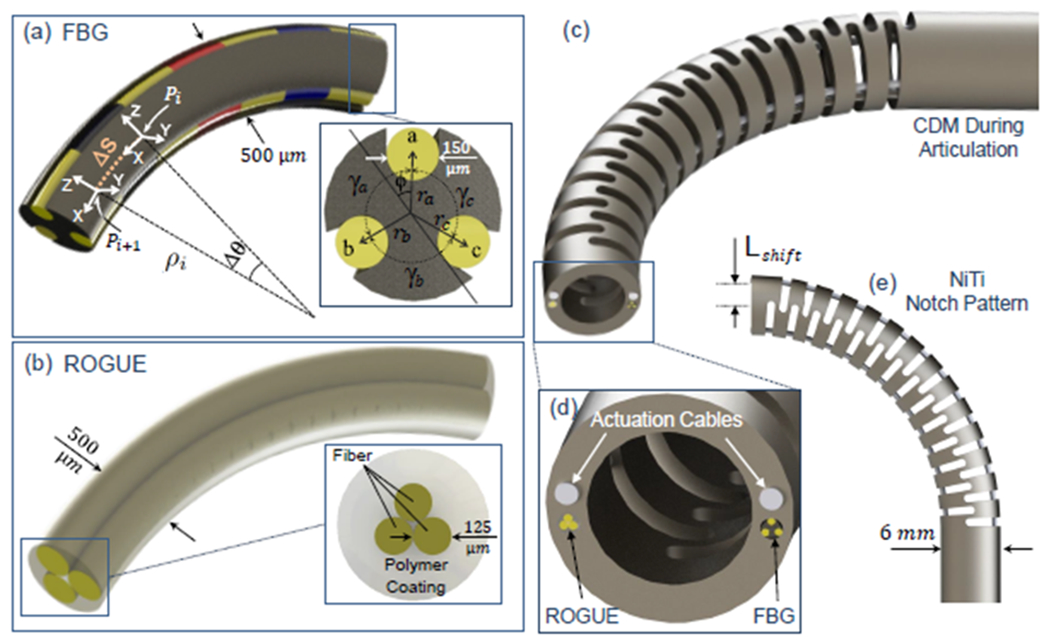
(a) the FBG fiber triplet with three active areas, (b) the ROGUE fiber triplet with distributed sensing, (c) CDM during articulation, (d) CDM tip view showing the actuation cables, the FBG, and the ROGUE triplet integrated into the CDM, (e) NiTi notch pattern in the CDM design
Using (5) for i = 1, …, n, the tip position of the sensor (Pn) is found. For CDMs in which the FBG sensor is not placed on the central axis (back-bone) of the CDM (such as the one studied in this paper), all Pis are then transformed by a homogeneous transformation with identity rotation and translation of Lshift (Fig. 1(e), offset between the sensor’s and the CDM’s centers) to obtain the 3-D position of the center-line of the CDM.
B. OFDR distributed sensing
The OFDR method for distributed sensing was first described by Froggatt et al. in 1998 [5]. In order to perform the strain measurements, a Tunable Laser Source (TLS) scans the Fiber Under Test (FUT) across a certain scanning bandwidth Δλ (see Fig. 2(a)). A Fourier transform is then performed to transfer this signal in the spatial domain, thus obtaining the FUT reflectivity as a function of position. For every sensing point xm in the fiber, a certain gauge length Δx is then defined (dashed rectangle in Fig. 2(b)). This gauge length defines the spatial resolution of the system. A longer gauge length means more data points can be used, and thus better sensing resolution can be obtained, but the spatial resolution decreases. An inverse Fourier transform is then performed across this gauge length to return in the spectral domain. The sample measurement is then compared to a reference measurement, and the cross-correlation between sample and reference measurement results in a peak, shown in Fig. 2(e). The position of that peak gives the spectral shift for this specific point across the fiber length. This spectral shift is proportional to both temperature and strain variations between reference and sample measurements, as described in (6):
| (6) |
Fig. 2.
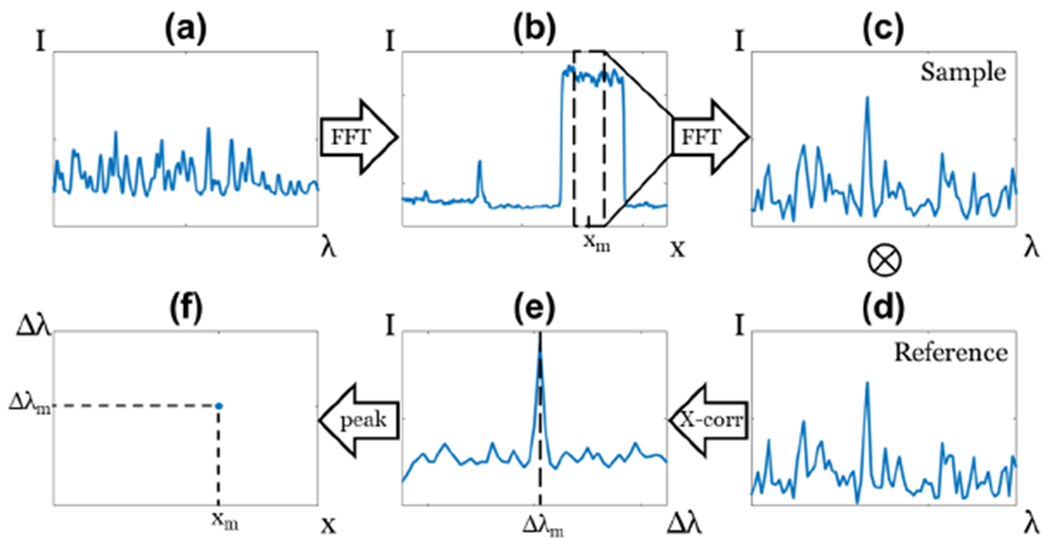
Cartoon illustrating the different OFDR steps for a single sensor along the fiber’s length. Steps are (a) signal in the spectral domain, (b) signal in the spatial domain, (c) gauge length window in the spectral domain, (d) cross-correlation with the reference, (e) cross-correlation result and (f) spectral shift along the fiber’s length. Steps (c) to (f) are repeated for every sensing point along the sensing region
As for the FBG technique, the temperature dependence in equation (6) will be included in the common strain bias ϵ0 and cancelled out by the algorithm. Those calculations are then performed for every sensing point along the desired sensing region. After the strain in all three fibers is measured at each sensing point, using equations (2-5), the shape can be reconstructed in a similar fashion.
C. ROGUE writing
The ROGUE fabrication process is covered in Ref. [10]. Briefly, the random grating is written using a 213 nm Q-switched laser in a Talbot interferometer scheme, presented in Fig. 3. The phase mask separates the ultraviolet light in two beams, which are then recombined on a moving optical fiber, resulting in an interference pattern written on the photosensitive fiber as it is being moved. The random electric signal applied on the piezoelectric element results in an overall random pattern written in the fiber, generating the ROGUE. The fiber used was an SMF-28 from Corning, a standard telecommunications fiber, that was loaded with deuterium to enhance photosensitivity. However, because the standard fiber coating has very high UV absorption, it had to be removed prior to the ROGUE writing.
Fig. 3.
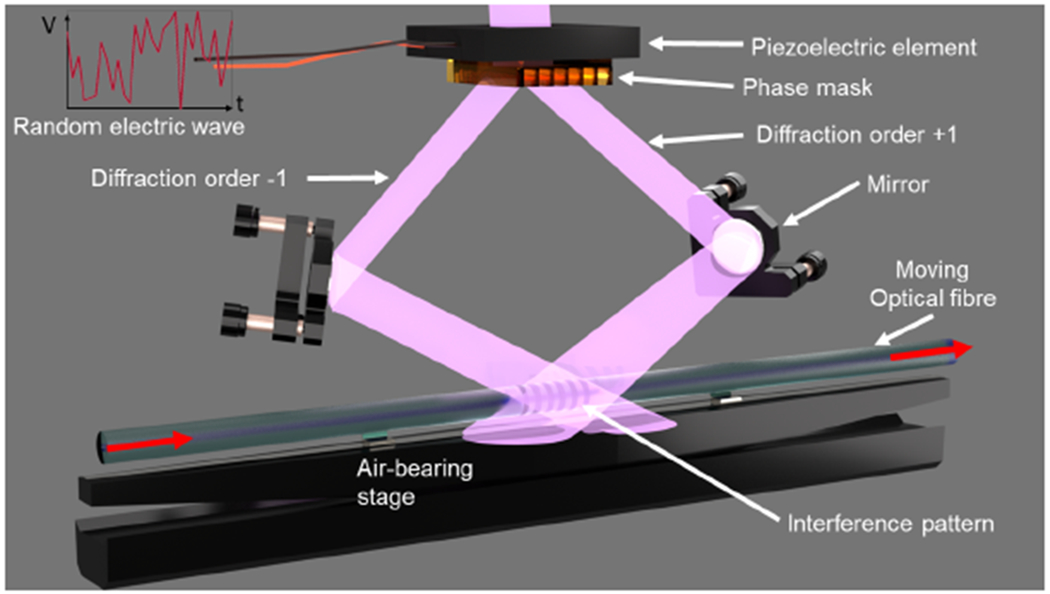
ROGUE writing setup [10]
III. Experimental setup
A. FBG fiber triplet
The FBG sensor used for this study has three FBG fibers attached to a flexible NiTi wire with an OD of 500 μm in a triangular configuration (Fig. 1-a). Three grooves (radially 120° apart from each other) are engraved by laser (Potomac, USA) along the length of the wire to hold three fibers each with three 10 mm-spaced FBG nodes (Technica S.A, China). The fibers are glued into the engraved notches using epoxy glue (J-B Clear Weld Quick Setting Epoxy). Due to its relatively small OD, the NiTi wire can withstand curvatures of as small as 20 mm radius during bending, which is sufficient to cover the large deflections of the CDM [12], [13].
B. ROGUE fiber triplet
The ROGUE fiber triplet used for the OFDR was fabricated using a different manufacturing technique, described in Ref. [14]. Using a polymer extrusion, this technique protects the uncoated optical fibers where the ROGUEs were inscribed by encapsulating them in a polymer coating, as well as fixing their geometrical configuration. Furthermore, as all three fibers are being pulled continuously, this allows the fabrication of triplets of arbitrarily large lengths, thus enabling possible industrial implementation.
Because this fabrication method does not offer a control on the fiber position which is as accurate for the method used for the FBGs, additional steps were taken to characterize the fibers’ arrangement inside the triplet. To do so, a tomography workbench was developed to non-destructively image and reconstruct the fibers’ positions along the triplet’s length. Fig. 4 shows this characterization setup. The triplet is imaged in transmission, and rotated across 180°. This results in a tomogram of the transmitted light as a function of the rotation angle. This transmitted light is simply the line integral of the light’s propagation through the triplet, and the tomogram consists of different projections of this line integral. In order to recover the cross-section image of the fiber triplet, all that is needed is to apply the correct transformation. In this case, the transformation is the inverse Radon transform, as described by A. M. Cormack [15]. Fig. 5 displays an example of the fibers’ position reconstruction.
Fig. 4.
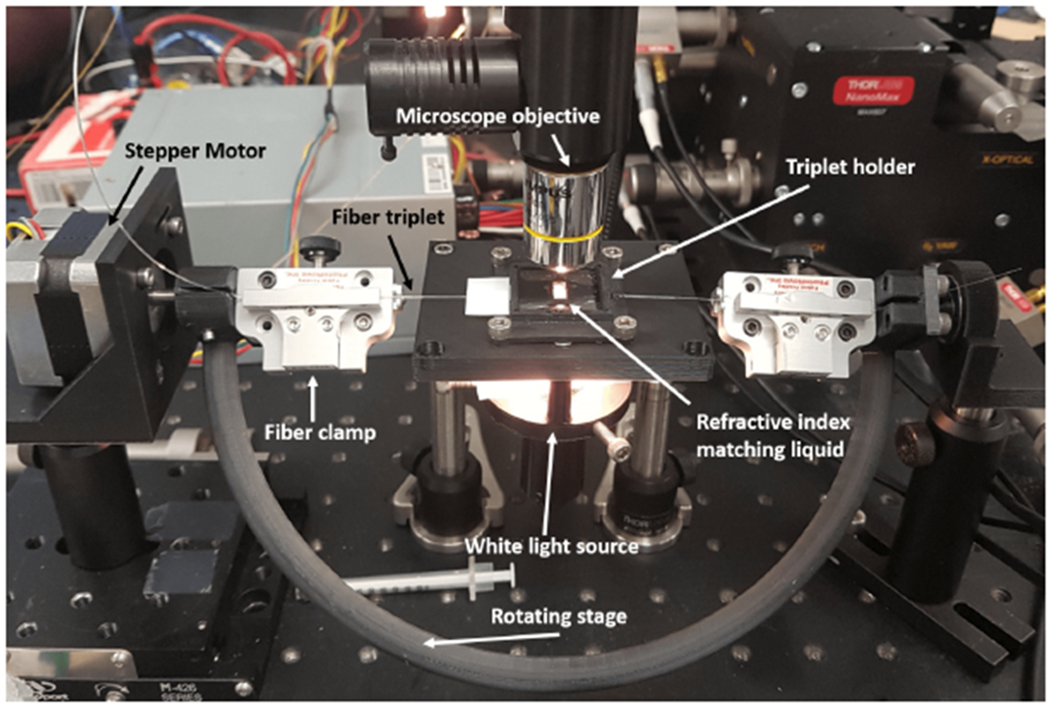
Tomography calibration setup. The fiber triplet is held by two fiber clamps (PhotoNova Inc.) that are rotated by a stepper motor across 180°. Every 0.9°, a camera captures the transmitted image, magnified by a microscope objective. A 3D printed triplet holder maintains the triplet in position, but allows it to rotate freely. The triplet is bathed in a refractive index matching liquid that diminishes the refractive index variation between the polymer and the ambiant air.
Fig. 5.
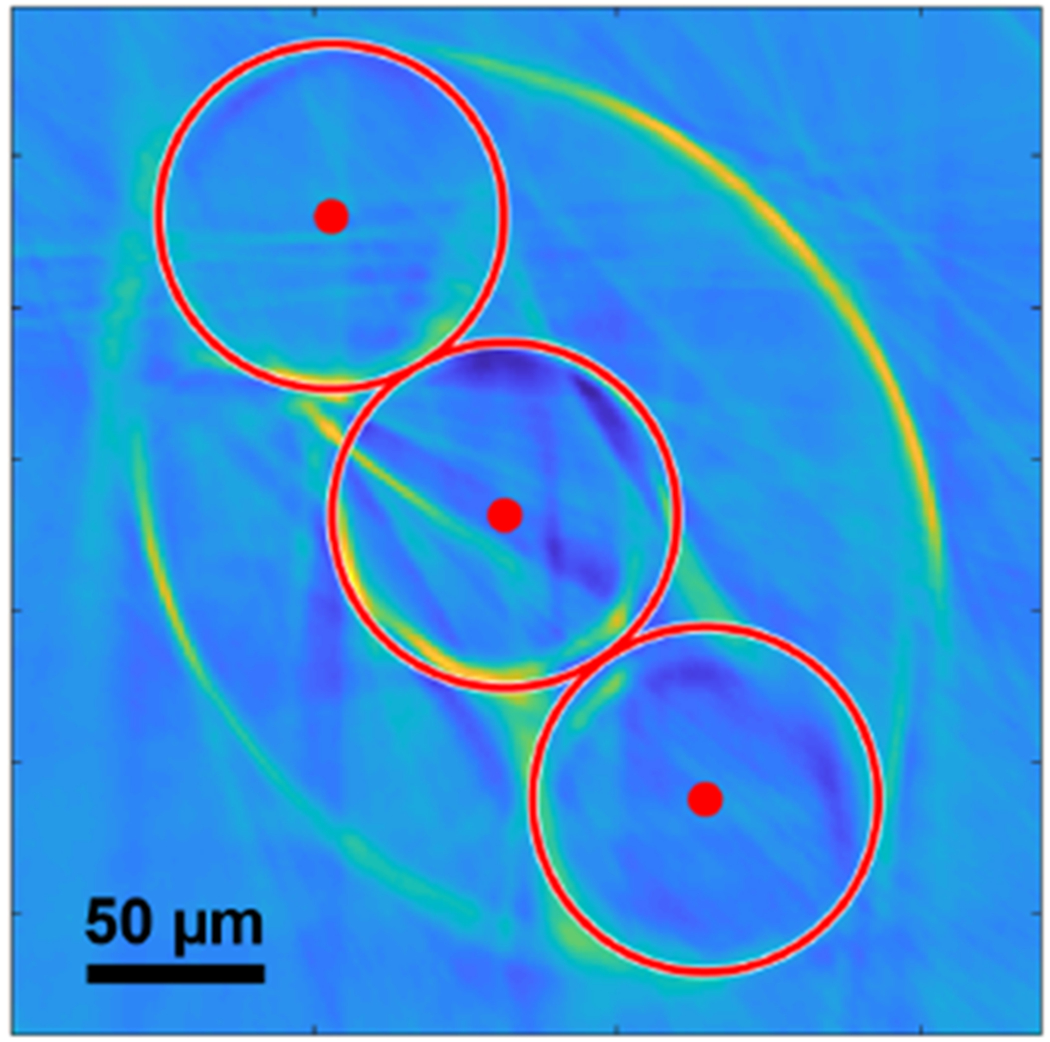
Reconstruction of the fibers’ position inside the triplet by tomography. The oval shape of the overall triplet can be observed, as well as all three fibers’ position inside the triplet (red dots) and the reconstructed circles corresponding to the fibers’ diameter (red circles).
As can be observed, if an equilateral triangle configuration had been assumed, the results would be very inaccurate. Such an important deviation from the expected triangular shape can be explained by the triplet fabrication process. As the initial triplet was over 500 μm in diameter, it was too large to fit inside the CDM’s sensing channels (Fig. 1(d)). Therefore, some of the excess polymer had to be melted off to reduce the triplet’s diameter. However, this caused the fibers inside the triplet to move away from the triangular arrangement, further confirming the importance of this characterization step. In the future, the triplet fabrication process could be optimized to achieve triplets of smaller diameter, either by better control of the extrusion parameters (speed, temperature, etc.) or by the choice of a polymer with different properties. This would ensure better control over the geometrical configuration of the fibers.
This triplet was interrogated using a commercially available OFDR interrogator (ODiSI-B, Luna Innovations Inc.). The interrogation settings were set to 24 Hz, with a 0.65 mm spatial resolution. Those settings were the ones that offered the best spatial resolution, but are however limited in the acquisition speed. The interrogation unit can achieve up to 250 Hz acquisition speeds, but in this case spatial resolution decreases to 2.6 mm.
C. CDM Assembly and Actuation Unit
The CDM used in this study was developed primarily for the orthopedic MIS, constructed from a Nitinol (NiTi) tube with several notches (Fig. 1(e)) to achieve flexibility. The overall length of the flexible part the CDM is 35 mm, with the Outside Diameter (OD) chosen as 6 mm based on the application requirements [16]. As shown in Fig. 1(d), the CDM’s wall contains four lengthwise channels for passing actuation cables and the fiber optic sensors (FBG and ROGUE triplets) described in sections III-A and III-B. The CDM is mounted on a custom-designed actuation unit (Fig. 6) which contains two motors (RE16, Maxon Motor Inc.) with spindle drive (GP16, Maxon Motor, Inc.) to actuate the CDM cables. A custom C++ interface with a Qt-based GUI performs independent velocity or position control of the motors to desired user set-points during the experiments.
Fig. 6.
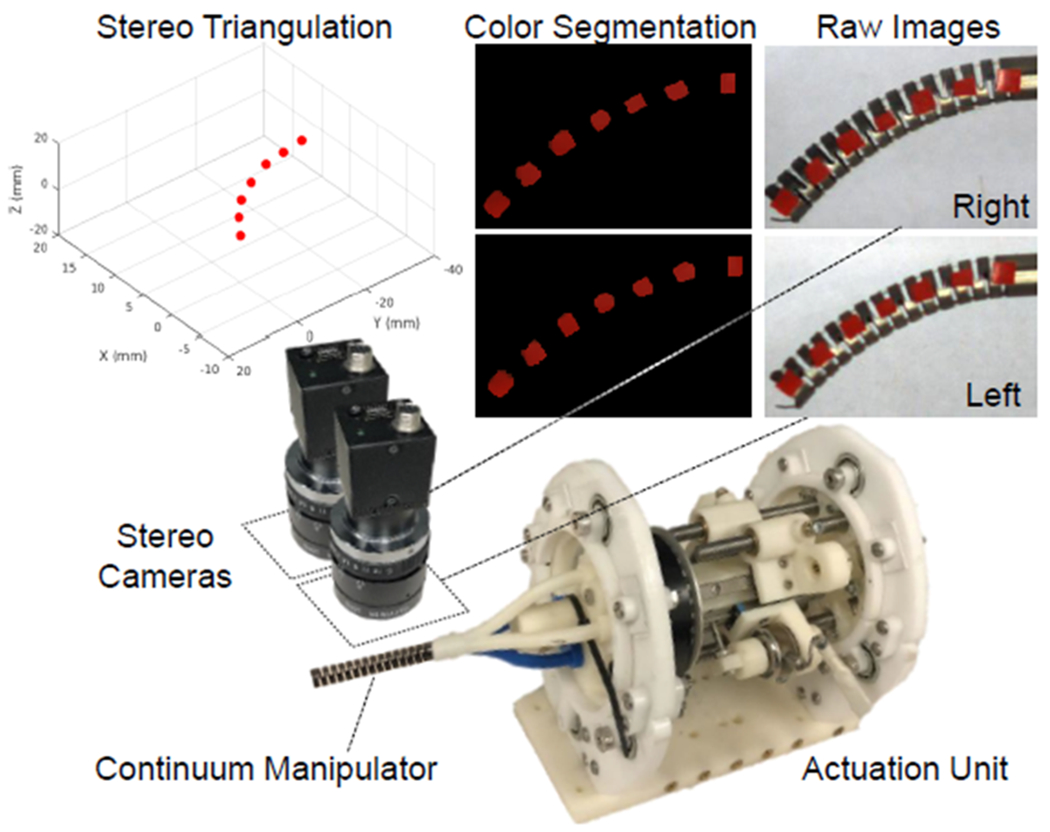
The experimental setup including the CDM actuation unit integrated with a calibrated stereo camera pair. Raw images obtained from the camera pair are first color-segmented and then 3D locations of the markers are computed by triangulation.
D. Stereo Camera for Shape Ground Truth
To compare the shape reconstruction results from the FBG and the ROGUE fiber triplets, a stereo camera setup with 1024 × 768 resolution was used to track colorized markers (red) attached to the center-line of the CDM. The stereo camera pair was calibrated using the stereo camera calibration toolbox in MATLAB with an overall mean error of 0.12 pixels. For each stereo image pair, the 2D pixel locations of the marker centers were found in each image by applying a color segmentation with experimentally-determined thresholds. The intrinsic and extrinsic parameters from the calibration procedure were then used in custom-written Python code to find the corresponding markers within the two color-segmented images and obtain the 3D location of the markers by triangulation [17]. An erosion morphological operation, followed up with a dilation were applied to the segmented images to remove potential noise in the color segmentation algorithm. Of note, the 0.12 pixel error during the calibration process results in 0.02 mm mean 3D position accuracy error when triangulating and measuring the distance between two markers with known pre-determined spacial locations on a custom-designed validation jig.
IV. Results and discussion
In this study, three sets of experiments were considered, inspired by CDM motions in a MIS surgical procedure. In the first one, the CDM was bent in free environment, without any obstacles. In this case, the curvature is relatively uniform along the CDM’s length, resulting in a C-like shape. Fig. 7(a) shows the snake bending in free environment. In this case, curvature was κ = 50 m−1 (corresponding to 20 mm radius of curvature). In the second case, obstacles were placed in different places along the CDM’s path. This forced the CDM to take on a more complex shape, resulting in a more complex curvature to recover. These experiments were designed to imitate the behaviour of the CDM in real work environment, where obstacles such as bone, tissue, organs, etc. are inevitable. Finally, in the last experiment, an S-shape was forced on the CDM, in order to see the limitations of both techniques when attempting to resolve a more complex shape. This S-shape is presented in Fig. 7(b).
Fig. 7.
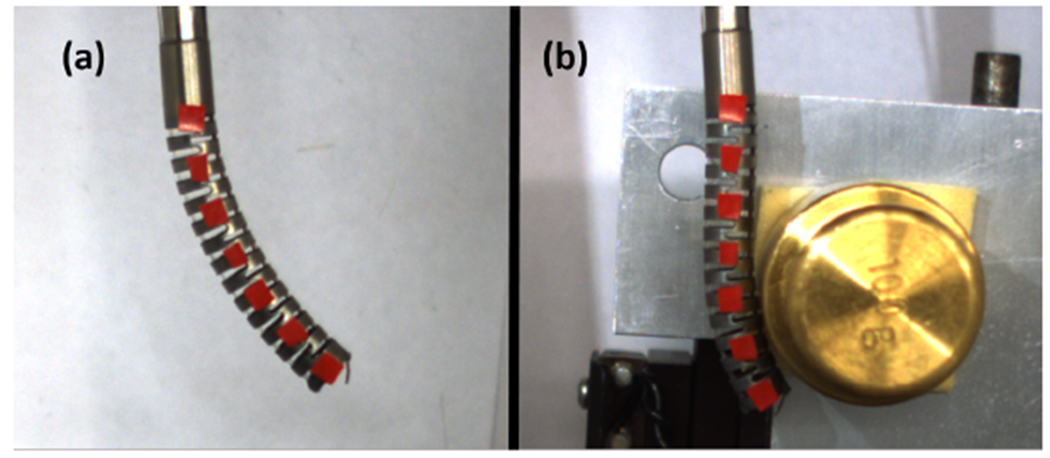
CDM bending in (a) free environment and (b) S-shape. The red markers are used in conjunction with a pair of stereo cameras as ground truth to compare the shape reconstruction.
A. Free environment CDM bending
The first measurement was performed when the CDM was bent in free environment. Previous studies showed good accuracy for FBG-based sensing, typically for relatively small needle and CDM curvatures [4], [11]. Fig. 8(a) shows the results of the FBG-based sensor, while Fig. 8(b) shows the results for the ROGUE-based sensor, recovered by the OFDR technique. As expected, both FBG and OFDR techniques showed relatively good accuracy. Indeed, for small curvatures, both methods result in tip accuracy error of less than 0.5 mm. As had been reported previously in literature, the error increases for larger curvatures, to reach up to 2 mm tip accuracy error. However, it can be observed that the OFDR technique remains accurate for much larger curvatures than the FBG-based technique, all the way up to κ = 50 m−1 (corresponding to 20 mm radius of curvature). It should be noted that, even though Sefati et al. recently demonstrated that more accurate results could be obtained using data-driven approaches [18], [19], in this case, both techniques are evaluated solely using the conventional model. This allows us to evaluate the accuracy of both technologies directly, and techniques such as the one demonstrated by Sefati et al. could then be applied to the OFDR measurements as well to even further reduce this accuracy error.
Fig. 8.
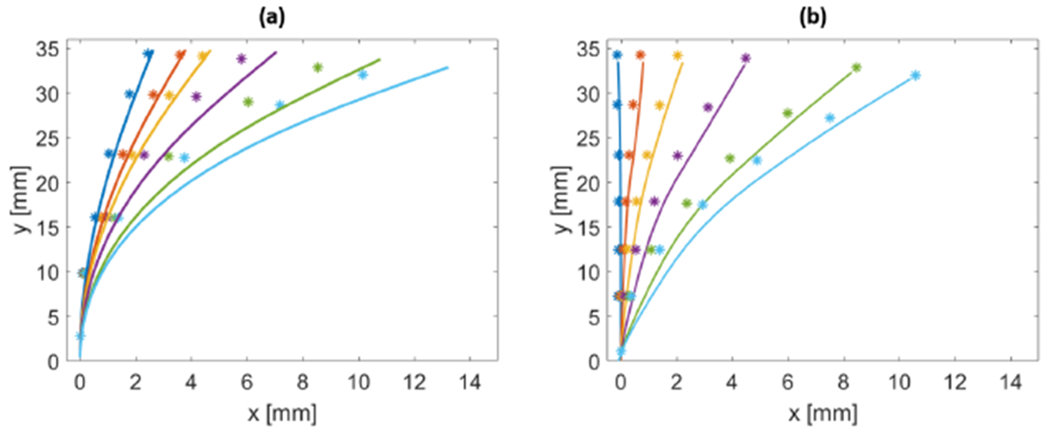
Free-bending CDM reconstruction using (a) the FBG-based sensor and (b) the ROGUE-based sensor. In both cases, the asterisk markers show the ground truth, obtained by the pair of stereo cameras, while the solid line show the reconstructed shape, in 2D.
B. Interaction with obstacles
However, it is when interacting with obstacles that the very high spatial resolution of the OFDR technique really shines. Indeed, when those obstacles interact with the CDM, they force it to adopt a more complex shape, with quicker variations in curvature along the CDM’s length. Since the FBG triplets can only perform sensing where the FBGs are inscribed (in this case, in only three locations), they cannot recover the shape as accurately as the triplets based on the OFDR technique, which can perform sensing all along the sensor’s length. Fig. 9 compares the accuracy of both sensors, with obstacles placed at the tip of the CDM (solid lines) and in the middle (dashed lines). As can be observed, the OFDR technique clearly outperforms the FBG technique when interacting with obstacles placed both at the tip of the CDM and alongside it.
Fig. 9.
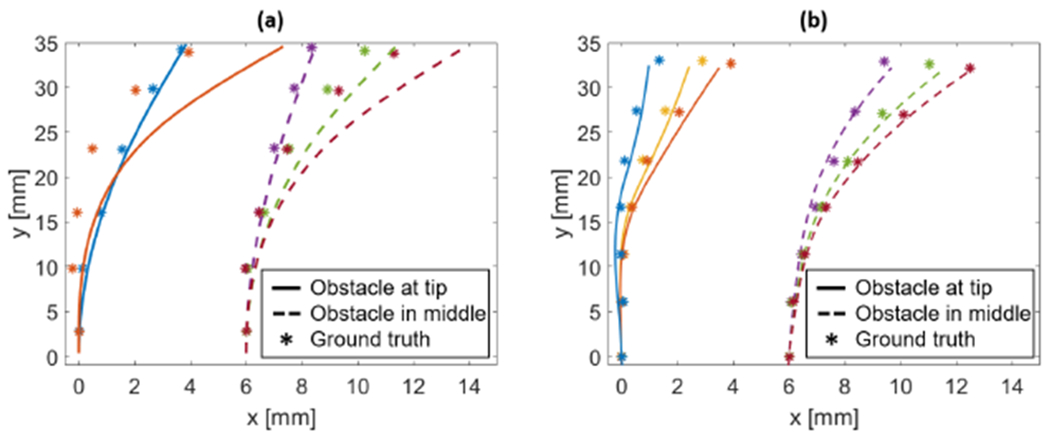
CDM shape reconstruction when interacting with obstacles using (a) the FBG-based sensor and (b) the ROGUE-based sensor. In both cases, the asterisk markers show the ground truth, obtained by the pair of stereo cameras. The solid lines show the reconstructed shape when the obstacle is placed at the tip of the CDM, while the dashed line correspond to the shape when the obstacle is placed in the middle of the CDM. The latter is translated by 6 mm in the graphs to avoid superposition of the plots.
C. S-bending
The ”S-bends” are the most complex shapes that were investigated in this study, because of their multiple inflection points. They could be the result of the CDM’s interaction with multiple obstacles, or could be intentionally achieved to go around a solid obstacle for example. They can also evaluate the limits of both techniques. Fig. 10 shows the reconstruction of S-bends applied on the CDM again both for FBG and ROGUE sensors, for increasingly complex shapes. As can be observed on Fig. 10(a), even the most simple S-bend cannot be accurately measured by the FBG sensors, and as the bend curvature increases, the tip error becomes increasingly large. On the contrary, on Fig. 10(b), a fairly accurate reconstruction can be observed for the investigated S-bends.
Fig. 10.
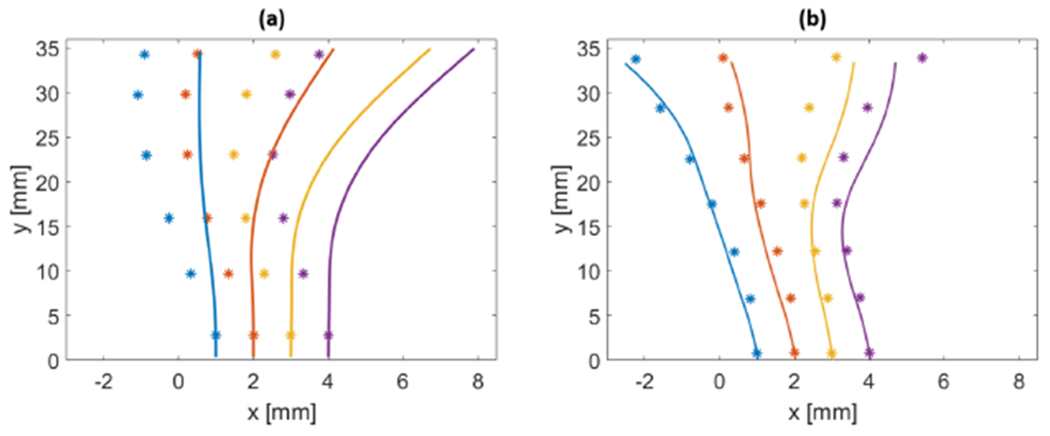
CDM S-bend reconstruction using (a) the FBG-based sensor and (b) the ROGUE-based sensor. In both cases, the asterisk markers show the ground truth, obtained by the pair of stereo cameras, while the solid line is the reconstructed shape. Individual plots are translated by 1 mm on the graphs to avoid superposition.
From those results, the tip position error can be obtained by comparing the ground truth and the shape reconstruction. Tip position errors for all three experiments are compiled and the two investigated techniques are compared in Table I. As can be observed, the OFDR technique outperforms the conventional FBG method by a factor of 2 for both free-bending and obstacles interaction. The tip position error is even more precise in the case of S-bending, where the mean error is 2.27 mm in the case of the FBG technique, while it remains very low at 0.45 mm for the OFDR technique.
TABLE I.
CDM tip position error for the various experiments performed, comparing FBG and OFDR techniques’ accuracy
| Experiment | Tip position error [mm] | |||||
|---|---|---|---|---|---|---|
|
| ||||||
| Mean | Std | Max | ||||
|
| ||||||
| FBG | OFDR | FBG | OFDR | FBG | OFDR | |
|
| ||||||
| Free-bending | 0.83 | 0.32 | 0.89 | 0.29 | 2.34 | 0.96 |
| Obstacles | 0.80 | 0.41 | 0.97 | 0.21 | 3.02 | 0.76 |
| S-bend | 2.27 | 0.45 | 1.16 | 0.22 | 3.40 | 0.72 |
In order to compare not only the tip position accuracy of both methods, but also the overall shape deviation, errors between all ground truth markers and the reconstructed shapes were calculated. Those results are compiled in Table II. As can be observed, while the mean errors for the FBG technique is relatively low for the free-bending and obstacles experiments, the maximum error is still large and definitely outperformed by the OFDR technique. Furthermore, it can be observed that while the OFDR technique is also able to reliably reconstruct S-bends with comparable accuracy, this is simply not feasible using the FBG technique (maximum error of 3.96 mm).
TABLE II.
CDM shape deviation error for the various experiments performed, comparing FBG and OFDR techniques’ accuracy
| Experiment | Shape deviation error [mm] | |||||
|---|---|---|---|---|---|---|
|
| ||||||
| Mean | Std | Max | ||||
|
| ||||||
| FBG | OFDR | FBG | OFDR | FBG | OFDR | |
|
| ||||||
| Free-bending | 0.50 | 0.28 | 0.64 | 0.3 | 2.34 | 1.37 |
| Obstacles | 0.44 | 0.17 | 0.64 | 0.17 | 3.02 | 0.76 |
| S-bend | 1.33 | 0.27 | 1.06 | 0.24 | 3.96 | 0.96 |
It should be noted that, while the FBG sensor used in this study only had three FBGs written in each fiber, it would be possible to have sensors with a larger FBG density, thus increasing the spatial resolution. However, the manufacturing costs would increase accordingly, and the fabrication of a sensor with FBGs spaced by as little as 0.65 mm would be a major challenge in itself. In contrary, the ROGUE fabrication setup is very simple, and can be used to fabricate sensors of arbitrary lengths at low costs. While the geometrical configuration of the ROGUE triplet used in this study was far from ideal, progress has already been made in optimizing the manufacturing process, as demonstrated by our most recently extruded sensors displayed in Fig. 11.
Fig. 11.
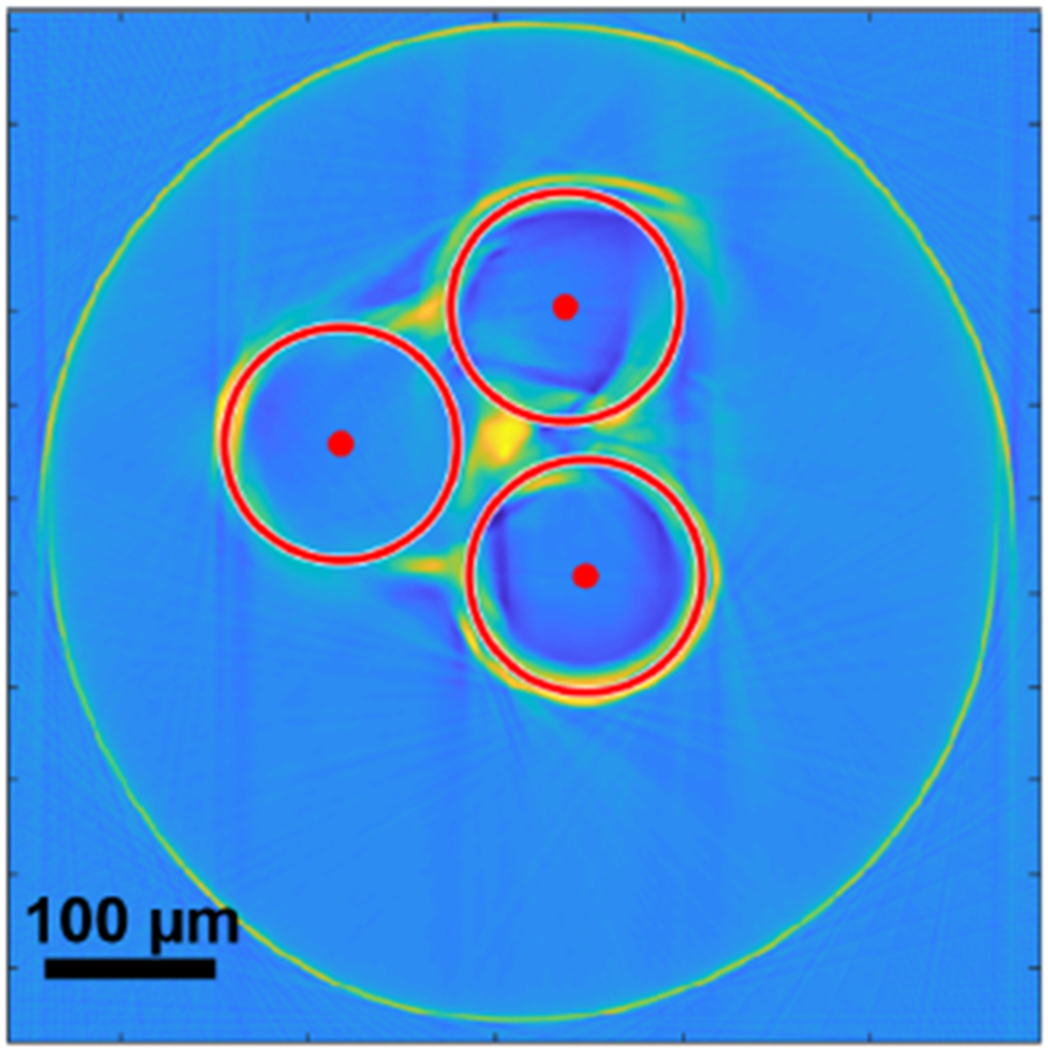
Reconstruction of the most recently manufactured triplets. As can be observed, the fibers’ configuration is much closer to the optimal equilateral triangle. The red dots indicate the fibers’ centers, while the red circles show their diameters.
V. Conclusion
In this comparison study, we have shown that the OFDR method, combined with the additional SNR increase provided by the ROGUEs, provides better CDM tip position accuracy than the conventional FBG-based shape reconstruction method. The greater spatial resolution also allows the reconstruction of more complex shapes, such as those that could arise after collisions with obstacles, or S-bends resulting from multiple inflexion points. While the extrusion process used for the triplet manufacturing has not yet been fully optimized, the characterization setup described in this paper is able to compensate for the misalignment of the fibers and provide more accurate results than with the conventional FBG technique, even when the three fibers are in an almost straight line, far from the ideal equilateral triangle configuration. By optimizing the manufacturing process of those fiber triplets, better control could be obtained on the position of the fibers inside the triplet, which would potentially further increase the shape reconstruction accuracy. The interrogation parameters could also be optimized to achieve greater acquisition speeds, for example by decreasing the spatial resolution from 0.65 to 1 or 2 mm, thus decreasing the calculation times at little costs to shape sensing accuracy.
Acknowledgments
This project has received funding from the Natural Sciences and Engineering Research Council of Canada (NSERC), the Fonds de Recherche du Qubec - Nature et Technologies (ERQNT), and NIH/NIBIB grants R01EB016703 and 1R01CA235134-01.
References
- [1].Burgner-Kahrs J, Rucker DC, and Choset H, “Continuum robots for medical applications: A survey,” IEEE Transactions on Robotics, vol. 31, no. 6, pp. 1261–1280, 2015. [Google Scholar]
- [2].Qi P, Zhang C, Li J, Li Z, Dai JS, and Althoefer K, “A compact continuum manipulator system with enhanced steering abilities for robot-assisted surgery,” in 2016 6th IEEE International Conference on Biomedical Robotics and Biomechatronics (BioRob). IEEE, 2016, pp. 49–54. [Google Scholar]
- [3].Liu H, Ji Z, Li J, Zhou Y, Wang C, and Ba P, “As shape continuum robot with a single actuation structured by niti slices,” in 2017 IEEE International Conference on Robotics and Biomimetics (ROBIO). IEEE, 2017, pp. 401–405. [Google Scholar]
- [4].Shi C, Luo X, Qi P, Li T, Song S, Najdovski Z, Fukuda T, and Ren H, “Shape sensing techniques for continuum robots in minimally invasive surgery: A survey,” IEEE Transactions on Biomedical Engineering, vol. 64, no. 8, pp. 1665–1678, 2016. [DOI] [PubMed] [Google Scholar]
- [5].Froggatt M and Moore J, “High-spatial-resolution distributed strain measurement in optical fiber with rayleigh scatter,” Applied Optics, vol. 37, no. 10, pp. 1735–1740, 1998. [DOI] [PubMed] [Google Scholar]
- [6].Gifford DK, Froggatt ME, and Kreger ST, “High precision, high sensitivity distributed displacement and temperature measurements using ofdr-based phase tracking,” in 21st International Conference on Optical Fiber Sensors, vol. 7753. International Society for Optics and Photonics, 2011, p. 77533I. [Google Scholar]
- [7].Westbrook PS, Kremp T, Feder KS, Ko W, Monberg EM, Wu H, Simoff DA, Taunay TF, and Ortiz RM, “Continuous multicore optical fiber grating arrays for distributed sensing applications,” Journal of Lightwave Technology, vol. 35, no. 6, pp. 1248–1252, 2017. [Google Scholar]
- [8].Parent F, Loranger S, Mandal KK, Iezzi VL, Lapointe J, Boisvert J-S, Baiad MD, Kadoury S, and Kashyap R, “Enhancement of accuracy in shape sensing of surgical needles using optical frequency domain reflectometry in optical fibers,” Biomedical optics express, vol. 8, no. 4, pp. 2210–2221, 2017. [DOI] [PMC free article] [PubMed] [Google Scholar]
- [9].Parent F, Gerard M, Monet F, Loranger S, Soulez G, Kashyap R, and Kadoury S, “Intra-arterial image guidance with optical frequency domain reflectometry shape sensing,” IEEE transactions on medical imaging, vol. 38, no. 2, pp. 482–492, 2018. [DOI] [PubMed] [Google Scholar]
- [10].Monet F, Loranger S, Lambin-Iezzi V, Drouin A, Kadoury S, and Kashyap R, “The rogue: a novel, noise-generated random grating,” Optics express, vol. 27, no. 10, pp. 13 895–13 909, 2019. [DOI] [PubMed] [Google Scholar]
- [11].Roesthuis RJ, Kemp M, van den Dobbelsteen JJ, and Misra S, “Three-dimensional needle shape reconstruction using an array of fiber bragg grating sensors,” IEEE/ASME transactions on mechatronics, vol. 19, no. 4, pp. 1115–1126, 2013. [Google Scholar]
- [12].Sefati S, Pozin M, Alambeigi F, Iordachita I, Taylor RH, and Armand M, “A highly sensitive fiber bragg grating shape sensor for continuum manipulators with large deflections,” in 2017 IEEE SENSORS. IEEE, 2017, pp. 1–3. [Google Scholar]
- [13].Sefati S, Alambeigi F, Iordachita I, Armand M, and Murphy RJ, “Fbg-based large deflection shape sensing of a continuum manipulator: Manufacturing optimization,” in 2016 IEEE SENSORS. IEEE, 2016, pp. 1–3. [Google Scholar]
- [14].Lorre P, Monet F, Gauthier M, Poiffaut A, Roberge A, Kadoury S, and Kashyap R, “Extruded optical fiber triplets for 3d shape sensing for minimally invasive surgery,” in Seventh European Workshop on Optical Fibre Sensors, vol. 11199. International Society for Optics and Photonics, 2019, p. 111991L. [Google Scholar]
- [15].Cormack A, “Reconstruction of densities from their projections, with applications in radiological physics,” Physics in Medicine & Biology, vol. 18, no. 2, p. 195, 1973. [DOI] [PubMed] [Google Scholar]
- [16].Sefati S, Murphy R, Alambeigi F, Pozin M, Iordachita I, Taylor R, and Armand M, “Fbg-based control of a continuum manipulator interacting with obstacles,” in Intelligent Robots and Systems (IROS), 2018 IEEE/RSJ Int. Conference, 2018, pp. 1–7. [Google Scholar]
- [17].Zisserman RHA, “Multiple view geometry in computer vision,” 2004.
- [18].Sefati S, Hegeman R, Alambeigi F, Iordachita I, and Armand M, “Fbg-based position estimation of highly deformable continuum manipulators: Model-dependent vs. data-driven approaches,” in 2019 International Symposium on Medical Robotics (ISMR). IEEE, 2019, pp. 1–6. [Google Scholar]
- [19].Sefati S, Sefati S, Iordachita I, Taylor RH, and Armand M, “Learning to detect collisions for continuum manipulators without a prior model,” in International Conference on Medical Image Computing and Computer-Assisted Intervention. Springer, 2019, pp. 182–190. [Google Scholar]


