

Abstract
Glycomics, i.e. the high-throughput analysis of carbohydrates, has yet to reach the level of ease and import of its counterparts, genomics and proteomics, due to the difficulties inherent in carbohydrate analysis. The advent of lectin microarray technology addresses many of these problems, providing a straightforward approach for glycomic analysis. However, current microarrays are limited to the available lectin set, which consists mainly of plant lectins isolated from natural sources. These lectins have inherent problems including inconsistent activity and availability. Also, many plant lectins are glycosylated, complicating glycomic evaluation of complex samples, which may contain carbohydrate-binding proteins. The creation of a recombinant, well-defined lectin set would resolve many of these issues. Herein, we describe an efficient strategy for the systematic creation of recombinant lectins for use in microarray technology. We present a small panel of simple-to-purify bacterially-derived lectins that show reliable activity and define their binding specificities by both carbohydrate microarray and ELISA. We utilize this panel to create a recombinant lectin microarray that is able to distinguish glycopatterns for both proteins and cell samples. This work opens the door to the establishment of a vast set of defined lectins via high-throughout approaches, advancing lectin microarray technology for glycomic analysis.
Introduction
The surface of cells is a dense mosaic of carbohydrate polymers that encode information critical for cellular recognition events. The oligosaccharides present on both proteins and lipids are involved in interactions as varied as the T-cell recognition of antigen presenting cells1 and the pathogenesis of microorganisms and viruses.2 Dynamic changes in the glycome have been associated with disease progression in numerous cancers and with cell differentiation.3,4 Despite the fact that the cell devotes enormous amounts of energy forming these ubiquitous glycosides,5,6 the importance of sugars in nature has been largely unappreciated in part because of the analytical challenge presented by glycans.7–10 Recent work from our laboratory to address the challenges of high-throughput carbohydrate analysis, also known as glycomics, has focused on the creation of lectin microarray technology.11–14 These arrays are new but invaluable tools for the rapid assessment of glycosylation and have been used to monitor the carbohydrate composition of glycoproteins, changes in the glycome associated with differentiation and to discriminate between bacterial strains.12–14
Lectins are commonly used for the structural characterization of carbohydrates and are defined as non-enzymatic proteins, excluding antibodies, that bind mono- and oligosaccharides reversibly and with high specificity.5,15 Plant lectins were the first to be discovered and remain the most extensively used lectin type for carbohydrate analysis. However, there are several issues associated with this lectin class. First, they are isolated and purified from natural sources. This leads to inconsistencies in activity and availability due to seasonal changes and differences in purification, which can cause variations dependent on manufacturer source and timeframe obtained. Since natural sources can also become depleted, there is the additional concern of availability. Second, the majority of plant lectins exist as glycoproteins. Although this fact is often overlooked, the plant lectins themselves can serve as potential receptors for carbohydrate-binding proteins, complicating interpretation of carbohydrate-based interactions between lectins and more complex samples such as whole cells. In addition, only a limited number of plant lectins are readily available, restricting the range of glycans that can be observed using lectin microarray technology. Resolving these issues requires the creation of a well-defined recombinant, lectin set. Previous work on plant lectins has shown that recombinant plant lectins tend to yield either unprocessed pro-lectins or highly aggregated structures that require denaturation and refolding for activity, making them unattractive targets for a recombinant lectin panel and any subsequent protein engineering.16–21
Bacteria express lectins on filamentous appendages that extend past the cell surface (known as fimbriae or pili), which mediate attachment to host cells by recognition of specific oligosaccharides.22,23 Based on the available crystal structures,24–29 bacterial lectins are not known to be glycosylated. Also, although few bacterial lectins have been identified, there is a high probability that a large diversity of undiscovered bacterial lectins exist or can be created from existing templates.23 Thus, bacterial lectins are an ideal starting point for the creation of a recombinant lectin set. Herein, we present a new strategy for the creation of well-defined recombinant lectins for use in lectin microarray and other lectin-based technologies (Fig. 1). We demonstrate this strategy by creating a small panel of bacterially-derived lectins that are easy to purify and show reliable and well-defined activity. We utilize this panel to create a completely recombinant lectin microarray that is able to distinguish glycopatterns for both proteins and cell samples. The incorporation of both GST and His6 fusion tags into our lectins with no noticeable effects on specificity provides the possibility of an oriented microarray. In addition, the creation of lectin mutants that can act as negative controls adds another level of quality control to our microarrays. This work opens the door to the creation, via protein evolution and discovery, of a precise and reproducible lectin library for carbohydrate analysis while resolving many of the limitations inherent in the use of naturally derived plant lectins.
Fig. 1.
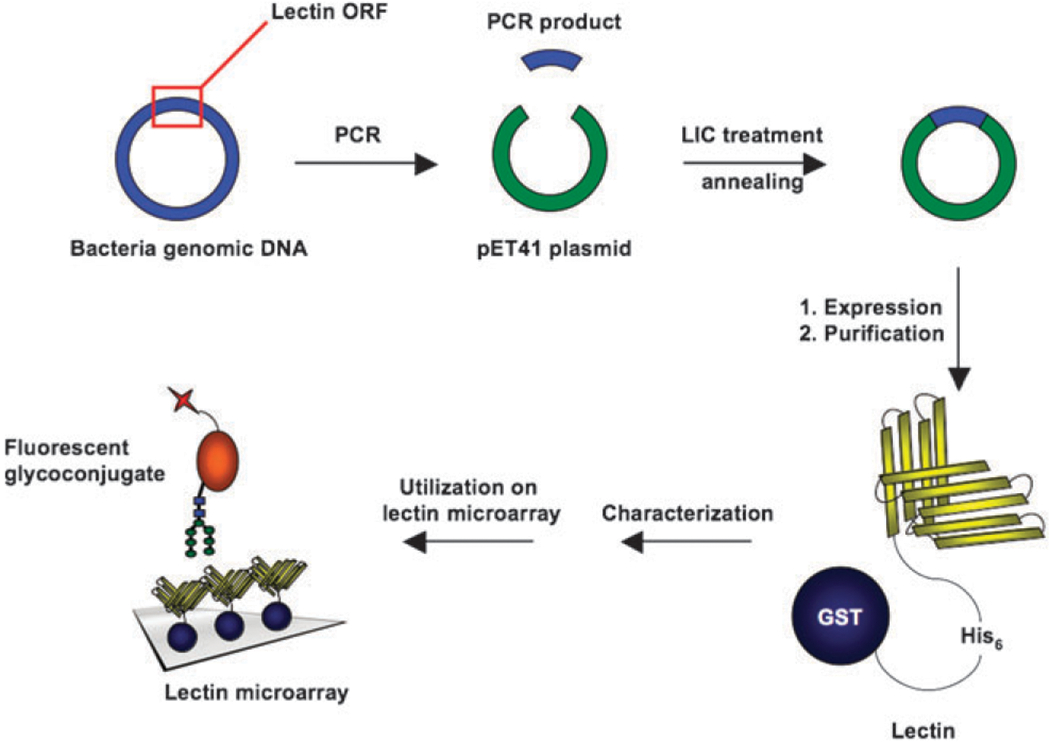
General strategy for systematic production and characterization of recombinant lectins. ORF of lectin domains are amplified by PCR and inserted into pET-41 LIC vector. Lectins are expressed in E. coli as fusion proteins and purified by glutathione affinity chromatography. The binding specificity of lectins is characterized by carbohydrate microarrays and ELISA using fusion tags for detection. Finally, recombinant lectins are utilized in a microarray format for the analysis of fluorescently labeled carbohydrate samples.
Results and discussion
Generalized strategy for cloning and expression of recombinant lectins
To facilitate the creation of a diverse library of recombinant bacterial lectins (Table 1), we needed to find a systematic strategy for the cloning, expression and purification of this protein class. In looking for a system that would simplify both the cloning and the purification we identified several criteria. We wanted a system that would allow us to clone directly into an expression vector and not require the use of restriction enzymes, allowing us to use the same vector for all lectins cloned. In addition, we wanted to introduce fusion tags to the proteins. This was desirable for several reasons. First, we wanted a single purification method that could be used for all of our lectins. Most bacterial lectins are isolated directly from the pili or purified using carbohydrate-affinity chromatography.28–35 Second, genetically encoded fusion tags allow us to detect the proteins with a consistent label. This circumvents problems seen with chemically-based protein labeling, such as biotinylation, and allows more quantitative assessment of lectin activity.36,37 Third, the inclusion of a fusion tag opens up the possibility of orienting the lectins for the creation of a more uniform microarray.38–40 The pET-41 LIC/Ek vector system fit all of our criteria. With this system the lectins can be expressed as fusion proteins with both N-terminal GST and His6 tags (Fig. 1).
Table 1.
Recombinant bacterial lectin panel
| Lectin | Source | Specificity | References |
|---|---|---|---|
| GafD | F17 fimbriae (Escherichia coli) | β-GlcNAc | 34 |
| PA-IL | Non-fimbriae (Pseudomonas aeruginosa) | Galactose | 69 |
| PA-IIL | Non-fimbriae (Pseudomonas aeruginosa) | Fucose/Mannose | 29, 70 |
| PapGII | P-pili (Escherichia coli) | GbO4 | 33 |
| PapGIII | P-pili (Escherichia coli) | GbO5 | 33 |
| RS-IIL | Non-fimbriae (Ralstonia solanacearum) | Mannose/Fucose | 54 |
| GafD-m | F17 fimbriae (Escherichia coli) | β-GlcNAc (80% reduction in binding) | 26 |
For our initial panel, we chose lectins that had been previously cloned (Table 1).34 Once our lectins were cloned into the pET-41 vector, expression was optimized. Critical factors for expression of our proteins in good yield were the media and induction conditions. Optimal results were obtained by using a combination of Terrific broth and 1% lactose giving yields of ~1–2 mg of purified protein per litre of culture. Purification of all lectins utilized standard affinity chromatography via the GST-tag using glutathione columns followed by dialysis, giving active protein whose purity was monitored by SDS-PAGE (see ESI Fig. S1 ‡).
Although there are scattered reports of bacterial lectins being expressed as maltose-binding protein (MBP) fusions,31–33,41 this is not an ideal tag for the creation of carbohydrate-binding proteins as MBP is itself a carbohydrate binder. To our knowledge, GST has not been used as a tag for bacterial lectins and none of the lectins in our panel have been expressed as GST-fusion proteins. Thus, it was unknown whether bacterial lectins in general would tolerate a GST-N-terminal fusion tag. Here, we show that, despite the structural diversity of our lectin panel (PA-IL, PA-IIL and RS-IIL are known tetramers while GafD, PapGII and PapGIII are monomeric pilin proteins), good yields of active protein were achieved for all 7 lectins as N-terminal GST–His6 fusions. Comparison of different preparations of the proteins showed no difference in activity demonstrating the reproducibility of our recombinant lectins.
Lectin glycosylation
One issue that is often ignored in carbohydrate analysis is that the majority of plant lectins are glycosylated.42 These glycans are required for proper processing of the lectins and are one reason that bacterial expression of plant lectins often results in inclusion bodies.19–21,43 The carbohydrates on lectins complicate lectin-based glycan analysis as carbohydrate-binding proteins present in complex samples can bind them leading to false positives. This problem is not exclusive to microarray analysis, but affects any assay involving multiple protein–carbohydrate interactions. Although we do not anticipate, based on the crystal structure data, that our recombinant bacterial lectins will be glycosylated, we decided to test our panel using the broadly specific lectin Concanavalin A (ConA, Fig. 2a), which lacks glycosylation on the mature protein.44 The plant lectins MAA, SNA, and UEA-I are known glycoproteins and serve as positive controls, while ConA and GNA, which lack post-translational glycosylation serve as negative controls for this assay.42 Our results clearly demonstrate the difference in glycosylation status between many of the plant lectins and our recombinant lectin set which display at most negligible binding to ConA. This data is in good agreement with available crystal structures which show no post-translational modifications of these bacterially derived lectins (Fig. 2b).
Fig. 2.
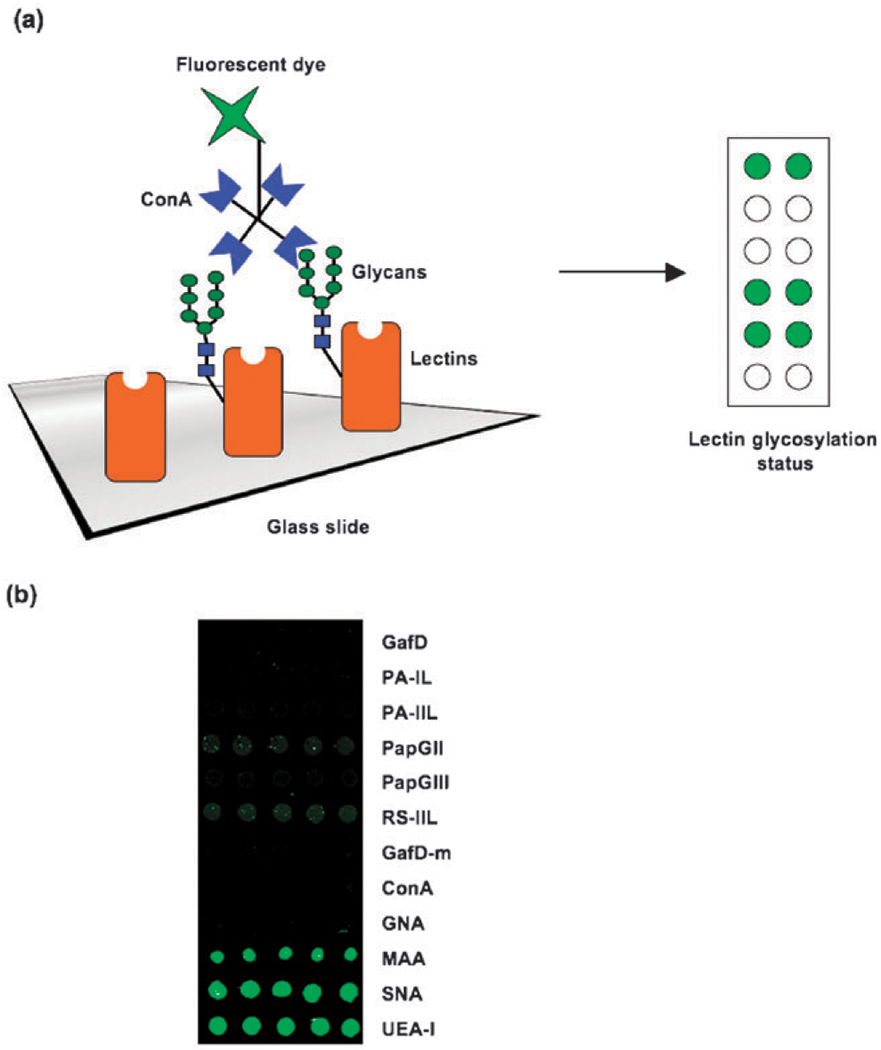
Lectin glycosylation. (a) Biotinylated ConA (3.1 μg) was hybridized to the microarray and the presence of lectin glycosylation was detected using Cy3-streptavidin (0.25 μg). (b) Comparison of glycosylation between plant and recombinant bacterial lectins. In all arrays, lectins were printed at 0.5 mg mL−1.
Carbohydrate microarray analysis of recombinant bacterial lectins
To both better define the specificity of our lectin panel and verify that our cloning and expression strategy results in active and specific lectins, we subjected our lectins to carbohydrate microarray analysis. It was not known whether the N-terminal fusions would affect the activity and/or specificity of the lectins. It should be noted that the majority of published specificities for these lectins are based on (a) agglutination assays using whole cells where assessment of specificity is complicated due to the diverse collection of glycans present on cell surfaces45 and/or (b) assays with a limited range of substrates.46 Our carbohydrate microarray contains a wide variety of structurally defined epitopes and glycoproteins and provides semi-quantitative analysis of relative binding affinities of a lectin for a wide variety of substrates.44,47 A list of the carbohydrate ligands is supplied in the ESI, Table S2.‡ Lectins hybridized to the array were detected using the His6 tag via the addition of a mouse anti-His tag monoclonal antibody followed by incubation with a Cy3 labeled anti-mouse antibody.48 The results are depicted as a heat map showing the fluorescence intensity of binding towards each carbohydrate substrate (Fig. 3, see Fig. S2, ESI‡, for individual graphs).
Fig. 3.
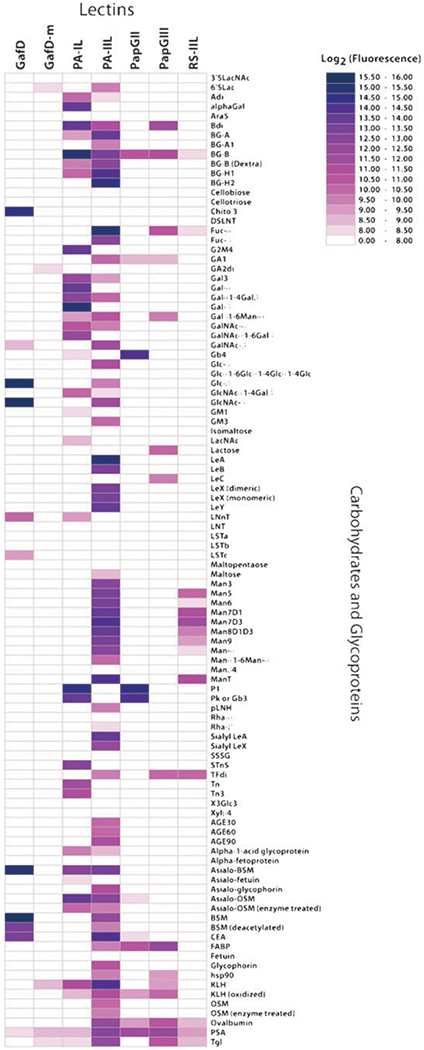
Heat map representation of lectin binding data. Lectin binding was detected by incubation with mouse anti-His5 antibody followed by Cy3-labeled goat anti-mouse antibody. Background corrected median fluorescence intensities for each component were generated using Genepix Pro 6.0 software. To correct for weak binding of the secondary reagent to CEA, 2000 was subtracted from the raw fluorescence intensities for all CEA spots. All median intensities lower than 256 were set to 256. All values were log (base 2) transformed and depicted on a heat map using colored boxes. Dark blue boxes represent the largest signals. Positive and negative controls were run but are not included on the heat map for simplicity. Lectin data is for the following concentrations: GafD = 2 μg mL−1, GafD-m = 2 μg mL−1, PA-IL = 2 μg mL−1, PA-IIL = 6 μg mL−1, PapGII = 10 μg mL−1, PapGIII = 65 μg mL−1, and RS-IIL = 45 μg mL−1. Abbreviations can be found in the ESI, Table S2.‡
In general, the specificities observed agree with those suggested in the literature, validating our strategy as a method to rapidly produce active recombinant lectins. For GafD, the expected activity against terminal β-GlcNAc epitopes based on earlier agglutination assays was observed.26 In general, this lectin appears to be highly specific for terminal β-GlcNAc. The only surprise in this data set was strong activity for β-glucose, which had not been previously seen. However, at a concentration of 260 ng mL−1 of lectin, the background corrected fluorescence intensity for β-glucose was 4200 (arbitrary fluorescence units, AU) while the intensity for β-GlcNAc was 41 000 AU. In contrast, a point mutant of GafD in which aspartate 88, a critical residue for GlcNAc binding, is mutated to leucine (GafD-m) shows no appreciable activity on the carbohydrate array at the same protein concentration (Fig. 3). This point mutation which is predicted to reduce binding by 80%, shows ~100 fold lower activity than GafD, providing the first matched negative control for a lectin.26,49 This adds an important level of quality control to our lectin microarrays.
Based on glycoprotein binding analysis, inhibition data37 and glycan array analysis from the public database of the Consortium for Functional Glycomics (CFG, www.functional-glycomics.org), the lectin PA-IL from Pseudomonas aeruginosa is known to bind α-galactose. This is confirmed by our microarray. Although strong binding is observed to the monosaccharide β-galactose, disaccharides and more complex structures containing β-galactose are not bound by PA-IL. Interestingly, the proposed binding of PA-IL to Pk (Gb3) and P1 antigen versus the GalNAc capped P-antigen (Gb4), suggested by cell binding studies, is also confirmed in our analysis.45 In the same study, PA-IIL, also from P. aeruginosa is proposed to bind fucosylated A, B and H antigens present on glycolipids and other glycoconjugates. The ability of PA-IIL to bind fucose has been suggested by microtiter assays using clinical extracts,36 isothermal calorimetry and inhibition experiments with simpler sugars,27,35 and glycan array analysis.50 In addition, PA-IIL is known to bind mannose although the preferred ligand is believed to be fucose.27,35 Our microarray data shows strong binding to the fucosylated blood groups and to simple fucosylated epitopes. Moderate binding is also observed for both simple and more complex α-mannose epitopes, again confirming previous results obtained by other groups.
The binding profiles of the PapG lectins confirm their high specificity for the globoside glycolipids.25,34,51,52 PapGII was strongly active against all the P-histo blood antigens found on globosides (Gb3, Gb4, P1) present on the array, with some activity against the blood group B antigen, a previously unidentified ligand. PapGIII on the other hand, showed no activity for the globoside antigens present on the array but was somewhat active against galactose-containing ligands (BG-B, Bdi, LeC, TFdi). PapGIII has been proposed to bind a unique globoside, Gb5 (Forssman antigen), which is not present on the current carbohydrate array.53 As expected, high amounts of PapGIII (65 μg mL−1) were needed to generate the specificity profile shown, mostly likely due to the absence of the appropriate substrate.
The RS-IIL lectin from Ralstonia solanacearum is thought to be a mannose/fucose binder with a preference for mannose.54 Analysis of RS-IIL on the CFG glycan plate array at a concentration of 30 μg mL−1, showed binding to mannose structures. At higher concentrations (200 μg mL−1) on the printed CFG array, the lectin showed strong binding for mannose and moderate signals for fucose structures. On our array, this lectin shows a preference for high mannose glycans. Recognition of fucose epitopes was not observed at the highest concentration tested (45 μg mL−1) however it is possible that fucose would be observed if higher concentrations were used. The preference for mannose epitopes is in contrast to PA-IIL, which prefers fucose over mannose structures.
Lectin specificity towards gangliosides
Several reports have suggested that P. aeruginosa binds to gangliosides via pili or flagella components but the majority of these studies used whole bacteria or pili.55–58 Gangliosides are a family of more than 100 different glycolipids characterized by the presence of one or more sialic acids.59 Structurally, gangliosides contain a lactose-ceramide core that can be extended by the sequential addition of GalNAc, galactose, and sialic acid residues (Fig. 4a). To test the binding of our recombinant lectins against gangliosides, we used a direct binding microtiter assay. Our results show that both P. aeruginosa lectins as well as RS-IIL are active against a total ganglioside extract from porcine brain (Fig. 4b). These are the first results demonstrating direct interaction between these lectins and gangliosides. Interestingly of these three lectin interactions, the only one that could be inhibited by the appropriate sugar monosaccharide was PA-IIL, which was more strongly inhibited by fucose (IC50 ≈ 1 μM, Fig. S3, ESI‡) than by mannose (IC50 ≈ 70 μM). Both PA-IL and RS-IIL were somewhat inhibited by EDTA chelation, however, indicating that these interactions may be specific, as both lectins are known to require calcium for activity (Fig. S4, ESI‡). The nature of the epitope recognized by these two lectins is unclear and deserves further study. The carbohydrate-based binding of PA-IIL coincides with the recent discovery of novel fucosyl-ganglioside structures in porcine brain (Fig. 4a).60 Given that recent studies have also shown fucosyl-gangliosides in human cells, our results may explain the observed P. aeruginosa binding to human gangliosides.55,61
Fig. 4.
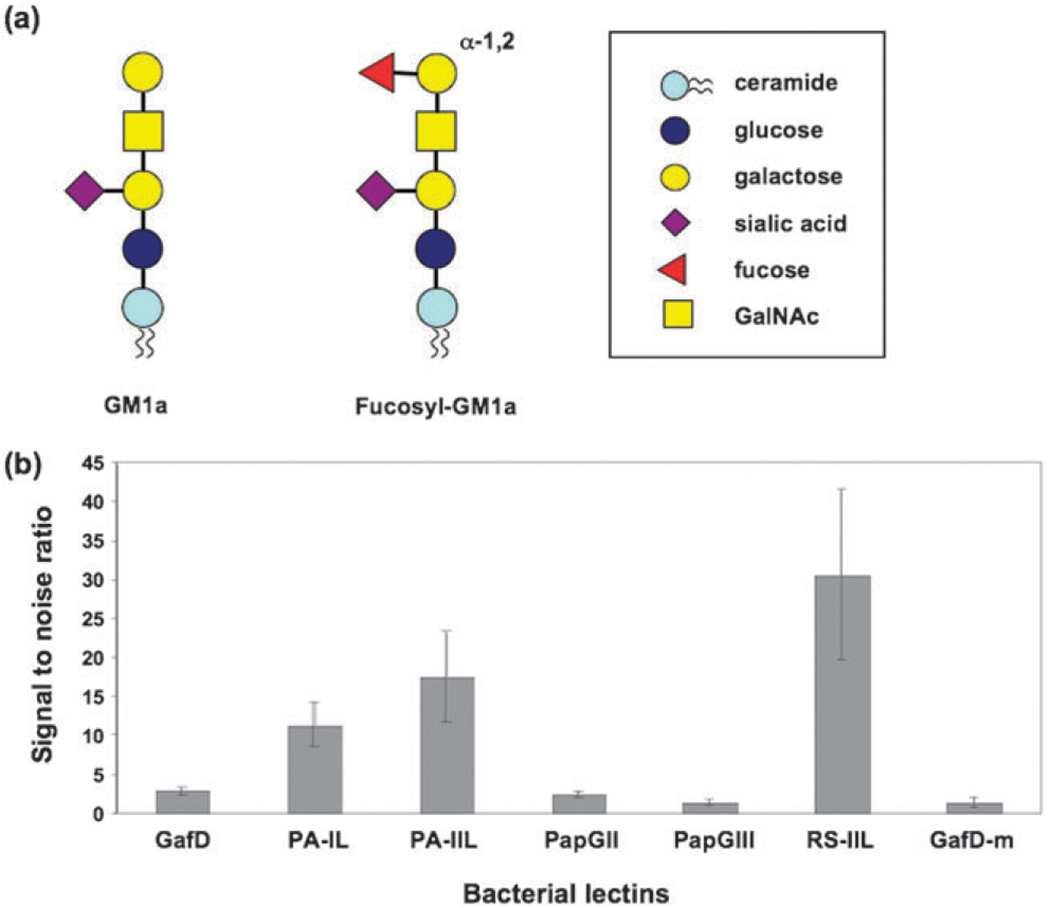
Ganglioside ELISA. (a) Structure of a common ganglioside glycolipid (GM1a) and the recently discovered fucosylated ganglioside (fucosyl-GM1a60). (b) Bar graph representing the activity of lectins PA-IL, PA-IIL, and RS-IIL against a total ganglioside extract (0.5 μg per well). Data shown is the activity of 0.5 μg of lectins.
Recombinant lectin microarray
We applied our bacterial lectin panel to the creation of a completely recombinant lectin microarray. In previous work, we have utilized lectin microarrays containing native plant lectins to study glycoproteins and cellular glycosylation patterns.13,14 For our arrays, modified glass slides were printed with 16 isolated sub-arrays and a minimum of 5 spots per lectin using a SpotBot Arrayer. We found that, similar to our previous observations with plant lectins, the presence of monosaccharides in the print buffer greatly improved both our spot morphology and lectin activity (Fig. S5, ESI‡).12 To verify the activity of the recombinant panel, glycoproteins were labeled with Cy5 and hybridized to subarrays on each slide (Fig. 5a). As expected, porcine mucin, which is known to contain high levels of fucosylated epitopes as well as α-galactose, shows strong signals with PA-IL and PA-IIL (Fig. 5b).62 These signals were inhibited by the appropriate monosaccharides (Fig. S6, ESI‡). Surprisingly, although PapGII is commonly thought to bind only glycolipids, significant signal was seen with porcine mucin. Glycoprotein binding of P-fimbriae containing PapGII has been reported in the literature.63 In addition, the PapGII signal was moderately inhibited by monosaccharides (Fig. S6, ESI‡). In contrast, the high mannose containing RNase B gives strong signals with PA-IIL and RS-IIL with a slight signal from PA-IL.64 Note that, although PA-IIL gives a strong signal with both glycoproteins, RS-IIL has only weak interactions with the highly fucosylated porcine mucin, suggesting that, although PA-IIL can effectively bind both fucose and mannose in a native context, RS-IIL displays higher selectivity for high mannose. We confirmed the mannose selectivity of RS-IIL in RNase B binding by inhibition of the signal with mannose (Fig. S7, ESI‡).
Fig. 5.
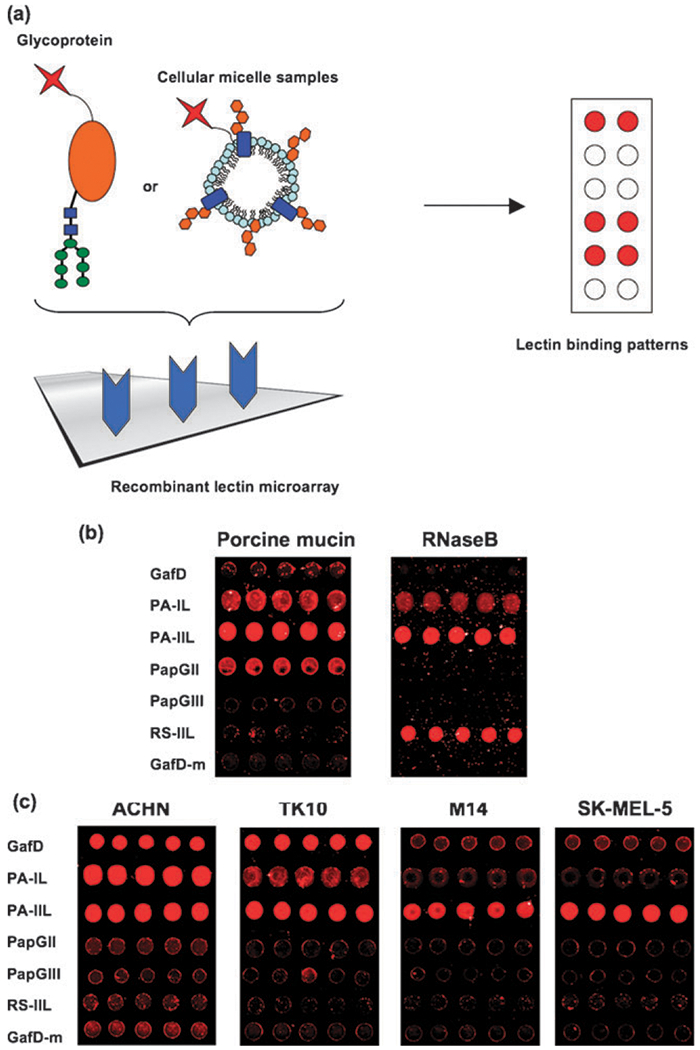
Lectin array. (a) Fluorescently labeled samples are hybridized to the array and bound by recombinant lectins via carbohydrates. (b) Distinct lectin-binding patterns of Cy5 labeled porcine mucin and RNase B. Equal amounts of glycoprotein are hybridized to the array (10 μg). (c) Lectin-binding patterns of renal carcinoma cells (ACHN, TK10) and melanoma cells (M14, SK-MEL-5). The surface glycoproteins and glycolipids are isolated as micelle-like structures and fluorescently labeled with Cy5. Equal amounts of cellular micelles (10 μg) are hybridized to the array. In all arrays, lectins are printed at 1 mg mL−1.
We also applied our arrays to the differentiation of tumor cells. Altered glycosylation of cell surface proteins and lipids in cancer is commonly observed and may serve as diagnostic biomarkers for disease progression.3 To test the ability of our simple recombinant lectin microarray to distinguish between different tumor cells, we examined the glycosylation of a small panel of renal (ACHN and TK10) and melanoma (SK-MEL-5 and M14) cancer cell lines. Previous work from our laboratory showed that isolated, fluorescently labeled micellae derived from cell membranes accurately represent cell surface glycomes while allowing us to avoid using proteases, which can alter glycoprotein composition of samples, and larger spot sizes, which would be required for whole cell analysis.14 Therefore we isolated membrane micellae from the tumor cell lines and fluorescently labeled them with Cy5.14 Equal amounts of micellae from each tumor cell line were hybridized (10 μg, based on protein analysis). Our results show distinct differences in glycosylation between the different tumor cell lines, potentially reflecting their sites of origin (Fig. 5c). Specificity of the lectins was confirmed by monosaccharide inhibition (Fig. S8, ESI‡). The renal cells showed strong signals for GafD, PA-IL, and PA-IIL, indicating high levels of terminal GlcNAc, μ-galactose and fucose epitopes, respectively. In contrast, only PA-IIL showed a strong signal for the melanoma cell lines. The GafD-m construct provided a reduced-binding control for our microarray, allowing better assessment of specific vs. non-specific binding interactions.
Experimental
Cloning
Purified genomic DNA from E. coli CFT073 (ATCC No. 700928D-5, Rockville, MD) and Ralstonia solanacearum (ATCC No. 1169D-5, Rockville, MD) were purchased from the American Type Culture Collection. Plasmid DNA encoding the GafD lectin (1-178) was a kind gift from Dr Timo Korhonen (University of Helsinki, Finland). The modified GafD was cloned from a previously described plasmid.49 Genomic DNA was isolated from neonatal meningitis E. coli RS218 (kind gift from Dr R. Silver and L. Wright, University of Rochester Medical Center) and Pseudomonas aeruginosa PAO1 (kind gift from Dr Elizabeth Sims, University of Washington Genome Center) using the DNeasy blood and tissue kit (Qiagen No. 69504, Valencia, CA). The target ORF for each lectin was amplified by PCR using primers designed with 5′ LIC extensions and the appropriate genomic or plasmid DNA as a template (Table S1, ESI‡). PCR products were cloned into the pET-41 Ek/LIC vector using the pET-41 Ek/LIC vector kit (Novagen No. 71071-3, San Diego, CA). Annealed plasmids were transformed into E. coli DH5α and colonies were selected on Luria broth (LB)/agar plates containing kanamycin (30 μg mL−1). Selected colonies were grown overnight in LB medium containing kanamycin (30 μg mL−1) and plasmid DNA was purified using a QIAprep spin miniprep kit (Qiagen No. 27104, Valencia, CA). Plasmids were then sequenced to check for mutations.
Protein expression and purification
Plasmids were transformed into electro-competent BL21 (DE3) (Novagen San Diego, CA) and colonies were selected for by growth on kanamycin (30 μg mL−1). A 25 ml culture was grown overnight in Terrific broth (TB, BD No. 243820, Sparks, MD) and used to inoculate a 1 L culture of TB. Cultures were grown to an optical density at 600 nm (OD600) of 0.7–1.0 and induced with 1% lactose (W/V) for 3 h. Cells were then centrifuged for 10 min at 5000 × g, and the pellet was re-suspended in phosphate buffered saline (PBS, 100 mM sodium phosphate, 150 mM sodium chloride, pH 7.2) containing 0.1% Triton X-100 and protease inhibitor mix. Lysozyme was added to the lysate (final concentration of 1 mg mL−1) and incubated for 30 min on ice with gentle rocking. DNase was added to the lysate (final concentration of 5 μg mL−1) and incubated on ice for 30 min with gently rocking. After centrifugation of the lysate (30 min, 30 000 × g, 4 °C) to remove insoluble material, the supernatant was purified using a BioLogic LP low-pressure gradient chromatography system (Bio-rad No. 731-8300, Hercules, CA).
In brief, the supernatant was applied to an equilibrated glutathione column (1 mL, GSTrap HP, Amersham No. 17-5281-01, Piscataway, NJ) at a flow rate of 0.5 mL min−1. The column was washed with 10 column volumes of PBS (1 mL min−1 flow rate) and lectin was eluted with PBS containing 10 mM of reduced glutathione (1 mL fractions, 1 mL min−1 flow rate). Fractions 13–16 typically contained the greatest levels of protein. One exception to this purification scheme was GafD, which was purified on GlcNAc beads as previously described.65 Lectin purification was monitored by SDS-PAGE66 and fractions containing the highest levels of protein were pooled and dialyzed overnight at 4 °C in PBS. Protein concentrations were determined using a modified Lowry assay67 (Bio-rad DC Assay No. 500-0112, Hercules, CA).
Carbohydrate arrays
The carbohydrate microarrays were prepared as previously described with the following modifications.44,47 Samples were printed on SuperEpoxy 2 Protein glass slides (TeleChem International, Inc., Sunnyvale, CA) using a Biorobotics MicroGrid II microarrayer (Genomic Solutions, Ann Arbor, MI) fitted with Stealth pins (Telechem International; #SMP3 which produce ~100 μm spots). The list of 107 components printed on the array can be found in Fig. 3 and in Table S2, ESI‡. Lectin binding was evaluated using minor modifications of the previously reported protocol.44,47 Lectins were incubated at various concentrations on the array. After washing, lectin binding was detected by first incubating the array with a mouse anti-His5 monoclonal antibody (1 μg mL−1, Qiagen, Valencia, CA) followed by incubation with Cy3-labeled AffiniPure goat anti-mouse IgG + IgM (2 μg mL−1, Jackson ImmunoResearch Laboratories, West Grove, PA). Slides were scanned using a GenePix Scanner 4000B (Molecular Devices Corporation, Union City, CA). Background corrected median fluorescence intensities for each component were obtained using Genepix Pro 6.0 software. The secondary reagent, goat anti-mouse Ig, gives a weak signal for CEA even in the absence of a primary reagent (lectin or antibody). The average signal due to the secondary reagent alone is 2000 for the experimental conditions used in this paper. Therefore, a value of 2000 was subtracted from the raw fluorescence intensities for all CEA spots to obtain the fluorescence intensity attributed to lectin binding. This correction was not applied to any other spots on the array. Fluorescence intensities ranged from 0 to 65 000. For the given assay conditions, values below 250 cannot be reliably measured. Therefore, all median intensities lower than 250 were considered below the limit of detection for the assay conditions. For convenience, a “floor value” of 256 was used instead of 250 since log2 (256) is a whole number. Thus, all median intensities lower than 256 were set to 256.
ELISA
For glycolipid analysis, 100 μl of total porcine brain ganglioside extract (10 μg mL−1 in ethanol containing 0.1% NaN3, Avanti No. 860053, Alabster, AL) was added to 96-well microtiter plates (Greiner Bio-one No. 655061, Monroe, NC). Following incubation (48 h, vacuum desiccator, RT), the plates were washed five times with PBST (PBS and 0.05% Tween 20). Wells were then blocked with PBS containing 5% BSA for 1 h at RT and again washed five times with PBST. Lectins were serially diluted in PBST++ (PBST, 1% BSA, 1 mM CaCl2, 1 mM MgCl2) and 50 μL of each lectin dilution was applied to the wells. For the inhibition experiments, monosaccharide were serially diluted in PBST++, mixed with lectin solutions and then applied to wells. For metal chelation experiments, 50 mM EDTA was added to PBST++ and allowed to chelate for 30 min prior to the dilution of the lectins. In all experiments, wells containing buffer alone were used to measure the background (noise) of the plate.
Lectins with or without monosaccharides and EDTA were added to the plate and incubated 1 h at RT. After incubation, wells were washed five times with PBST and lectin binding was detected with anti-His6-horseradish peroxidase (HRP) conjugated antibody (50 μL, 1 : 625 in PBST++, 1 h, RT, Novus Biologicals No. NB600-393, Littleton, CO). Wells were then washed 5 times with PBST and HRP activity was detected using o-phenylenediamine dihydrochloride (OPD Pierce No. 34005, Rockford, IL). In brief, OPD solution (100 μL, 0.4 mg mL−1 in 0.1 M phosphate/citrate, pH 5.0 containing 0.004% H2O2) was added to each well. After 30 min, the enzymatic reaction was stopped by the addition of 50 μL of 2.5 M H2SO4. The absorbance at 492 nm was read using a Synergy HT microplate reader (BIO-TEK, Winooski, VT). A reference wavelength of 620 nm was subtracted from these values to account for non-specific absorbance.
For data analysis, the lectin binding activity was defined as the signal to noise (S/N): absorbance of samples divided by the average background absorbance values. To determine inhibition of monosaccharides and chelator, percent of control (% control) was calculated: (the absorbance of the sample in the presence of inhibitor/absorbance of uninhibited sample) × 100. All experiments were done in triplicate and error was propagated from the standard deviations using standard propagation of error methods. Microsoft Excel and Graphpad Prism 4.0 software were used for statistical analysis, curve fitting, and to generate graphs and tables.
Fluorescent protein and cell membrane sample preparations
ACHN, TK10, M14, and SK-MEL-5 cell lines were purchased from the National Cancer Institute (DCTD Repository, Frederick, MD). Porcine mucin was purchased from Sigma (No. M2378, St. Louis, MO) and RNase B from New England Biolabs (NEB No. P7817S, Ipswich, MA). Tumor cell lines were maintained in RPMI 1640 (Cellgro) containing 10% fetal bovine serum and 1% l-glutamine at 37 °C in 5% CO2. Glycoproteins and cellular micellae were prepared and fluorescently labeled as previously described.13,14 Briefly, 10 μg of Cy5-NHS ester (GE Life Sciences, Piscataway, NJ) was added to 1 mg of cellular micellae (determined by protein content) or glycoprotein diluted in PBS for 30 min at RT. The labeled samples were then dialyzed against PBS overnight at 4 °C, snap frozen in liquid N2, and stored at −80 °C for future use.
Lectin microarrays
Lectin microarrays were printed as previously described with the following modifications.11 Briefly, recombinant lectins were diluted to 1 mg mL−1 in print buffer (PBS, 500 μg mL−1 BSA) containing monosaccharides as follows: GafD and GafD-m (1 mM N-acetyl glucosamine); PA-IL, PapGII, and PapGIII (1 mM galactose); PA-IIL (1 mM fucose); RS-IIL (1 mM mannose). Note: to check relative glycosylation levels of the bacterial vs. plant lectins (Fig. 2), the recombinant lectins were printed at 0.5 mg mL−1 for consistency with the plant proteins. The lectin solutions were printed onto Nexterion H slides (SCHOTT North America) using a SpotBot personal microarrayer with SMP3 pins (TeleChem International Inc.) in 50–60% humidity and 8 °C. A minimum of 5 spots per lectin were printed in each of the 16 sub-arrays per slide. The average diameter for each spot was ~110 μm. After printing, slides were allowed to incubate at RT for 1 h to insure maximum coupling to the activated surface. The slides were then incubated in blocking buffer (50 mM ethanolamine in 50 mM sodium borate, pH 8.0) for 1 h at RT to deactivate unspotted areas on the slide and prevent non-specific attachment. After the blocking step, slides were washed 3 times with PBST (PBS and 0.005% Tween 20), once with PBS, and then dried using a slide spinner (Labnet International). A 16-pad FAST frame hybridization chamber (Schleicher and Schuell) was used to create distinct sub-arrays for hybridization. For inhibition assays, each sub-array is pre-incubated with 50 μL of carbohydrate in PBST+ (PBS, 0.005% Tween 20, 1 mM CaCl2, 1 mM MgCl2) for 30 min at RT with gentle shaking. Fluorescently-labeled glycoproteins or cellular micellae were added to sub-arrays (10 μg, 100 μL total volume in PBST+) and incubated for 2 h at RT with gentle agitation. After incubation, sample solutions were aspirated and 100 μL of PBST was added to each sub-array and incubated for 3 min at RT with gentle agitation. This wash step was repeated five times. The hybridization chamber was then removed and the slides were immersed in PBS for 5 min with gentle shaking. The slides were then dried using a slide spinner and scanned using a Genepix 4100A slide scanner (Molecular Devices).
For lectin glycosylation assays, ConA-biotin (3.1 μg, 100 μL total volume in PBS, EY laboratories Inc., No. BA-1104-5, San Mateo, CA) was added to sub-arrays and incubated for 1 h at RT with gentle agitation. Samples were then aspirated and 100 μL of PBST was added to each sub-array and incubated for 3 min at RT with gentle agitation. This wash step was repeated five times. Cy3-streptavidin (0.25 μg, 100 μL total volume in PBS, Amersham Biosciences No. PA43001, Piscataway, NJ) was added to sub-arrays and incubated for 1 h at RT with gentle agitation. After incubation, sample solutions were aspirated and 100 μL of PBST was added to each sub-array and incubated for 3 min at RT with gentle agitation. This wash step was repeated five times. The hybridization chamber was then removed and the slides were immersed in PBS for 5 min with gentle shaking. The slides were then dried using a slide spinner and scanned using a Genepix 4100A slide scanner (Molecular Devices).
Genepix Pro 5.1 software (Molecular Devices) was used for extraction of data. Microsoft Excel and Graphpad Prism 4.0 software were used for statistical analysis and to generate graphs and tables. Error was propagated from the standard deviations using standard propagation of error methods.
Conclusions
Herein, we present a simple and efficient strategy for the systematic creation of well-defined recombinant lectins for use in lectin microarrays and other analytical formats. These recombinant lectins address the limitations imposed by naturally purified plant lectins, which include inconsistencies in activity and availability, as well as post-translational glycosylation, which can complicate analysis. Our initial panel consisted of a structurally diverse set of bacterial lectins. Using a combination of carbohydrate microarray profiling, ELISA, and lectin array assays, we show that the standardized set of conditions used for expression, purification, and carbohydrate binding are acceptable for all the lectins. Our work led us to explore the ganglioside binding activity of our recombinant lectins, leading to the surprising result that PA-IIL binds gangliosides, most likely through a fucosylated epitope. This result is especially timely given the recent discovery of fucosylated gangliosides in human tissues.61 In addition, we show that the inclusion of an N-terminal GST–His6 fusion does not compromise lectin activity or specificity. The establishment of a system for creating homogenous lectins is a key step towards the production of a uniform recombinant lectin library.61
When incorporated into a microarray format, our simple lectin panel was able to distinguish between both glycoprotein samples and cell lines, lending credence to the idea that a broader lectin panel may be useful for both diagnostics and carbohydrate analysis. Indeed, work from our laboratory using a larger plant-derived lectin microarray has shown the utility of this approach in studying glycosylation in a variety of systems including cell differentiation.14 It should be noted that this technology allows rapid assessment of glycosylation using minimal sample amounts (<1 μg).13,68 Our strategy to create a uniform recombinant lectin library provides ample opportunities for expansion of our lectin microarray via protein engineering to create lectins with new specificities. This includes more appropriate controls to distinguish carbohydrate binding from non-specific interactions, such as the GafD mutant. In addition, this work sets the stage for directed evolution of large sets of recombinant lectins via high-throughput selection screens. In conclusion, by standardizing the conditions for cloning, expression and purification of bacterial lectins, we have paved the way for the creation of a large well-defined lectin library to facilitate complex carbohydrate analysis, an important hurdle to understanding the role of glycans in biology.
Supplementary Material
Acknowledgements
The authors thank R. Silver and L. Wright, University of Rochester Medical Center, for RS218, Elizabeth Sims, University of Washington Genome Center, for Pseudomonas aeruginosa PAO1, Timo Korhonen (University of Helsinki, Finland) for GafD plasmid, and Jonathan L. Sessler, Department of Chemistry and Biochemistry, University of Texas at Austin for his advice and aid. We would also like to acknowledge Natalie C. Ramirez, Abdallah Jeroudi, Anderson Lee, and Sissir Mallela for their work in protein expression and Dr Oyinda Oyelaran for help printing the carbohydrate microarray and with the paper. This research was supported by the Arnold and Mabel Beckman Foundation (L. K. M.), the National Science Foundation (L.K.M.,CAREER,CHE-0644530) and Intramural Research Program of the NIH, NCI (J. C. G.). In addition, K.-L. H. was supported by a University Continuing Fellowship (U. T. Austin).
Footnotes
This article is part of a Molecular BioSystems ‘Emerging Investigators’ issue highlighting the work of outstanding young scientists at the chemical- and systems-biology interfaces.
Electronic supplementary information (ESI) available: Supplemental tables and figures.
References
- 1.Rudd PM, Elliott T, Cresswell P, Wilson IA and Dwek RA, Science, 2001, 291, 2370–2376. [DOI] [PubMed] [Google Scholar]
- 2.Karlsson KA, Mol. Microbiol, 1998, 29, 1–11. [DOI] [PubMed] [Google Scholar]
- 3.Dube DH and Bertozzi CR, Nat. Rev. Drug Discovery, 2005, 4, 477–488. [DOI] [PubMed] [Google Scholar]
- 4.Essentials of Glycobiology, ed. Varki A, Cummings R, Esko JD, Freeze H, Hart GW and Marth J, Cold Spring Harbor Laboratory Press, Cold Spring Harbor, NY, 1999. [PubMed] [Google Scholar]
- 5.Gabius HJ, Siebert HC, Andre S, Jimenez-Barbero J and Rudiger H, ChemBioChem, 2004, 5, 740–764. [DOI] [PubMed] [Google Scholar]
- 6.Coutinho PM, Deleury E, Davies GJ and Henrissat B, J. Mol. Biol, 2003, 328, 307–317. [DOI] [PubMed] [Google Scholar]
- 7.Buttke TM and Ingram LO, J. Bacteriol, 1975, 124, 1566–1573. [DOI] [PMC free article] [PubMed] [Google Scholar]
- 8.Zaia J, Mass Spectrom. Rev, 2004, 23, 161–227. [DOI] [PubMed] [Google Scholar]
- 9.Szymanski CM, Michael FS, Jarrell HC, Li J, Gilbert M, Larocque S, Vinogradov E and Brisson JR, J. Biol. Chem, 2003, 278, 24509–24520. [DOI] [PubMed] [Google Scholar]
- 10.Sletmoen M, Maurstad G, Sikorski P, Paulsen BS and Stokke BT, Carbohydr. Res, 2003, 338, 2459–2475. [DOI] [PubMed] [Google Scholar]
- 11.Hsu KL and Mahal LK, Nat. Protoc, 2006, 1, 543–549. [DOI] [PubMed] [Google Scholar]
- 12.Hsu KL, Pilobello KT and Mahal LK, Nat. Chem. Biol, 2006, 2, 153–157. [DOI] [PubMed] [Google Scholar]
- 13.Pilobello KT, Krishnamoorthy L, Slawek D and Mahal LK, ChemBioChem, 2005, 6, 985–989. [DOI] [PubMed] [Google Scholar]
- 14.Pilobello KT, Slawek DE and Mahal LK, Proc. Natl. Acad. Sci. U. S. A, 2007, 104, 11534–11539. [DOI] [PMC free article] [PubMed] [Google Scholar]
- 15.Lis H and Sharon N, Chem. Rev, 1998, 98, 637–674. [DOI] [PubMed] [Google Scholar]
- 16.Loris R, Hamelryck T, Bouckaert J and Wyns L, Biochim. Biophys. Acta, 1998, 1383, 9–36. [DOI] [PubMed] [Google Scholar]
- 17.Adar R, Streicher H, Rozenblatt S and Sharon N, Eur. J. Biochem, 1997, 249, 684–689. [DOI] [PubMed] [Google Scholar]
- 18.Dincturk HB, Dunn AJ and Jones DH, J. Biosci, 2001, 26, 635–640. [DOI] [PubMed] [Google Scholar]
- 19.Sharma V and Surolia A, Gene, 1994, 148, 299–304. [DOI] [PubMed] [Google Scholar]
- 20.Nakamura S, Ikegami A, Matsumura Y, Nakanishi T and Nomura K, J. Biochem. (Tokyo), 2002, 131, 241–246. [DOI] [PubMed] [Google Scholar]
- 21.Stancombe PR, Alexander FC, Ling R, Matheson MA, Shone CC and Chaddock JA, Protein Expression Purif., 2003, 30, 283–292. [DOI] [PubMed] [Google Scholar]
- 22.Sharon N, FEBS Lett., 1987, 217, 145–157. [DOI] [PubMed] [Google Scholar]
- 23.Sharon N, Biochim. Biophys. Acta, 2006, 1760, 527–537. [DOI] [PubMed] [Google Scholar]
- 24.Choudhury D, Thompson A, Stojanoff V, Langermann S, Pinkner J, Hultgren SJ and Knight SD, Science, 1999, 285, 1061–1066. [DOI] [PubMed] [Google Scholar]
- 25.Dodson KW, Pinkner JS, Rose T, Magnusson G, Hultgren SJ and Waksman G, Cell, 2001, 105, 733–743. [DOI] [PubMed] [Google Scholar]
- 26.Merckel MC, Tanskanen J, Edelman S, Westerlund-Wikstrom B, Korhonen TK and Goldman A, J. Mol. Biol, 2003, 331, 897–905. [DOI] [PubMed] [Google Scholar]
- 27.Mitchell E, Houles C, Sudakevitz D, Wimmerova M, Gautier C, Perez S, Wu AM, Gilboa-Garber N and Imberty A, Nat. Struct. Biol, 2002, 9, 918–921. [DOI] [PubMed] [Google Scholar]
- 28.Cioci G, Mitchell EP, Gautier C, Wimmerova M, Sudakevitz D, Perez S, Gilboa-Garber N and Imberty A, FEBS Lett., 2003, 555, 297–301. [DOI] [PubMed] [Google Scholar]
- 29.Loris R, Tielker D, Jaeger KE and Wyns L, J. Mol. Biol, 2003, 331, 861–870. [DOI] [PubMed] [Google Scholar]
- 30.Lesman-Movshovich E and Gilboa-Garber N, J. Dairy Sci, 2003, 86, 2276–2282. [DOI] [PubMed] [Google Scholar]
- 31.Schembri MA, Hasman H and Klemm P, FEMS Microbiol. Lett, 2000, 188, 147–151. [DOI] [PubMed] [Google Scholar]
- 32.Thankavel K, Madison B, Ikeda T, Malaviya R, Shah AH, Arumugam PM and Abraham SN, J. Clin. Invest, 1997, 100, 1123–1136. [DOI] [PMC free article] [PubMed] [Google Scholar]
- 33.Haslam DB, Boren T, Falk P, Ilver D, Chou A, Xu Z and Normark S, Mol. Microbiol, 1994, 14, 399–409. [DOI] [PubMed] [Google Scholar]
- 34.Saarela S, Taira S, Nurmiaho-Lassila EL, Makkonen A and Rhen M, J. Bacteriol, 1995, 177, 1477–1484. [DOI] [PMC free article] [PubMed] [Google Scholar]
- 35.Adam J, Pokorna M, Sabin C, Mitchell EP, Imberty A and Wimmerova M, BMC Struct. Biol, 2007, 7, 36. [DOI] [PMC free article] [PubMed] [Google Scholar]
- 36.Wu AM, Wu JH, Singh T, Liu JH, Tsai MS and Gilboa-Garber N, Biochimie, 2006, 88, 1479–1492. [DOI] [PubMed] [Google Scholar]
- 37.Chen CP, Song SC, Gilboa-Garber N, Chang KS and Wu AM, Glycobiology, 1998, 8, 7–16. [DOI] [PubMed] [Google Scholar]
- 38.Zhu H, Bilgin M, Bangham R, Hall D, Casamayor A, Bertone P, Lan N, Jansen R, Bidlingmaier S, Houfek T, Mitchell T, Miller P, Dean RA, Gerstein M and Snyder M, Science, 2001, 293, 2101–2105. [DOI] [PubMed] [Google Scholar]
- 39.Peluso P, Wilson DS, Do D, Tran H, Venkatasubbaiah M, Quincy D, Heidecker B, Poindexter K, Tolani N, Phelan M, Witte K, Jung LS, Wagner P and Nock S, Anal. Biochem, 2003, 312, 113–124. [DOI] [PubMed] [Google Scholar]
- 40.Cha T, Guo A and Zhu XY, Proteomics, 2005, 5, 416–419. [DOI] [PubMed] [Google Scholar]
- 41.Thankavel K, Shah AH, Cohen MS, Ikeda T, Lorenz RG, Curtiss R 3rd and Abraham SN, J. Biol. Chem, 1999, 274, 5797–5809. [DOI] [PubMed] [Google Scholar]
- 42.Van Damme EJM, Peumans W, Pusztai A and Bardocz S, Handbook of Plant Lectins:Properties and Biomedical Applications, John Wiley and Sons, New York, 1998. [Google Scholar]
- 43.Rudiger H and Gabius HJ, Glycoconjugate J., 2001,18, 589–613. [DOI] [PubMed] [Google Scholar]
- 44.Manimala JC, Roach TA, Li Z and Gildersleeve JC, Angew. Chem., Int. Ed, 2006, 45, 3607–3610. [DOI] [PubMed] [Google Scholar]
- 45.Gilboa-Garber N, Sudakevitz D, Sheffi M, Sela R and Levene C, Glycoconjugate J., 1994, 11, 414–417. [DOI] [PubMed] [Google Scholar]
- 46.Ohlsson J, Jass J, Uhlin BE, Kihlberg J and Nilsson UJ, ChemBioChem, 2002, 3, 772–779. [DOI] [PubMed] [Google Scholar]
- 47.Manimala JC, Li Z, Jain A, VedBrat S and Gildersleeve JC, ChemBioChem, 2005, 6, 2229–2241. [DOI] [PubMed] [Google Scholar]
- 48.Bobrow MN, Harris TD, Shaughnessy KJ and Litt GJ, J. Immunol. Methods, 1989, 125, 279–285. [DOI] [PubMed] [Google Scholar]
- 49.Carrillo LD, Krishnamoorthy L and Mahal LK, J. Am. Chem. Soc, 2006, 128, 14768–14769. [DOI] [PubMed] [Google Scholar]
- 50.Marotte K, Sabin C, Preville C, Moume-Pymbock M, Wimmerova M, Mitchell EP, Imberty A and Roy R, ChemMedChem, 2007, 2, 1328–1338. [DOI] [PubMed] [Google Scholar]
- 51.Stromberg N, Nyholm PG, Pascher I and Normark S, Proc. Natl. Acad. Sci. U. S. A, 1991, 88, 9340–9344. [DOI] [PMC free article] [PubMed] [Google Scholar]
- 52.Nilsson U, Striker RT, Hultgren SJ and Magnusson G, Bioorg. Med. Chem, 1996, 4, 1809–1817. [DOI] [PubMed] [Google Scholar]
- 53.Soderhall M, Bergerheim US, Jacobson SH, Lundahl J, Mollby R, Normark S and Winberg J, J. Urol, 1997, 157, 346–350. [PubMed] [Google Scholar]
- 54.Sudakevitz D, Kostlanova N, Blatman-Jan G, Mitchell EP, Lerrer B, Wimmerova M, Katcoff DJ, Imberty A and Gilboa-Garber N, Mol. Microbiol, 2004, 52, 691–700. [DOI] [PubMed] [Google Scholar]
- 55.Imundo L, Barasch J, Prince A and Al-Awqati Q, Proc. Natl. Acad. Sci. U. S. A, 1995, 92, 3019–3023. [DOI] [PMC free article] [PubMed] [Google Scholar]
- 56.Sheth HB, Lee KK, Wong WY, Srivastava G, Hindsgaul O, Hodges RS, Paranchych W and Irvin RT, Mol. Microbiol, 1994, 11, 715–723. [DOI] [PubMed] [Google Scholar]
- 57.Gupta SK, Berk RS, Masinick S and Hazlett LD, Infect. Immun, 1994, 62, 4572–4579. [DOI] [PMC free article] [PubMed] [Google Scholar]
- 58.Krivan HC, Ginsburg V and Roberts DD, Arch. Biochem. Biophys, 1988, 260, 493–496. [DOI] [PubMed] [Google Scholar]
- 59.Lauc G and Heffer-Lauc M, Biochim. Biophys. Acta, 2006, 1760, 584–602. [DOI] [PubMed] [Google Scholar]
- 60.Xu X, Monjusho H, Inagaki M, Hama Y, Yamaguchi K, Sakaguchi K, Iwamori M, Okino N and Ito M, J. Biochem. (Tokyo), 2007, 141, 1–7. [DOI] [PubMed] [Google Scholar]
- 61.Korekane H, Tsuji S, Noura S, Ohue M, Sasaki Y, Imaoka S and Miyamoto Y, Anal. Biochem, 2007, 364, 37–50. [DOI] [PubMed] [Google Scholar]
- 62.Karlsson NG and Packer NH, Anal. Biochem, 2002, 305, 173–185. [DOI] [PubMed] [Google Scholar]
- 63.Leeker A, Kreft B, Sandmann J, Bates J, Wasenauer G, Muller H, Sack K and Kumar S, Exp. Nephrol, 1997, 5, 38–46. [PubMed] [Google Scholar]
- 64.Liang CJ, Yamashita K and Kobata A, J. Biochem, 1980, 88, 51–58. [PubMed] [Google Scholar]
- 65.Tanskanen J, Saarela S, Tankka S, Kalkkinen N, Rhen M, Korhonen TK and Westerlund-Wikstrom B, J. Bacteriol, 2001, 183, 512–519. [DOI] [PMC free article] [PubMed] [Google Scholar]
- 66.Laemmli UK, Nature, 1970, 227, 680–685. [DOI] [PubMed] [Google Scholar]
- 67.Lowry OH, Rosebrough NJ, Farr AL and Randall RJ, J. Biol. Chem, 1951, 193, 265–275. [PubMed] [Google Scholar]
- 68.Kuno A, Uchiyama N, Koseki-Kuno S, Ebe Y, Takashima S, Yamada M and Hirabayashi J, Nat. Methods, 2005, 2, 851–856. [DOI] [PubMed] [Google Scholar]
- 69.Avichezer D, Katcoff DJ, Garber NC and Gilboa-Garber N, J. Biol. Chem, 1992, 267, 23023–23027. [PubMed] [Google Scholar]
- 70.Mitchell EP, Sabin C, Snajdrova L, Pokorna M, Perret S, Gautier C, Hofr C, Gilboa-Garber N, Koca J, Wimmerova M and Imberty A, Proteins, 2005, 58, 735–746. [DOI] [PubMed] [Google Scholar]
Associated Data
This section collects any data citations, data availability statements, or supplementary materials included in this article.