Abstract
Prostate cancer, one of the most common forms of cancer among men, can benefit from recent improvements in positron emission tomography (PET) technology. In particular, better spatial resolution, lower noise and higher detectability of small lesions could be greatly beneficial for early diagnosis and could provide a strong support for guiding biopsy and surgery. In this article, the impact of improved PET instrumentation with superior spatial resolution and high sensitivity are discussed, together with the latest development in PET technology: resolution recovery and time-off-light reconstruction. Using simulated cancer lesions, inserted in clinical PET images obtained with conventional protocols, we show that visual identification of the lesions and detectability via numerical observers can already be improved using state of the art PET reconstruction methods. This was achieved using both resolution recovery and time-of-flight reconstruction, and a high resolution image with 2 mm pixel size. Channelized Hotelling numerical observers showed an increase in the area under the LROC curve from 0.52 to 0.58. In addition, a relationship between the simulated input activity and the area under the LROC curve showed that the minimum detectable activity was reduced by more than 23%.
Keywords: prostate cancer, PET, TOF PET, spatial resolution
1. Introduction
Prostate cancer (PCa) is the most common form of cancer among men in Europe and the United States (Jadvar 2011, Lutje et al 2012). Early diagnosis, correct staging, accurate detection of local recurrence and metastasis and therapy monitoring are key tasks that could greatly benefit from medical imaging. Imaging techniques for PCa include ultrasound (US), computerized tomography (CT), planar bone scintigraphy, single photon emission computed tomography (SPECT), positron emission tomography (PET) and magnetic resonance imaging (MRI). There is a growing interest in developing better nuclear medicine imaging techniques for PCa, particularly in PET (Kotzerke et al 2002, Apolo et al 2008, Farsad et al 2008, Zaheer et al 2009, Fox et al 2012, Jadvar 2012, Lutje et al 2012).
PET (and PET/CT) has been used as a method for prostate tumor localization. The standard oncology PET tracer, 18F-FDG, has been disappointing for early detection and localization of primary PCa because of high bladder activity, relatively low tumor uptake, and low specificity (Jadvar 2011, 2012, Kotzerke et al 2002, Lutje et al 2012). PET tracers that exhibit higher sensitivity and slightly higher specificity have been used, such as 11C-labeled and 18F-labeled choline and acetate. Choline is a component of the biologic membrane. Malignant tumors show high proliferation and increased metabolism of cell membrane components and an increased uptake of choline (Degrado et al 2001, Hara et al 2002, Picchio et al 2006, Reske et al 2006). Also, PCa is associated with an increase in fatty acid synthesis. Therefore, a high concentration of 11C-acetate has been seen in PCa (Oyama et al 2003, Schiepers et al 2008). An interesting new tracer that follows the amino acid transport mechanism is 18F-FACBC (Schuster et al 2007). Furthermore, a new generation of PCa specific tracers are being developed and tested; for example, the prostate-specific membrane antigen (PSMA). PSMA ligands are 68Ga-PSMA (Afshar-Oromieh et al 2013) and 18F-DCFBC (Mease et al 2008), and others.
In addition to the lack of a proven and specific PET imaging probe for PCa, the poor resolution of PET cameras has been observed as a limitation (De Jong et al 2003, Bouchelouche et al 2011, Fox et al 2012). The need for an improvement in PET imaging technology for PCa is particularly strong in view of the progresses in the development and performance of PSMA PCa specific tracers (Afshar-Oromieh et al 2014). Improved spatial resolution and lesion detectability could be beneficial for guiding the biopsy and reducing over (and under) staging and treatment; guiding prostatectomy, reducing positive margins and sparing healthy tissue; reducing the need of surgical removal of pelvic lymph nodes.
From the point of view of PET imaging, two recent innovations have the potential of providing improved performance for this application: resolution recovery (or point spread function) reconstruction and time-of-flight reconstruction. Point spread function reconstruction (PSF) is characterized by significant noise reduction and contrast enhancement (Panin et al 2006). Time-of-flight reconstruction (TOF) allows for faster convergence and reduced noise propagation, it is less sensitive to imprecise attenuation and scatter correction, and it works as a virtual sensitivity amplifier (Conti 2009, 2011). The combination of these techniques has had a significant impact on image quality (Karp et al 2008, Kadrmas et al 2009b, Lois et al 2010, Schaefferkoetter et al 2013). In particular, the noise reduction and virtual count amplification offered by the PSF+TOF reconstruction, and the actual increase of sensitivity offered by LSO scintillator and larger field of view (FOV) coverage could allow for a smaller pixel size in the reconstructed image, and eliminate or reduce the need for image smoothing.
The impact of new PET technologies has not been fully assessed in PCa imaging. We believe it is possible to improve detectability and localization of small primary tumors in the prostate and local lymph node metastasis, optimizing basic reconstruction parameters for PCa application such as reconstruction method, image voxel size, iterations, subsets, smoothing filter.
This could be greatly beneficial for early diagnosis and could provide a strong support for guiding biopsy and surgery. This work, a simulation based on clinical PET images obtained with 11C-choline and 11C-acetate, is aimed to assess the improvement in PCa small lesion detectability, both in the prostate and in the local lymph nodes, using the present generation of PET scanners at its full potentiality.
2. Methods
In this work, we used experimental data from clinical sites, acquired in the past with different PET scanners, as a starting point for realistic simulations, in order to assess the improvement opportunities of the new technologies. A set of clinical PET images of patients with PCa, acquired using 11C-choline and 11C-acetate, were selected as a starting point for a simulation. Small lesions were added via software in selected locations, with variable size and intensity. Then the 3D images were forward projected into a sinogram space, assuming a TOF capability, using the sinogram representation and the time resolution of a Siemens mCT TOF PET scanner (Jakoby et al 2011). In the process, detector sensitivity, attenuation, scatter, randoms and Poisson noise were added. The data were reconstructed with different reconstruction methods.
2.1. Patient population
The patient images were provided by two clinical sites, using different PET scanners and different tracers: one group of 4 patients data sets (120 s/bed, average age 71 years, average weight = 76 kg, average BMI = 26) came from S Orsola Malpighi Hospital (Bologna, Italy), acquired on a BGO-based PET/CT with 11C-choline as a tracer; the other group of 4 patient data sets (180 s/bed, average age = 59, average weight = 84 kg, average BMI = 27) came from National Institute of Health (Bethesda, MD, USA), acquired on a LYSO-based PET/CT with 11C-acetate as a tracer. All patients were imaged before prostatectomy, and were diagnosed with PCa localized in the prostate.
Images were reconstructed at S Orsola Hospital with OSEM, 2 iterations and 20 subsets in 128 × 128 with 5.6 mm pixel size. A filter of 6 mm (FWHM) was applied after the reconstruction. Images were reconstructed at NIH with OSEMTOF, 3 iterations and 33 subsets in 144 × 144 with 4 mm pixel size.
2.2. Simulation and reconstruction
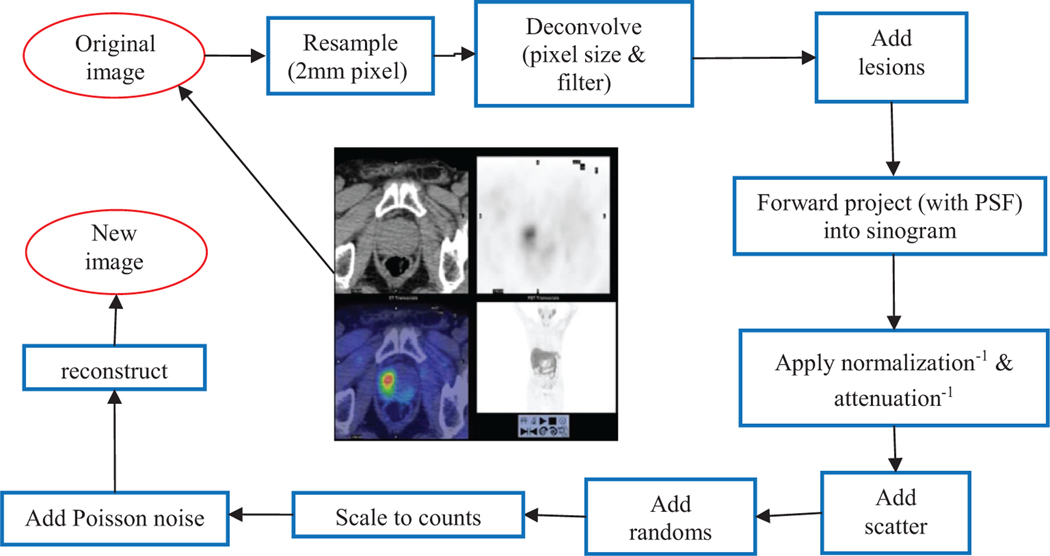
In a preliminary step, the original image is re-sampled at a higher resolution (2 mm pixel size) and the estimated system resolution is deconvolved from the image. The simulated lesions are inserted in the deconvolved image.
Two lesion locations were selected: a lesion inside the prostate, but close to the capsule, in order to assess the capability to discriminate intra capsular from extra capsular tumors; a lesion in the pelvic region but outside the prostate, in order to simulate a lymph node metastasis. Lesion size and intensity were variable in a selected range. The intensity was measured in standard uptake value (SUV). The body contour obtained from the CT was used to obtain a volume of interest (VOI) including the patient body; the average activity density (Bq ml−1) inside the body was computed and used as a reference level corresponding to SUV=1; lesion intensity, which we can name ‘pseudo-SUV’, was determined as multiple of such reference average value. For example, a pseudo-SUV of 4 was defined as a lesion with activity density 4 times the mean value in the body. The ‘pseudo-SUV’ is assumed to be proportional to the actual SUV.
Lesion diameters were 4, 6 and 10 mm; lesion pseudo-SUVs were 4, 6 and 8.
The image with the lesion is forward projected into a sinogram space using the geometry and the sinogram representation of a Siemens mCT TOF PET scanner (Schaefferkoetter et al 2013). During the projection, spatially variant point spread function, detector sensitivity and attenuation are applied: we use the inverse of mCT normalization and the inverse of the attenuation correction as computed from the CT associated with the original PET image. Single scatter simulation, using the attenuation map and the simulated sinogram, were used to estimate two-dimensional (2D) TOF scatter sinograms (Watson et al 2004, Watson 2007). Inverse single slice rebinning was used to extrapolate scatter for oblique planes. This type of scatter simulation does not model multiple scattering events or contribution from out of FOV activity but serves as a good approximation of observed scatter. The simulated scatter is added to the sinogram. Finally, the randoms (50%) and the Poisson noise are added. The simulation is set to a predefined number of total ‘Net trues’ counts (Trues+Scatter) in the sinogram of 30 × 106 total counts. Fifty realizations of each sinograms are generated for each lesion, and 100 realizations for a no-lesion case, used as a reference baseline.
The mCT sinograms are made of 400 radial bins (2 mm size), 168 views, and 621 planes. The direct planes (109) have a 2 mm pitch, covering about 22 cm axial FOV. There are 13 TOF sinograms of the same size, 312 ps wide, and the time resolution of the scanner is about 550 ps.
A flow diagram of the simulation process is presented in figure 1. Each simulated sinogram was reconstructed using two methods: (a) a low resolution OSEM, i.e. an OSEM iterative algorithm analog to the original reconstruction used at the clinical site, same image pixel size, subsets and iteration, post-reconstruction filter; (b) a high resolution OSEM+PSF+TOF with 2 mm pixel size, 21 subsets, 2 iterations, 4 mm filter. The subsets and iteration number used for OSEM+PSF+TOF reconstruction are typical recommended values for the Siemens mCT scanner (Jakoby et al 2011).
Figure 1.
Flow diagram of the simulation process.
2.3. Quantitative recovery of activity and SUV
A VOI with the same position and size of each inserted lesion was defined and used to measure the input total activity in Bq, the input specific activity in Bmq l−1, the input SUV. The same VOIs were used to measure the output values, defined as the mean value in the output images in the VOIs, averaged across 50 realizations. The uncertainty on each measurement was defined as the standard deviation across the 50 realizations.
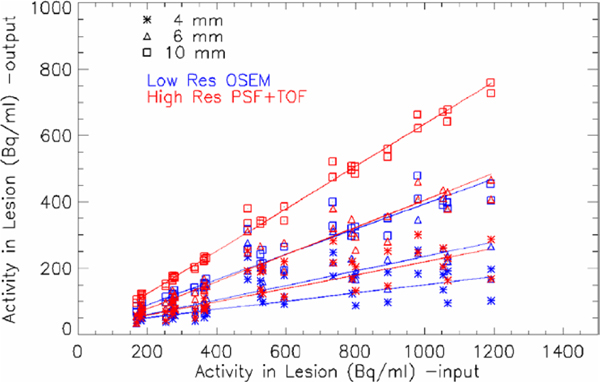
A linear fit was used to compute a recovery coefficient for the activity or the SUV: the recovery coefficient was defined as the slope of the line that best fits the data points. For the fit, all patients and lesion locations were used, but separated based on the size of the lesion. The two reconstruction methods were compared.
2.4. Numerical observers and detectability
Image analysis is based on the visual perception of a human observer making the diagnosis. Ideally, the evaluation of an imaging system should be based upon its human observer performance. However, our current work is based on using several image reconstruction parameters that is time-consuming and not practical with human observers. A numerical observer model can be employed for such an extensive analysis. Numerical observer models, using a matched filter with or without a pre-whitening operator have been used in several studies alongside human observers to demonstrate their equivalence (Barrett et al 1993, Abbey and Barrett 2001, Chen et al 2001, Lartizien et al 2004, Gifford et al 2007). We employed a channelized Hotelling observer (CHO) model that has been shown to provide detectability measures that correlate those from a human observer for certain lesion-detection task (Abbey and Barrett 2001).
Our main objective was to investigate whether the use of advanced reconstruction techniques would offer improved lesion detection for prostate imaging. This means that an observer was trained to use any single reconstruction method to provide diagnosis. Consequently, an observer template was computed independently for each reconstruction method and each post-smoothing filter used (Kadrmas et al 2009a). A pool of reconstructed images was obtained from all patients with different lesion sizes, SUVs and lesion location (N=576). This formed the lesion-present dataset. An equivalent pool of lesion-absent dataset was also obtained. A 2D subset of the reconstructed image (3.87 cm × 3.87 cm) centered on the lesion was used to compute the template. The CHO template can be expressed as
where wCHO is the CHO template, is the mean lesion-present data, is the mean lesion-absent data, K is the image covariance matrix and U is the channel response function. A three channel sparse difference-of-Gaussian function was used. In the spatial domain it can be expressed as (Wunderlich and Noo 2008),
where for j = [1, 2, 3] and . Here (x0, y0) is the location of the lesion center and σ0=0.02 cycles/pixel, β=2 and q=2 are the free parameters (Schaefferkoetter et al 2013). The template was further degraded by adding internal noise in order to model the human observer uncertainty in rating a given dataset. This was accomplished by doubling the diagonal elements of the channelized pre-whitening operator (UtK−1U) (Abbey and Barrett 2001) and has been shown to provide detectability estimates similar to a human observer (Brankov 2013, Schaefferkoetter et al 2013).
Each CHO template was used to obtain ratings for the test population that consisted of an independent pool of data similar to those used to obtain the template (N = 576). We used localization and detection analysis (LROC) for the test population. In this technique, the CHO template was applied to each voxel in the entire image to obtain a perception measure (λ) expressed as
where f(1,0) represents lesion-present or lesion-absent image and is the mean lesion-absent data. The subtraction of mean lesion-absent data removes background information before applying the template. Figure 2 shows a map of the perception measure obtained for the search region of the corresponding test image. A correctly localized image is identified when the maximum of the perception measure map lies within a specified localization radius of the lesion center; otherwise the image is classified as incorrectly localized. Since lesion inside the prostate and outside the prostate lie on the same plane, a mask is used to block the undesired lesion. The localization radius was chosen as 3 times the lesion radius (Gifford et al 2007). In the case of lesion-absent data, the maximum of the perception measure map anywhere in the image was used. A Wilcoxon test statistic (Hanley and Mcneil 1982) was computed to represent the area under the LROC curve (ALROC) using perception measures obtained from correctly localized images and lesion-absent images. This measure indicates the probability of correctly localizing and ranking a random pair of lesion-present and lesion-absent image and was used as a figure of merit for lesion detectability.
Figure 2.
PSFTOF reconstructed image for lesion size 6 mm and SUV 8 of patient 1 dataset (a), the corresponding difference from mean lesion-absent data (b) and the perception measure map (c). The location of two lesions are shown with arrows.
In order to evaluate the effect of different lesion sizes, SUVs and lesion location on the detectability, a test pool for each case was generated using 46 samples for each case. LROC analysis as described earlier was used to classify correctly and incorrectly localized images and obtain ALROC measure for each case.
3. Results
A sample patient, scanned on a BGO-based PET/CT with 11C-choline as a tracer, is presented in figure 3. The patient, weight 65 kg, was injected with 295 MBq of 11C-choline, and acquisition time was 120 s. The patient, imaged before a prostatectomy, was diagnosed with PCa that was localized in the prostate. The original image had 5.5 × 5.5 × 3.3 mm3 voxels and the reconstruction method was OSEM with 20 subsets, 2 iterations, and a 6 mm post-reconstruction filter. Two simulated lesions were inserted in the pelvic region: the size of both lesions was 6 mm and the input SUV was 6. A fused PET/CT transaxial slice is shown in figure 3. One can appreciate the improved visual detectability using PSF+TOF and 2 mm pixel size.
Figure 3.
A PCa patient with 11C-choline injection: (a) the original fused PET/CT image, with no simulated lesion (the ‘true’ original large tumor is visible in the prostate); (b) the OSEM reconstruction with the same parameters as in the original image (5.5 × 5.5 × 3.3 mm3 voxels, OSEM with 20 subsets, 2 iterations, and a 6 mm post-reconstruction filter), after insertion of two 6 mm lesions with SUV=6 (center); (c) the PSF+TOF reconstruction with 2 mm voxel size, after insertion of the two 6 mm lesions. The arrows point to the location of the simulated lesions.
3.1. Quantitative recovery of activity and SUV
The activity density recovered in all lesions for all patients is summarized in figure 4. The low spatial resolution data point (blue) and the high resolution PSF+TOF reconstruction (red) are plotted for all lesions: 4 mm lesions (asterisk), 6 mm lesions (triangle), 10 mm lesions (square). A linear fit (line through the data points) is used for estimating the recovery coefficients for each method and each lesion size: we expect the recovery to depend on the size of the lesion. The smaller pixel size and the advanced PSF+TOF reconstruction result into a recovery about two times higher than the low resolution images. The best improvement was observed for the 6 mm lesion, where the recovery coefficient passed from 22% for low resolution OSEM to 41% for PSF+TOF. Table 1 contains the recovery coefficients for all sizes and both methods. In figure 5 the measured total activity in the lesion is plotted as a function of the input total activity. A zoom into the low activity range shows the challenge of recovering small concentrations in small lesions, but the improvement of the high resolution PSF+TOF method can still be appreciated.
Figure 4.
Output activity density versus input activity density, for low spatial resolution OSEM (blue) and high resolution PSF+TOF reconstruction (red), are plotted for all lesions: 4 mm lesions (asterisk), 6 mm lesions (triangle), 10 mm lesions (square). Linear fit through the data is shown.
Table 1.
Recovery coefficients obtained through a linear fit, all patients, and all SUV values
| Lesion Size | Method | Recovery coefficient | χ 2 |
|---|---|---|---|
| 4 mm | OSEM low res | 0.125 ± 0.004 | 22.34 |
| PSF + TOF high res | 0.202 ± 0.007 | 6.2 | |
| 6 mm | OSEM low res | 0.219 ± 0.004 | 13.3 |
| PSF + TOF high res | 0.409 ± 0.009 | 4.8 | |
| 10 mm | OSEM low res | 0.380 ± 0.004 | 9.1 |
| PSF + TOF high res | 0.640 ± 0.006 | 1.7 |
Figure 5.
Output total activity in the lesion versus input total activity, for low spatial resolution OSEM (blue) and high resolution PSF+TOF reconstruction (red), are plotted for all lesions: 4 mm lesions (asterisk), 6 mm lesions (triangle) and 10 mm lesions (square). Linear fit through the data is shown. The full range is covered on the left plot, and a zoom in the small activity range is shown on the right plot.
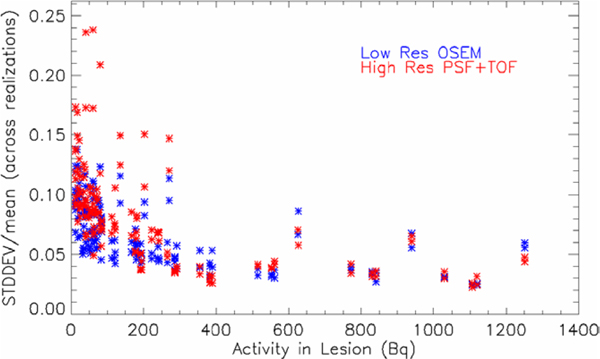
The strong improvement in recovery for the high resolution reconstruction comes at the cost of only a moderate increase of statistical noise or uncertainty in the measurement. In figure 6, the normalized standard deviation (across all realizations) of the measured activity is plotted as a function of the input total activity in the lesion: for PSF+TOF high resolution data (red), a slightly higher noise value can be observed at low activities, compared to the smoother low resolution OSEM images (blue).
Figure 6.
Normalized standard deviation of the measured activity in the lesion is plotted as a function of the input total activity in the lesion: PSF+TOF high resolution data (red) and OSEM low resolution data (blue).
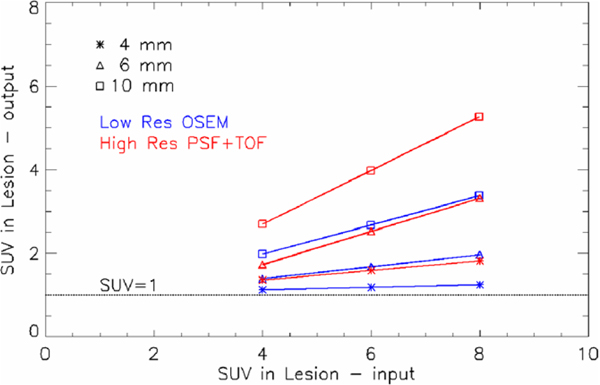
The recovery coefficient has a direct impact on the SUV recovery. In figure 7, the linear relationship between the measured SUV versus input SUV is shown: the line obtained fitting all pooled patients and lesion positions is shown. The three different lesion sizes are separated: 4 mm lesions (asterisk), 6 mm lesions (triangle), 10 mm lesions (square). One can observe that the measured SUV does increase with the input SUV in the lesion for all cases, except for the smallest 4 mm lesion and the low resolution reconstruction. For this case, the recovery is very poor: the measured SUVs are all very close to 1 (SUV=1 line is shown as a reference). This implies that the smallest lesions, regardless of the input SUV in the range 4–8, cannot be distinguished from the background using low resolution, while high resolution PSF+TOF could allow at least for the detection of a lesion, if not a good quantification.
Figure 7.
Linear fit for the measured SUV versus input SUV, obtained pooling all patients and lesion positions. The three different lesion sizes are separated: 4 mm lesions (asterisk), 6 mm lesions (triangle) and 10 mm lesions (square). The SUV=1 level is shown.
3.2. LROC analysis and detectability
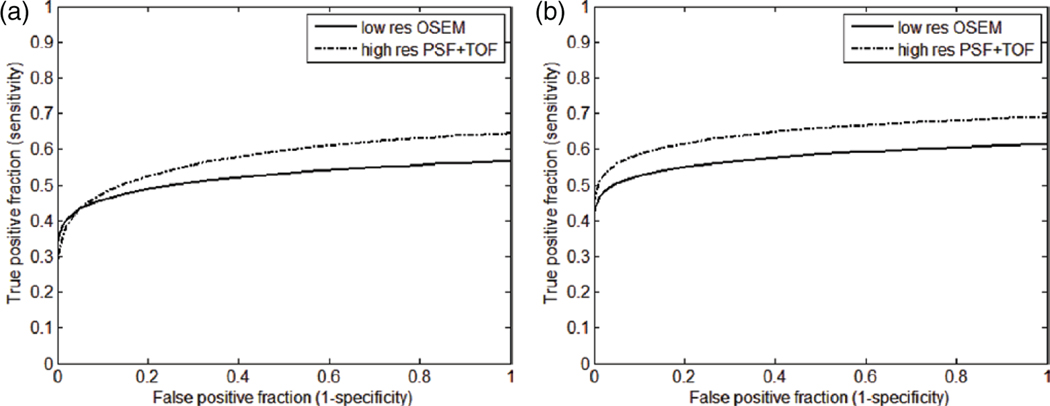
The true positive fraction (TPF) as a function of false positive fraction (FPF) for all pooled patients and lesions is shown in figure 8, for the low resolution OSEM reconstruction and the high resolution PSF+TOF method (with 4 mm filter). The ALROC was measured to be 0.52 ± 0.02 for low resolution and 0.58 ± 0.02 for high resolution reconstruction when the CHO template was computed using training data from all the lesion sizes (figure 8(a)). On the other hand, when the template was trained on only 4 and 6 mm lesion data, the ALROC for low resolution OSEM was 0.58 ± 0.02 and for high resolution PSF+TOF was 0.65 ± 0.02 (figure 8(b)). It can be noted that the improvement in detectability is larger when the observer is trained to detect smaller lesions only.
Figure 8.
LROC plot of the pooled patient data for low resolution OSEM reconstruction and high resolution PSF+TOF (2 iteration, 21 subsets, 4 mm filter). All lesions used for observer’s training (a); only smaller lesions (4 and 6 mm) used for observer’s training (b).
Even though PSF and TOF reduce noise, the high resolution images could appear, to a human observer, as characterized by a high noise level. Moderate filtering can reduce the speckle noise without visible degradation in spatial resolution. In figure 9, a sample transaxial slice of a patient is shown for the low resolution method and the high resolution with no filter and a 4 mm filter. It can be observed that the images obtained with high resolution provide better visual lesion contrast compared to the original low resolution. A limited filtering can reduce the noise maintaining high contrast. In fact, this can result in improved detectability, and can be seen in figure 10, where the ALROC is shown for all methods and filters considered. In all the cases, the 4 mm filter produces better ALROC than unfiltered data, and it is therefore chosen for PSF+TOF images. Other detectability studies, on experimental data, confirmed that an optimal filter is in the range 0–2 times the image pixel size, depending on the iteration number chosen (Kadrmas et al 2009b, Morey et al 2013).
Figure 9.
Transaxial slice reconstructed with low resolution OSEM (a), high resolution PSF+TOF with no filter (b), and 4 mm filter (c). The simulated lesions of size 6 mm and SUV of 6 are shown with arrows.
Figure 10.
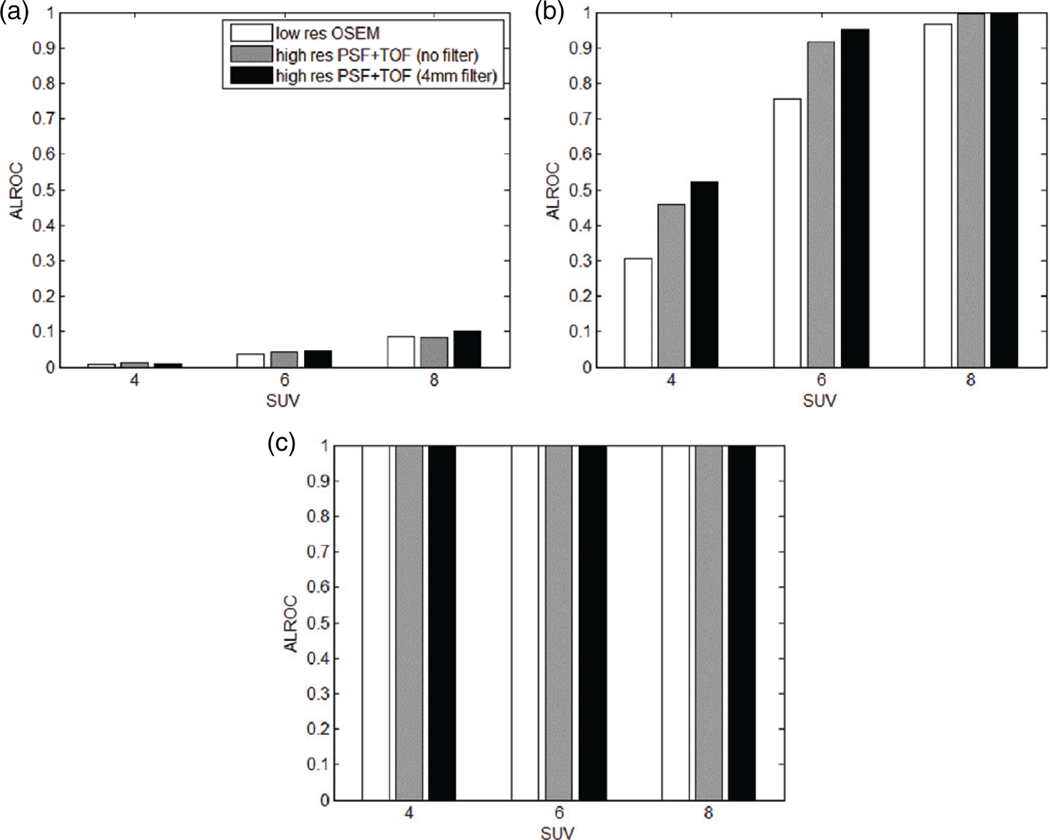
ALROC of the pooled patient data versus lesion input SUV, for low resolution OSEM reconstruction and high resolution PSF+TOF with different filters: 4 mm lesion (a), 6 mm lesion (b) and 10 mm lesion (c).
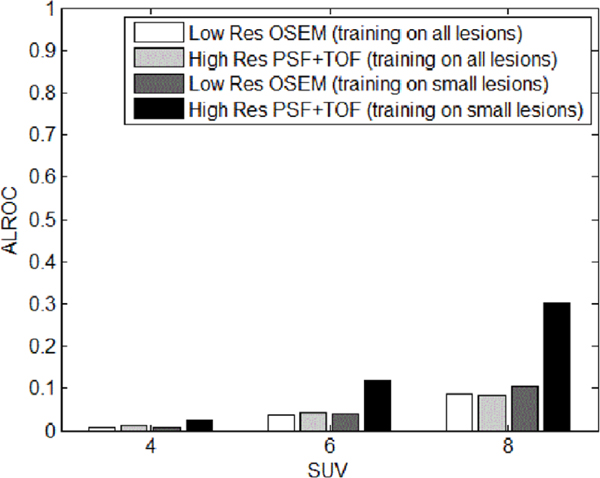
A plot of the ALROC as a function of lesion SUV for different lesion sizes for all the patients is shown in figure 10. It can be seen that, in general, PSF+TOF, both without filter and with filter, yields higher ALROC compared to low resolution OSEM. The largest lesion is fully detectable with all methods. A strong increase can be observed in the 6 mm lesion ALROC due to the high resolution method. Overall, detectability is still poor at 4 mm, but some improvement can be observed. However, when the CHO template trained on smaller lesions is applied to the 4 mm lesion testing data, high resolution PSF+TOF shows a greater improvement relative to low resolution OSEM, as can be seen in figure 11.
Figure 11.
ALROC of the pooled patient data versus lesion input SUV, for low resolution OSEM reconstruction and high resolution PSF+TOF, for 4 mm lesion with different CHO templates.
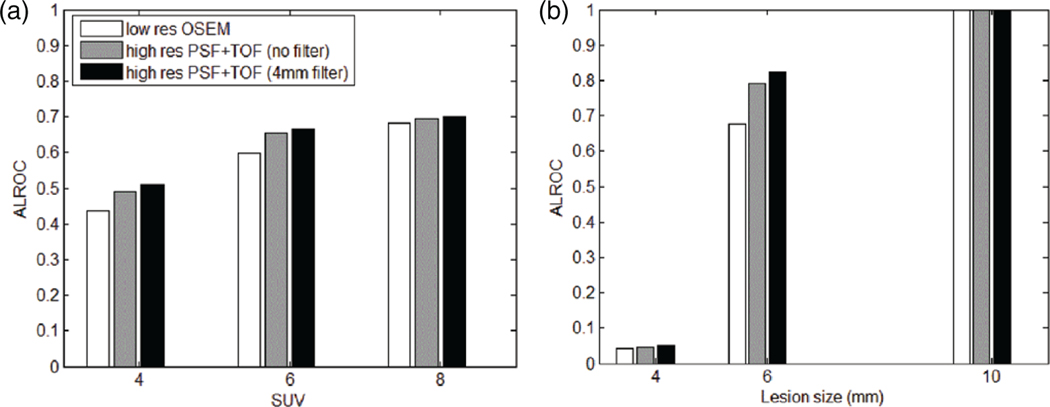
In figure 12, the ALROC for all patients, lesion positions and sizes were grouped and plotted versus SUV (a). Then ALROC for all patients, lesion positions and SUVs were grouped and plotted versus size (b). Detectability is reduced dramatically when the object size is smaller than the intrinsic spatial resolution of the simulated scanner, which is about 4.5 mm (Jakoby et al 2011). Nevertheless, even in this case, a small improvement in detectability can be observed with high resolution PSF+TOF. The ALROC values for low resolution OSEM and high resolution PSF+TOF (4 mm filter), presented in table 2, show that most improvement in detectability is observed for 6 mm lesions (up to 20%).
Figure 12.
ALROC of the pooled patient data for low resolution OSEM reconstruction and high resolution PSF+TOF with different filters: as a function of the lesion SUV (a), and as a function of the lesion size (b).
Table 2.
ALROC for different lesion size and SUVs with low resolution OSEM and high resolution PSF + TOF (4 mm filter).
| Lesion size | 4 mm | 6 mm | 10 mm | ||||||
|---|---|---|---|---|---|---|---|---|---|
|
| |||||||||
| SUV | 4 | 6 | 8 | 4 | 6 | 8 | 4 | 6 | 8 |
| Low res. OSEM | 0.007 | 0.036 | 0.085 | 0.307 | 0.756 | 0.966 | 0.999 | 1 | 1 |
| High res. PSF + TOF | 0.011 | 0.046 | 0.101 | 0.521 | 0.952 | 0.999 | 1 | 1 | 1 |
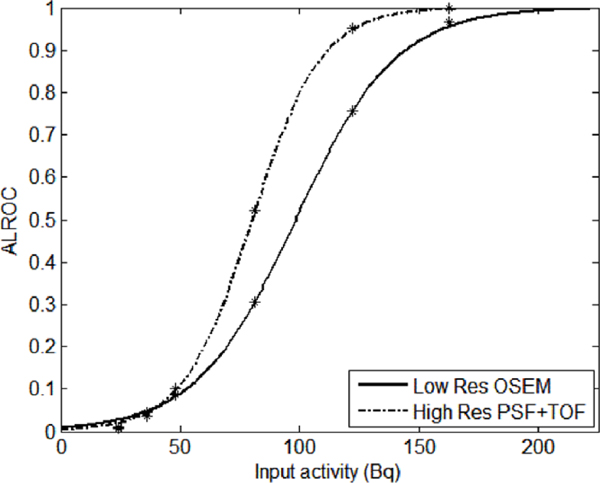
In an effort to relate numerical observer results to the quantitative analysis results, a plot of the ALROC as a function of the total activity in the simulated lesion was obtained, as seen in figure 13. In this plot, ALROC for the low resolution OSEM and the high resolution PSF+TOF (4 mm filter) for all the pooled patient data are shown. Each data point represents a particular lesion size and SUV. The plot displays only those data points having input activity in the range of 0–220 Bq which cover the 4 and 6 mm lesions. An exponential fit was generated to fit the data points for each reconstruction method. One can directly correlate the probability of a small tumor to be detected with the total activity uptake or, if the uptake mechanism is properly characterized, with the number of cancer cells present. It could be used as a way to identify the detectability limit for a small tumor. For example, if one sets a limit for detectability as a function of the total uptake that results in ALROC of 0.9, one can notice that high resolution PSF+TOF lowers such limit from about 145 to 112 Bq, an improvement of about 23%.
Figure 13.
ALROC for low resolution OSEM reconstruction and high resolution PSF+TOF, as a function of the activity in the lesion averaged for pooled patient data.
4. Discussion
A consistent improvement in detectability for PCa lesions in the range 4–10 mm was observed using a high resolution PSF+TOF reconstruction compared to a low resolution regular OSEM, with no significant increase in noise. While such improvement is minor for lesions smaller or much larger than the size of the spatial resolution of the simulated PET scanner (4.5 mm for the Siemens mCT), the improvement is higher in the intermediate range, namely for 6 mm lesions. This result shows that it is possible to increase the detectability of lesions closer in size to the spatial resolution limits of the scanner. This is consistent with other scientific publications showing increased detectability with TOF and PSF+TOF (Kadrmas et al 2009b, El Fakhri et al 2011, Schaefferkoetter et al 2013). After 10 mm lesions (El Fakhri et al 2011, Schaefferkoetter et al 2013) and variable size 6–16 mm lesions (Kadrmas et al 2009b), with variable contrast or intensity were inserted in simulated and experimental data, numerical and human observers clearly confirmed an increase in detectability due to the improved reconstruction method. It was also observed that such increases were higher for lower statistics scans, i.e. in more challenging experimental conditions (Schaefferkoetter et al 2013).
In addition, our work focused on the effect of smaller image pixel size, or high resolution imaging, on detectability. Improvement in detectability using the high resolution reconstruction was clearly evident for the 6 mm lesions compared to the 4 or 10 mm lesions for the input activity simulated. Potentially, an increase in count statistics with smaller lesions can also offer better detectability with high resolution PSF+TOF method, which is being pursued as part of our future investigations.
A strong increase in activity recovery or SUV is observed in the whole 4–10 mm range. This is particularly relevant if correct quantification or accurate SUV estimate are needed, possibly for more accurate staging of the disease. Finally, the minimum detectable activity was reduced by more than 20% with high resolution PSF+TOF reconstruction for a 6 mm lesion.
Several limitations of the method used for this study need to be underlined.
Using a clinical image as a starting point for the simulation, instead of a synthetic image, has the advantage of a realistic background distribution of the tracer, but at the same time the noise pattern in the original image is transferred as ‘signal’ in the simulation, on which additional Poisson noise is added. This can result in excessive speckle noise in the simulated images.
The deconvolution method used to recover a virtual original high resolution image, before the blurring due to the low resolution reconstruction, is just a Gaussian kernel with full width half maximum equal to the estimated resolution of the scanner used in the clinic, and this simple approach might not be accurate enough.
The random fraction was set to 50% for all patients and simulations, but in fact the scatter fraction has a large variability.
Finally, the total net trues counts (prompts minus delayed) were set to 30 × 106 for all patients and simulations, but in fact the number of counts has large variability too.
On the other hand, some of the simulation conditions and parameters discussed above are more challenging than experimental ones: in a typical acetate or choline study, because of the high dose injection and short half-life, the total counts are higher than 30 × 106; and experimental sinograms have a more realistic noise pattern that will probably produce images with less speckle noise. In fact, an even larger improvement in numerical observers’ detectability, if using PSF+TOF and 2 mm pixels reconstruction, was recently observed in an experimental study on a Siemens mCT PET/CT scanner (Morey et al 2013).
Other limitations of this study are more general, and are related to how well this simulation can describe a clinical case and how much of the conclusions drawn by numerical observers can be exported into the clinical practice. Even though good correlation has been observed between numerical observers and human observers (Kadrmas et al 2009b, Schaefferkoetter et al 2013), numerical observers might not be quantitatively equivalent to the detectability of a lesion in a clinical environment where several factors play a role in establishing presence or absence of a lesion. However, the numerical observer models are good tools to assess the relative detectability among different methods being evaluated in a controlled fashion.
In any case, simulation results need to be confirmed by experimental and clinical data. In particular, any assessment about minimum detectable activity needs to be confirmed with histological analysis.
5. Conclusion
In this work, based on simulations of realistic distributions of prostate cancer PET tracers, small lesions (4–10 mm) in the pelvic area were simulated. Data were reconstructed with low resolution OSEM and high resolution OSEM+PSF+TOF. With high resolution, the activity recovery coefficient almost doubled in this range, allowing for a more accurate quantification. At the same time, channelized Hotelling numerical observers measured ALROC detectability increasing from 0.52 to 0.58. Finally, the minimum detectable activity was reduced by more than 23%.
These results need to be confirmed with experimental data and in the clinical environment. Nevertheless, our results hint that it is possible to push the past limits of detectability and localization of small tumors in the pelvic area, if using the present generation of TOF PET scanners.
Also, PET images have to be correlated with post-surgery histological examinations, to validate the spatial distribution of cancerous cells. Finally, it needs to be assessed whether we can actually reduce false negatives and false positives using better reconstruction, and whether the improved spatial localization can provide support for biopsy and/or surgery.
Acknowledgment
We would like to thank Hossein Jadvar for the useful conversations on the recent developments of prostate cancer imaging.
References
- Abbey C K and Barrett H H 2001. Human- and model-observer performance in ramp-spectrum noise: effects of regularization and object variability J. Opt. Soc. Am A 18 473–88 [DOI] [PMC free article] [PubMed] [Google Scholar]
- Afshar-Oromieh A et al. 2013PET imaging with a [68Ga]gallium-labelled PSMA ligand for the diagnosis of prostate cancer: biodistribution in humans and first evaluation of tumour lesions Eur. J. Nucl. Med. Mol. Imag 40486–95 [DOI] [PubMed] [Google Scholar]
- Afshar-Oromieh A et al. 2014Comparison of PET imaging with 68Ga PSMA ligand and 18F-choline-based PET/CT for the diagnosis of recurrent prostate cancer Eur. J. Nucl. Med. Mol. Imag 4111–20 [DOI] [PMC free article] [PubMed] [Google Scholar]
- Apolo A B, Pandit-Taskar N and Morris M J 2008. Novel tracers and their development for the imaging of metastatic prostate cancer J. Nucl. Med 49 2031–41 [DOI] [PMC free article] [PubMed] [Google Scholar]
- Barrett H H, Yao J, Rolland J P and Myers K J 1993. Model observers for assessment of image quality Proc. Natl Acad. Sci. USA 90 9758–65 [DOI] [PMC free article] [PubMed] [Google Scholar]
- Bouchelouche K, Tagawa S T, Goldsmith S J, Turkbey B, Capala J and Choyke P 2011. PET/CT imaging and radioimmunotherapy of prostate cancer Sem. Nucl. Med 41 29–44 [DOI] [PMC free article] [PubMed] [Google Scholar]
- Brankov J G 2013Evaluation of the channelized Hotelling observer with an internal-noise model in a train-test paradigm for cardiac SPECT defect detection Phys. Med. Biol 587159–82 [DOI] [PMC free article] [PubMed] [Google Scholar]
- Chen M, Peter J, Jaszczak R, Gilland D, Bowsher J, Tornai M and Metzler S 2001. Observer studies of cardiac lesion detectability with triple-head 360° vs. dual-head 180° SPECT acquisition using simulated projection data IEEE Nucl. Sci. Symp. Conf. Rec 4 2229–33 [Google Scholar]
- Conti M 2009State of the art and challenges of time-of-flight PET Phys. Med 251–11 [DOI] [PubMed] [Google Scholar]
- Conti M 2011Focus on time-of-flight PET: the benefits of improved time resolution Eur. J. Nucl. Med. Mol. Imag 381147–57 [DOI] [PubMed] [Google Scholar]
- De Jong I J, Pruim J, Elsinga P H, Vaalburg W and Mensink H J 2003. Preoperative staging of pelvic lymph nodes in prostate cancer by 11C-choline PET J. Nucl. Med 44 331–5 [PubMed] [Google Scholar]
- Degrado T R, Coleman R E, Wang S, Baldwin S W, Orr M D, Robertson C N, Polascik T J and Price D T 2001. Synthesis and evaluation of 18F-labeled choline as an oncologic tracer for positron emission tomography: initial findings in prostate cancer Cancer Res. 61 110–7 [PubMed] [Google Scholar]
- El Fakhri G, Surti S, Trott C M, Scheuermann J and Karp J S 2011. Improvement in lesion detection with whole-body oncologic time-of-flight PET J. Nucl. Med 52 347–53 [DOI] [PMC free article] [PubMed] [Google Scholar]
- Farsad M et al. 2008Positron-emission tomography in imaging and staging prostate cancer Cancer Biomark 4277–84 [DOI] [PubMed] [Google Scholar]
- Fox J J, Schoder H and Larson S M 2012. Molecular imaging of prostate cancer Curr. Opin. Urol 22 320–7 [DOI] [PMC free article] [PubMed] [Google Scholar]
- Gifford H C, Member I, Kinahan P E, Member I S, Lartizien C, King M A and Member I S 2007. Evaluation of multiclass model observers in PET LROC studies IEEE Trans. Nucl. Sci 54 116–23 [DOI] [PMC free article] [PubMed] [Google Scholar]
- Hanley J A and Mcneil B J 1982. The meaning and use of the area under a receiver operating characteristic (ROC) curve Radiology 143 29–36 [DOI] [PubMed] [Google Scholar]
- Hara T, Kosaka N and Kishi H 2002. Development of (18)F-fluoroethylcholine for cancer imaging with PET: synthesis, biochemistry, and prostate cancer imaging J. Nucl. Med 43 187–99 [PubMed] [Google Scholar]
- Jadvar H 2011Prostate cancer: PET with 18F-FDG, 18F- or 11C-acetate, and 18F- or 11C-choline J. Nucl. Med 5281–9 [DOI] [PMC free article] [PubMed] [Google Scholar]
- Jadvar H 2012Molecular imaging of prostate cancer: PET radiotracers Am. J. Roentgenol 199278–91 [DOI] [PMC free article] [PubMed] [Google Scholar]
- Jakoby B, Bercier Y, Conti M, Casey M, Bendriem B and Townsend D 2011. Physical and clinical performance of the mCT time-of-flight PET/CT scanner Phys. Med. Biol 56 2375–89 [DOI] [PubMed] [Google Scholar]
- Kadrmas D J, Casey M E, Black N F, Hamill J J, Panin V Y and Conti M 2009a. Experimental comparison of lesion detectability for four fully-3D PET reconstruction schemes IEEE Trans. Med. Imag 28 523–34 [DOI] [PMC free article] [PubMed] [Google Scholar]
- Kadrmas D J, Casey M E, Conti M, Jakoby B W, Lois C and Townsend D W 2009b. Impact of time-of-flight on PET tumor detection J. Nucl. Med 50 1315–23 [DOI] [PMC free article] [PubMed] [Google Scholar]
- Karp J S, Surti S, Daube-Witherspoon M E and Muehllehner G 2008. Benefit of time-of-flight in PET: experimental and clinical results J. Nucl. Med 49 462–70 [DOI] [PMC free article] [PubMed] [Google Scholar]
- Kotzerke J, Gschwend J E and Neumaier B 2002. PET for prostate cancer imaging: still a quandary or the ultimate solution? J. Nucl. Med 43 200–2 [PubMed] [Google Scholar]
- Lartizien C, Kinahan P E and Comtat C 2004. Volumetric model and human observer comparisons of tumor detection for whole-body positron emission tomography Acad. Radiol 11 637–48 [DOI] [PubMed] [Google Scholar]
- Lois C, Jakoby B W, Long M J, Hubner K F, Barker D W, Casey M E, Conti M, Panin V Y, Kadrmas D J and Townsend D W 2010. An assessment of the impact of incorporating time-of-flight information into clinical PET/CT imaging J. Nucl. Med 51 237–45 [DOI] [PMC free article] [PubMed] [Google Scholar]
- Lutje S, Boerman O C, Van Rij C M, Sedelaar M, Helfrich W, Oyen W J and Mulders P F 2012. Prospects in radionuclide imaging of prostate cancer Prostate 72 1262–72 [DOI] [PubMed] [Google Scholar]
- Mease R C et al. 2008N-[N-[(S)-1,3-dicarboxypropyl]carbamoyl]-4-[18F]fluorobenzyl-L-cysteine, [18F]DCFBC: a new imaging probe for prostate cancer Clin. Cancer Res 143036–43 [DOI] [PMC free article] [PubMed] [Google Scholar]
- Morey A M, Noo F and Kadrmas D J 2013. Improved PET lesion-detection performance using 2 mm pixels IEEE Nucl. Sci. Symp. Conf. Rec pp 1–4 [Google Scholar]
- Oyama N, Miller T R, Dehdashti F, Siegel B A, Fischer K C, Michalski J M, Kibel A S, Andriole G L, Picus J and Welch M J 2003. 11C-acetate PET imaging of prostate cancer: detection of recurrent disease at PSA relapse J. Nucl. Med 44 549–55 [PubMed] [Google Scholar]
- Panin V Y, Kehren F, Michel C and Casey M 2006. Fully 3-D PET reconstruction with system matrix derived from point source measurements IEEE Trans. Med. Imag 25 907–21 [DOI] [PubMed] [Google Scholar]
- Picchio M et al. 2006Value of 11C-choline PET and contrast-enhanced CT for staging of bladder cancer: correlation with histopathologic findings J. Nucl. Med 47938–44 [PubMed] [Google Scholar]
- Reske S N, Blumstein N M, Neumaier B, Gottfried H W, Finsterbusch F, Kocot D, Moller P, Glatting G and Perner S 2006. Imaging prostate cancer with 11C-choline PET/CT J. Nucl. Med 47 1249–54 [PubMed] [Google Scholar]
- Schaefferkoetter J, Casey M, Townsend D and El Fakhri G 2013. Clinical impact of time-of-flight and point response modeling in PET reconstructions: a lesion detection study Phys. Med. Biol 58 1465–78 [DOI] [PMC free article] [PubMed] [Google Scholar]
- Schiepers C, Hoh C K, Nuyts J, Seltzer M, Wu C, Huang S C and Dahlbom M 2008. 1–11C-acetate kinetics of prostate cancer J. Nucl. Med 49 206–15 [DOI] [PubMed] [Google Scholar]
- Schuster D M, Votaw J R, Nieh P T, Yu W, Nye J A, Master V, Bowman F D, Issa M M and Goodman M M 2007. Initial experience with the radiotracer anti-1-amino-3–18F-fluorocyclobutane-1-carboxylic acid with PET/CT in prostate carcinoma J. Nucl. Med 48 56–63 [PubMed] [Google Scholar]
- Watson C C 2007Extension of single scatter simulation to scatter correction of time-of-flight PET IEEE Trans. Nucl. Sci 541679–86 [Google Scholar]
- Watson C C, Casey M E, Michel C and Bendriem B 2004. Advances in scatter correction for 3D PET/CT IEEE Nucl. Sci. Symp. Conf. Rec 5 3008–12 [Google Scholar]
- Wunderlich A and Noo F 2008 Evaluation of the impact of tube current modulation on lesion detectability using model observers Conf. Proc. IEEE Eng. Med. Biol. Soc 2008. 2705–8 [DOI] [PubMed] [Google Scholar]
- Zaheer A, Cho S Y and Pomper M G 2009. New agents and techniques for imaging prostate cancer J. Nucl. Med 50 1387–90 [DOI] [PMC free article] [PubMed] [Google Scholar]


