

Abstract
Cannabis use disorder (CUD) is commonly assessed using self-report items based on its symptoms as defined by the DSM that are scored on a dichotomous scale (yes/no) to indicate symptom presence; however, scoring items on a dichotomy may result in relatively limited sensitivity for research. Thus, we developed a 13-item measure of CUD, the Self-Reported Symptoms of Cannabis Use Disorder (SRSCUD), based on the 11 symptoms described in the DSM-5, that is scored on a 4-point response scale indicating degree of severity. In the present study, we conduct an initial evaluation of the psychometric properties of the SRSCUD. Past-month cannabis users (N = 2,077) were recruited from 9 universities in 9 states throughout the U.S. Each item of the SRSCUD loaded saliently on a single factor of CUD symptoms in both exploratory and confirmatory factor analyses. The SRSCUD was strongly correlated with measures of cannabis use, dependence severity, and cannabis-related problems. Additionally, the SRSCUD was moderately positively correlated with a well-known risk factor for CUD (coping motives) and moderately negatively correlated with a well-known protective factor for CUD (protective behavioral strategies). These correlations largely remained statistically significant while controlling for CUD symptom count and diagnosis using dichotomized SRSCUD items. Receiver operator characteristic curve analyses revealed that the SRSCUD had excellent sensitivity/specificity for predicting probable CUD. Although more research evaluating performance of the SRSCUD compared to a clinical diagnosis is needed, we found preliminary evidence for construct validity of this measure.
Keywords: cannabis, cannabis use disorder, marijuana, assessment, college students
National surveys show that cannabis use peaks in young adulthood and that the annual prevalence of cannabis use among young adults (40%) is the highest it has been in decades (Schulenberg et al., 2020). Further, among those who had not used cannabis by the 12th grade, college students had a 51% increased probability of past-year cannabis use compared to their non-college student peers (Miech et al., 2017), suggesting that the college environment promotes cannabis use. Among college students, there is considerable variability in experiencing negative consequences from cannabis use (Pearson et al., 2017). Regular cannabis users with a diagnosis of cannabis use disorder (CUD) report high psychiatric comorbidity and psychosocial impairment compared to regular cannabis users without CUD (Foster et al., 2018). Valid self-report measures for assessing CUD symptoms and detecting probable CUD are needed to better understand the etiology of CUD to inform intervention efforts.
Notably, several self-report measures of cannabis use and dependence severity exist, the most well-validated being the Cannabis Use Disorder Identification Test-Revised (CUDIT-R; Adamson et al., 2010), which have conceptual overlap with CUD symptoms and are often used to detect probable CUD. However, these measures include items reflecting cannabis consumption, dependence, and problems and thus conflate these constructs and do not provide comprehensive assessments of CUD symptoms, i.e. the diagnostic criteria of the Diagnostic and Statistical Manual of Mental Disorders (DSM-5; American Psychiatric Association [APA], 2013). Indeed, psychometric work on the Alcohol Use Disorders Identification Test (AUDIT; Saunders et al., 1993), the equivalent to the CUDIT-R for alcohol, supports separate factors representing alcohol consumption, dependence, and problems (Maisto et al., 2000). That said, measures that specifically assess the symptoms of CUD that make up its diagnostic criteria may be particularly useful to further the understanding of risk/protective factors for CUD.
Researchers often assess CUD symptoms or probable CUD via self-report by creating items based on diagnostic interviews that represent each symptom of CUD defined in the DSM which are scored on a dichotomous scale (yes/no) (e.g., Curran et al., 2019; Leadbeater et al., 2019; Schultz et al., 2019). However, we are unaware of any comprehensive psychometric evaluations of such measures. Further, the use of binary as opposed to response scales with more than two options may be problematic for several reasons. Broadly, when CUD symptoms are dichotomized to create a symptom count, or when number of CUD symptoms are dichotomized to calculate presence of CUD diagnosis, there are two layers of false dichotomization. If a construct is distributed continuously (or graduated, to be more precise, a point made by Cohen, 1983), dichotomization can result in a substantial loss of statistical power, interfering with our ability to identify risk/protective factors for CUD symptoms. Relatedly, compared to dichotomized variables, continuous scores can have higher sensitivity to change (Rucker et al., 2015). Although there is continued debate as to whether psychological disorders, in general, are best conceptualized as categories or as existing on a continuum (e.g., Insel et al., 2010), there may be utility in a measure capturing CUD symptoms on a continuum of severity as opposed to whether the symptoms are present. Taken together, a more sensitive measure of CUD symptoms may be useful in identifying the psychological and behavioral factors that contribute to the development of CUD.
In the present study, we developed a 13-item measure designed to characterize the 11 symptoms of CUD as described in the DSM-5 that are scored on a response scale representing degree of severity. To evaluate the performance of this Self-Reported Symptoms of Cannabis Use Disorder (SRSCUD) measure, we first evaluated its psychometric properties by testing factorial validity, reliability, and measurement invariance across several socio-demographic groups. We hypothesized that a single common factor, representing CUD symptomatology, would provide a good fit to the data. Additionally, we expected the SRSCUD to demonstrate high reliability and measurement invariance across each socio-demographic group. We then tested convergent validity by examining the associations of the SRSCUD with measures of cannabis use and dependence severity, consumption, problems, and other known protective and risk factors for CUD (i.e., coping motives and protective behavioral strategies, respectively). We tested incremental validity by examining these same associations beyond CUD symptom count and CUD presence assessed using dichotomized SRSCUD items. Finally, we tested how accurately the SRSCUD detected individuals with a probable CUD. It was hypothesized that the SRSCUD would demonstrate both convergent and incremental validity.
Method
Participants and Procedures
We used convenience sampling to recruit college students from the psychology departments at nine universities across the United States to complete an online survey (standardized across sites) for partial course credit between Fall 2016 and Spring 2017. During data collection, participating universities in two states permitted recreational cannabis use (CO and WA), three states permitted medical cannabis use (NM, NY, and CA), and four states did not permit cannabis use (VA, TX, TN, and FL). A total of 7,000 students completed the study survey. For the purpose of the present study, we used data from 2,077 students who reported past-month cannabis use (Mage = 19.96, SD = 2.89; 61.2% female; 65.7% white). Notably, we used a planned missingness design to minimize participant burden and provide the sample size for each statistical analysis. These procedures received ethical approval from the IRBs at each participating university.
Measures
SRSCUD.
The SRSCUD was previously described in the introduction. Each of the 13 items (see Table 1) is derived from one of the 11 CUD symptoms described in the DSM-5. Tolerance and withdrawal symptoms were assessed using two items each because the DSM-5 describes two manifestations for both of these symptoms. The manifestations of tolerance diverge based on whether one increases (Item 10) or maintains (Item 11) their cannabis use. The manifestations of withdrawal diverge based on whether one reduces/abstains (Item 12) or maintains/increases (Item 13) their cannabis use. The items were responded to on a 4-point scale (0=not at all, 3=to a great extent). Every past-month cannabis user completed the SRSCUD. We validated the SRSCUD using a mean (i.e., continuous) score. Further, two additional variables were created using the SRSCUD to reflect how CUD symptoms/presence have been assessed in prior research that were entered as covariates in the incremental validity analyses. The SRSCUD items were dichotomized to reflect symptom presence such that 0 (not at all) and 1 (very little) on the 4-point scale were combined to indicate that the symptom was not present (0) and 2 (somewhat) and 3 (to a great extent) on the 4-point scale were combined to indicate that the symptom was present (1). The rationale for including very little to indicate that the symptom was not present was that this might not be a clinically meaningful manifestation of the symptom. The two tolerance and two withdrawal items were combined such that participants had to endorse one or both items for these symptoms to be present. These dichotomized items were 1) summed to create a CUD symptom count variable and 2) used to create a binary variable reflecting whether a participant endorsed two or more CUD symptoms (0 = no, 1 = yes), or the criterion for CUD.
Table 1.
Descriptive statistics and standardized factor loadings for the Self-Report Symptoms of Cannabis Use Disorder (SRSCUD)
| EFA (n = 1,011) | CFA (n = 1,012) | Full Sample (N = 2,023) | ||
|---|---|---|---|---|
|
| ||||
| Each item begin with the stem, “In the past month,” | λ | λ | M | SD |
| 1. Have you used marijuana in larger amounts or over a longer period than was intended? | 0.553 | 0.524 | 1.90 | 0.969 |
| 2. Have you had a persistent desire or tried unsuccessfully to cut down or control your marijuana use? | 0.655 | 0.672 | 1.57 | 0.860 |
| 3. Have you spent a great deal of time in activities necessary to obtain marijuana, use marijuana, or recover from its effects? | 0.709 | 0.715 | 1.53 | 0.804 |
| 4. Have you had a craving, or a strong desire or urge to use marijuana? | 0.588 | 0.546 | 1.89 | 0.957 |
| 5. Has your recurrent use of marijuana resulted in a failure to fulfill major role obligations at work, school, or home? | 0.801 | 0.801 | 1.34 | 0.666 |
| 6. Have you continued to use marijuana despite having persistent or recurrent social or interpersonal problems caused or exacerbated by the effects of marijuana? | 0.781 | 0.770 | 1.39 | 0.730 |
| 7. Have you given up or reduced important social, occupational, or recreational activities because of your marijuana use? | 0.805 | 0.830 | 1.33 | 0.663 |
| 8. Have you recurrently used marijuana in situations in which it is physically hazardous? | 0.751 | 0.774 | 1.29 | 0.649 |
| 9. Have you continued to use marijuana despite knowledge of having a persistent or recurrent physical or psychological problem that is likely to have been caused or exacerbated by marijuana? | 0.725 | 0.723 | 1.38 | 0.747 |
| 10. Have you had a need for markedly increased marijuana to achieve intoxication or desired effect? | 0.738 | 0.696 | 1.50 | 0.800 |
| 11. Have you had a markedly diminished effect with continued use of the same amount of the marijuana? | 0.732 | 0.699 | 1.52 | 0.794 |
| 12. Have you had any withdrawal symptoms, such as feeling sick when you cut down or stopped using marijuana? | 0.782 | 0.772 | 1.28 | 0.643 |
| 13. Have you taken marijuana to relieve or avoid withdrawal symptoms? | 0.772 | 0.740 | 1.32 | 0.695 |
Cannabis use and dependence severity
Consistent with the planned missingness design to minimize participant burden, participants were randomly assigned to complete one of the following three measures given that each assesses cannabis use/dependence severity: 8-item Cannabis Use Disorder Identification Test-Revised (CUDIT-R; Adamson et al., 2010, n = 632), 5-item Severity of Dependence Scale (SDS; Gossop et al., 1995, n = 712), or 6-item Cannabis Abuse Screening Test (CAST; Legleye et al., 2007, n = 679). We created continuous indicators of CUD symptoms by averaging the SDS (Gossop et al., 1995) and CAST (Legleye et al., 2007) and summing the CUDIT-R (Adamson et al., 2010). For the CUDIT-R, we also dichotomized scores of 13 or above as indicating probable CUD for the purpose of conducting ROC curve analyses (Adamson et al., 2010; Bruno et al., 2013; Bonn-Miller et al., 2016; Haug et al., 2017).
Cannabis use.
The Marijuana Use Grid (MUG; Pearson, 2020) was used to assess cannabis use during the past month. A visual depiction of amounts of loose cannabis flower (up to one ounce) as well as cannabis cigarettes (up to two grams) was provided to participants before completing the MUG. The MUG is based on the Daily Drinking Questionnaire (DDQ; Collins, Parks, & Marlatt, 1985) for alcohol use in that participants report their cannabis use in a week-long calendar (Monday-Sunday) representing a typical week in the past month. Specifically, participants are instructed to report the times (six, 4-hour blocks of time [12a-4a, 4a-8a, 8a-12p, 12p-4p, 4p-8p, 8p-12a]) per day they used cannabis, and within those times, the approximate number of grams of cannabis used. These data were used to compute frequency (i.e., counting all non-zero values) and quantity (i.e., summing number of grams) of cannabis use for a typical week. Every past-month cannabis user completed the MUG.
Negative cannabis-related consequences.
The Brief-Marijuana Consequences Questionnaire (B-MACQ; Simons et al., 2012) was used to assess negative cannabis-related consequences experienced over the past month. The 21 items (e.g., “I have driven a car when I was high”) are responded to on a dichotomous scale (0 = no, 1 = yes). The B-MACQ items have been shown to be unidimensional and thus a total score is computed representing the number of negative cannabis-related consequences experienced over the past month (Simons et al., 2012). Every past-month cannabis user completed the B-MACQ.
Protective and risk factors.
Coping motives, a known risk factor for cannabis use, was assessed using a 25-item marijuana motives questionnaire (Simons et al., 1998). Psychometric studies provide support for the reliability and validity of this measure (Simons et al., 1998). Protective behavioral strategies, a known protective factor for cannabis use, was assessed using the 17-item Protective Behavioral Strategies for Marijuana Scale (PBSM; Pedersen et al., 2016; revised by Pedersen et al., 2017). These 17 items have been found to be unidimensional, reliable, factorial invariant across socio-demographic groups, and negatively associated with cannabis use and related problems among college students (Pedersen et al., 2017).
Data Analysis
The data were randomly split into two halves for the factor analyses. The first split half (n = 1,038) sample was used for exploratory factor analysis (EFA) and the second split half sample (n = 1,039) was used for confirmatory factor analysis (CFA).
EFA.
The EFA was conducted in Mplus 8.3 (Muthén & Muthén, 1998–2019) using maximum likelihood estimation with robust standard errors (MLR) and oblique geomin rotation. We conducted an accompanying parallel analysis (Horn, 1965) which computes mean eigenvalues based on (50) randomly generated data sets. The number of factors retained is based on the factor for which the sample eigenvalue no longer exceeds its respective random eigenvalue. For example, if the second sample eigenvalue exceeds the second random eigenvalue, but the third sample eigenvalue does not exceed the third random eigenvalue, then the first two factors are retained.
CFA.
Similarly, the CFA was conducted in Mplus using MLR, and the number of factors specified was based on the results of the EFA, which was hypothesized to be a single common factor. The factor loadings were freely estimated, and the latent variable(s) was given a metric by setting the factor variance(s) to one. Additionally, if a single common factor was supported by the EFA and then subsequently tested using CFA, we planned to estimate correlated errors between the two indicators of tolerance (items 10 and 11) and the two indicators of withdrawal (items 12 and 13). Model fit was assessed using joint criteria proposed by Hu and Bentler (1999) for indices of global fit: CFI ≥ .95, RMSEA ≤ .06, and SRMR ≤ .08. Notably, others have recommended less strict values for CFI (e.g., CFI ≥ .90; Blackburn et al., 2004) and these recommendations were also considered in making determinations as to whether the models fit the data.
Reliability.
Reliability of the SRSCUD was estimated using McDonald’s coefficient omega (ω; McDonald, 1999), which was computed using the results of the CFA.
Measurement invariance.
A series of multigroup CFAs were conducted to test the measurement invariance of the SRSCUD using the same procedures as the single-group CFA described above. Measurement invariance was tested across age (< 21 years of age and ≥ 21 years of age), biological sex (male and female), ethnicity (Hispanic and non-Hispanic), race (White and all other racial groups [i.e., combined to form a single group]), and year in school (freshman, sophomore, junior, and senior). The following hierarchy was used to test for measurement invariance: configural, metric, and scalar invariance (Meredith, 1993). Configural invariance occurs when the pattern of factor loadings is the same across groups. Metric invariance occurs when the factor loadings do not statistically differ across groups. Scalar invariance occurs when the latent item intercepts do not statistically differ across groups. Configural invariance was assessed using the same global fit criteria described for the single-group CFAs. Metric and scalar invariance were assessed using conventions for changes in CFI and RMSEA that reflect a statistically trivial decrement in model fit from the less restrictive to the more restrictive model: a decrease in CFI < .01 (Cheung & Rensvold, 2002) and an increase in RMSEA < .015 (Chen, 2007). Scalar invariance must be met in order to make meaningful comparisons (i.e., mean differences) across groups.
Convergent and incremental validity.
Convergent validity was tested using data from the full sample (n = 2077) by computing the bivariate correlations for the SRSCUD scores with measures of dependence severity (i.e., CUDIT-R, SDS, and CAST scores), use of cannabis protective behavioral strategies, coping motives, and cannabis use frequency/quantity. Two sets of partial correlations were conducted to assess incremental validity testing the same associations described above while controlling for CUD symptom count and presence based on dichotomized SRSCUD items independently. Further, a receiver operating characteristic (ROC) curve was plotted to determine how well the SRSCUD could identify individuals who exceed the cutoffs for probable CUD based on the CUDIT-R (0–12 vs. 13+). We used the CUDIT-R as opposed to another measure of cannabis use/dependence severity because it is the most commonly used and most well-validated measure with relatively well-established cutoff scores (e.g., Schultz et al., 2019). We used the Youden index (sensitivity + specificity −1) to determine the cut-off score the SRSCUD that best distinguishes between those with and without probable CUD based on the CUDIT-R.
Results
Factor Analyses
The eigenvalues from the EFA and parallel analysis are presented in a scree plot (see Figure 1). As shown, a one-factor solution was supported as the sample eigenvalue was less than the random eigenvalue for the second factor. This first factor accounted for 56.33% of the variance in the items. Further, all items loaded saliently on the single common factor (see Table 1; .553 = λ = 805).
Figure 1.
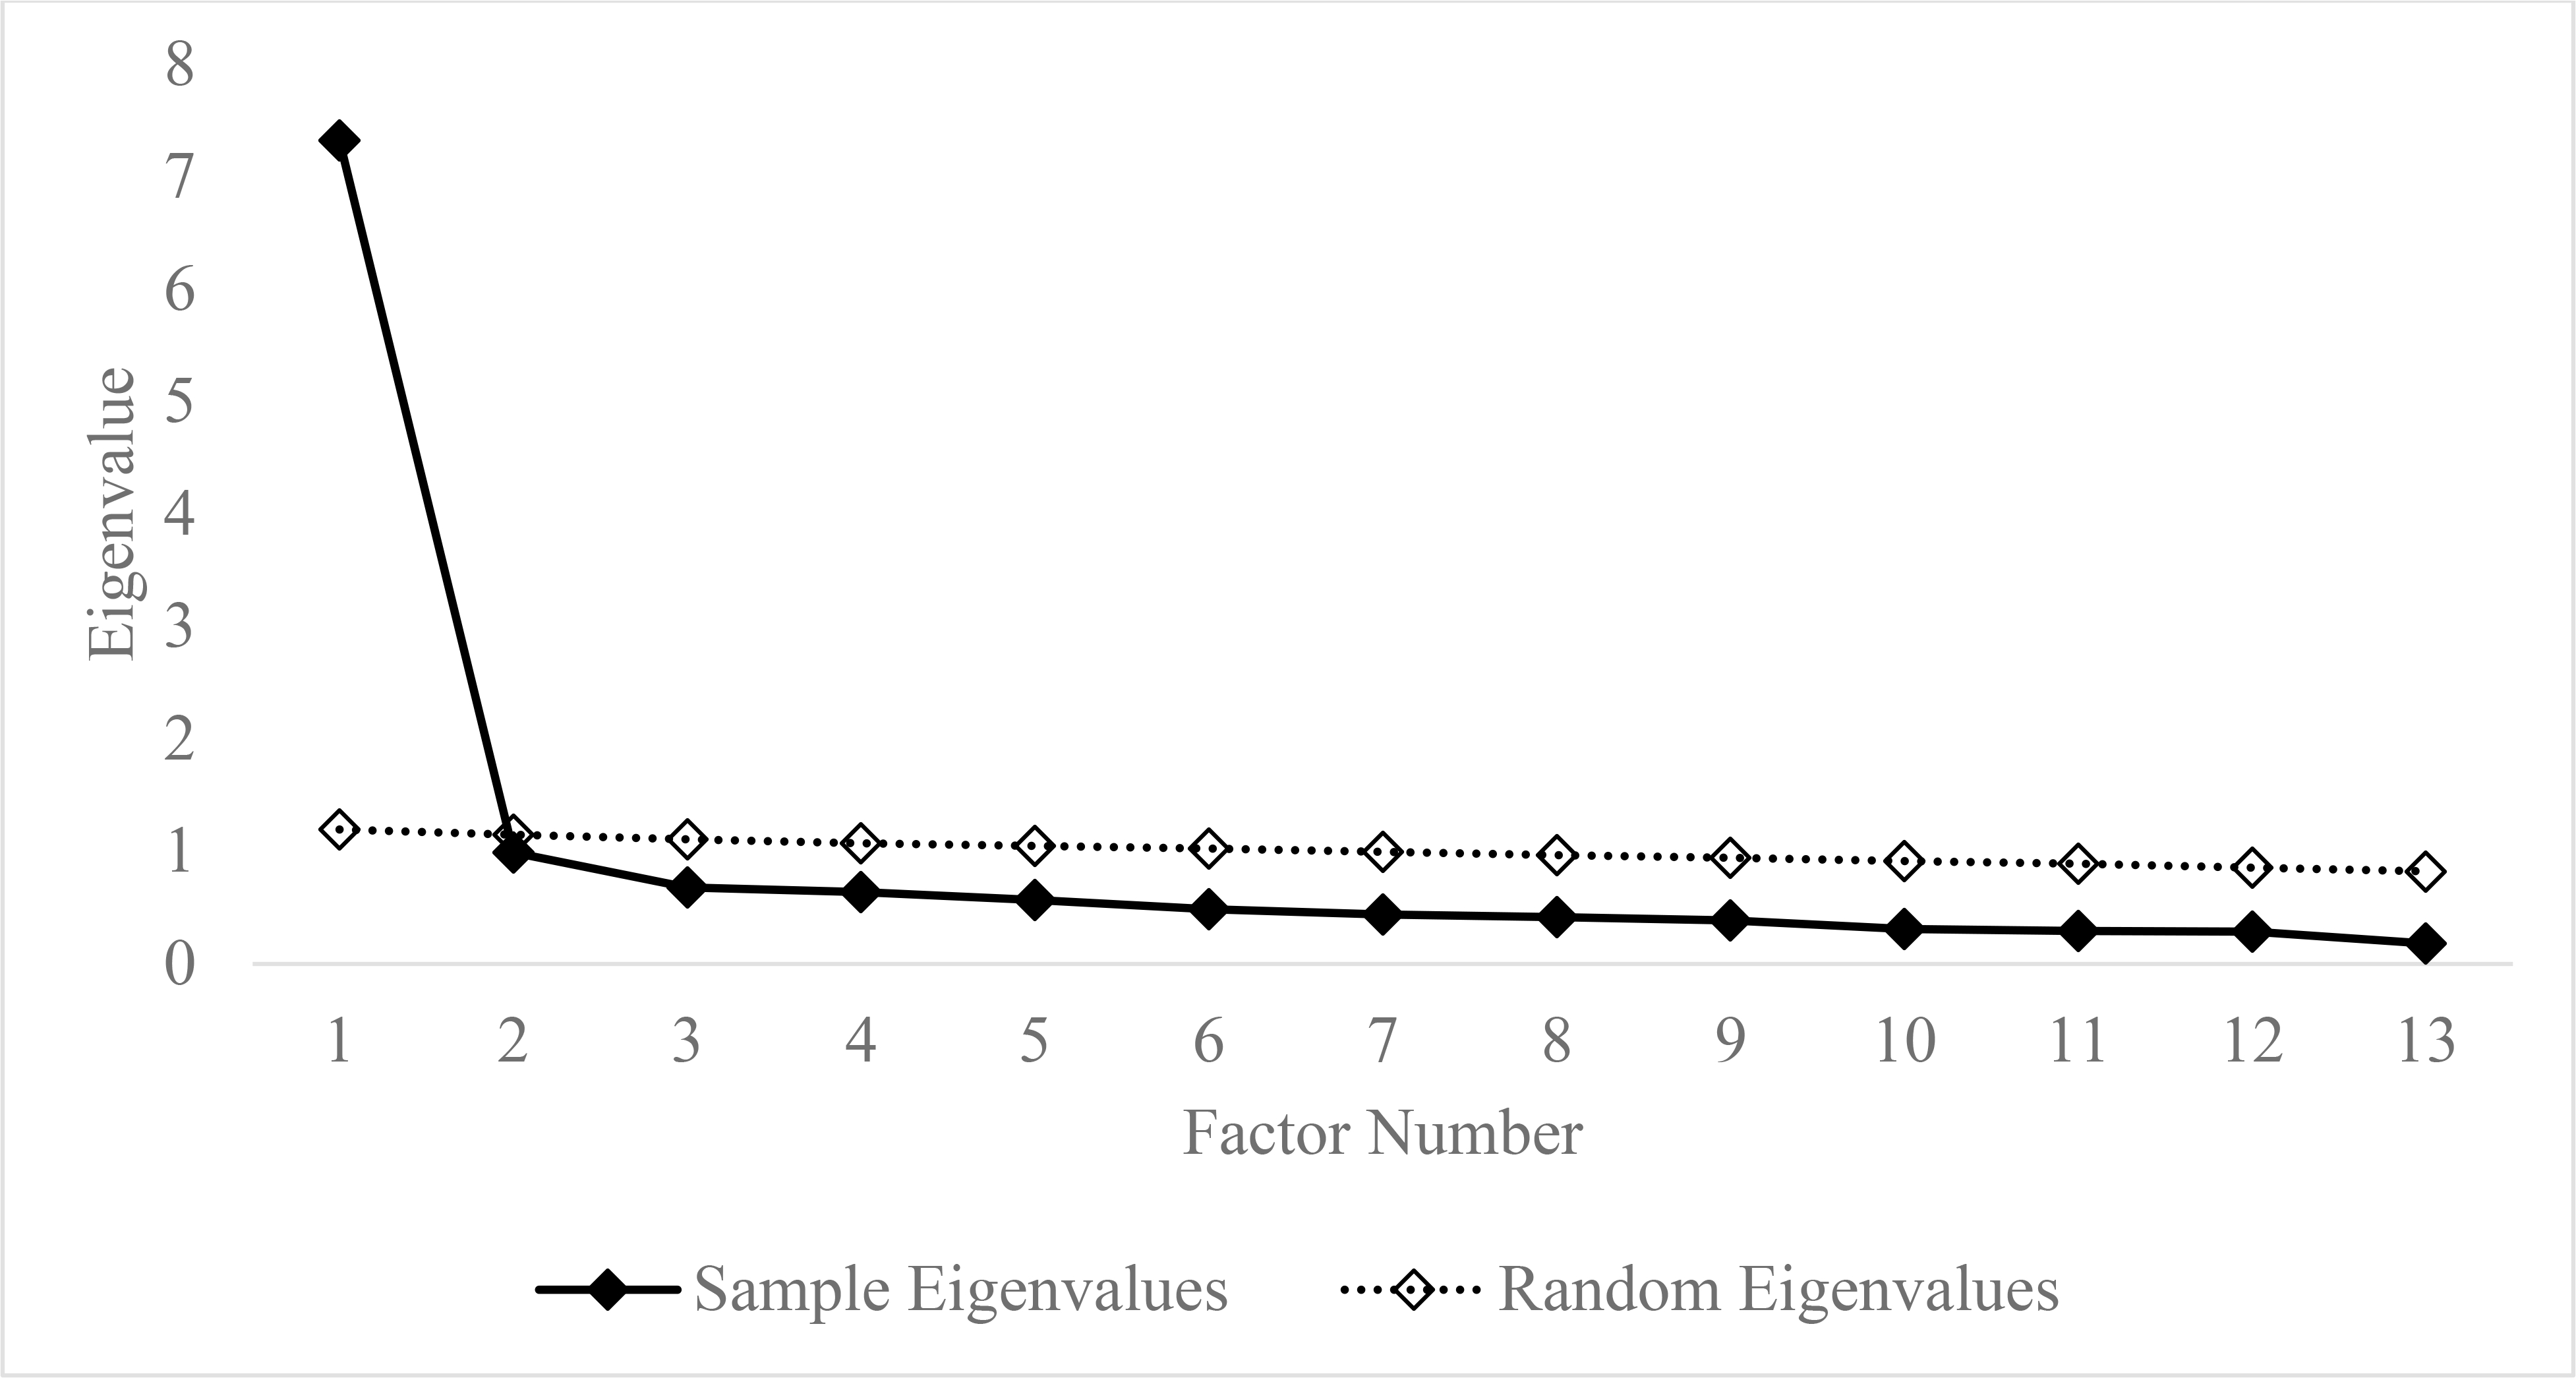
Scree plot of the eigenvalues of the exploratory factor analysis of the Self-Reported Symptoms of Cannabis Use Disorder and eigenvalues of the accompanying parallel analysis.
The CFA of the one-factor model with the two correlated error terms provided an acceptable fit to the data: SB χ2 (63, N = 1,012) = 282.53, p < .0001; CFI = .941; RMSEA = .059, 90% CI (.052, .066); SRMR = .042. All items loaded saliently (.524 = λ = .830) onto the common factor (see Table 1). The correlation of the errors for Items 10 and 11 was .317 and for Items 12 and 13 was .467 (both ps < .001).
Together, the results of the EFA and CFA support the factor validity of the SRSCUD.
Reliability
The SRSCUD items yielded a ω of 0.92 indicating good reliability.
Measurement Invariance
Results of the measurement invariance testing are provided in Table 2. As shown, we found support for scalar invariance across each group suggesting that the SRSCUD is equivalent across these groups, and thus we are able to interpret mean differences as reflective of true differences on the latent construct rather than measurement artifact. We found that females (M = 0.41, SD = 0.52) reported lower CUD symptoms than males (M = 0.60, SD = 0.63), t(2011) = 7.65, p < .001; White participants (M = 0.46, SD = 0.54) reported lower CUD symptoms than the group reflecting all other racial groups participants (M = 0.53, SD = 0.63), t(2002) = 2.33, p = .020; and differences in CUD symptoms among classes, F(3, 2011) = 4.74, p = .003, such that freshmen (M = 0.46, SD = 0.54) and juniors (M = 0.44, SD = 0.53) reported lower CUD symptoms than sophomores (M = 0.57, SD = 0.65) (both ps < .05 for Tukey HSD tests).
Table 2.
Fit Statistics for Measurement Invariance Testing of the Self-Reported Symptoms of Cannabis Use Disorder
| Overall Model Fit Indices | Comparing Model Fit Indices | |||||||||||
|---|---|---|---|---|---|---|---|---|---|---|---|---|
|
| ||||||||||||
| 90% CI RMSEA | ||||||||||||
|
| ||||||||||||
| Age | X 2 | df | p | RMSEA | LB | UB | CFI | TLI | SRMR | ΔCFI | ΔRMSEA | |
|
| ||||||||||||
| 1. Configural | 511.56 | 126 | <.001 | .057 | .052 | .062 | .946 | .933 | .042 | |||
| 2. Metric | 541.26 | 138 | <.001 | .055 | .051 | .060 | .944 | .936 | .046 | 1 vs. 2 | −.002 | −.002 |
| 3 . Scalar | 584.41 | 150 | <.001 | .055 | .051 | .060 | .939 | .937 | .048 | 2 vs. 3 | −.005 | .000 |
|
| ||||||||||||
| 90% CI RMSEA | ||||||||||||
|
| ||||||||||||
| Gender | X 2 | df | p | RMSEA | LB | UB | CFI | TLI | SRMR | ΔCFI | ΔRMSEA | |
|
| ||||||||||||
| 1. Configural | 528.71 | 126 | <.001 | .056 | .051 | .061 | .947 | .934 | .041 | |||
| 2. Metric | 565.46 | 138 | <.001 | .055 | .051 | .060 | .944 | .936 | .048 | 1 vs. 2 | −.003 | −.001 |
| 3 . Scalar | 612.41 | 150 | <.001 | .055 | .051 | .060 | .939 | .937 | .049 | 2 vs. 3 | −.005 | .000 |
|
| ||||||||||||
| 90% CI RMSEA | ||||||||||||
|
| ||||||||||||
| Ethnicity | X 2 | df | p | RMSEA | LB | UB | CFI | TLI | SRMR | ΔCFI | ΔRMSEA | |
|
| ||||||||||||
| 1. Configural | 542.52 | 126 | <.001 | .057 | .052 | .062 | .947 | .934 | .040 | |||
| 2. Metric | 559.43 | 138 | <.001 | .055 | .050 | .060 | .946 | .939 | .042 | 1 vs. 2 | −.001 | −.002 |
| 3 . Scalar | 586.71 | 150 | <.001 | .054 | .049 | .058 | .944 | .942 | .042 | 2 vs. 3 | −.002 | −.001 |
|
| ||||||||||||
| 90% CI RMSEA | ||||||||||||
|
| ||||||||||||
| Race | X 2 | df | p | RMSEA | LB | UB | CFI | TLI | SRMR | ΔCFI | ΔRMSEA | |
|
| ||||||||||||
| 1. Configural | 523.81 | 126 | <.001 | .056 | .051 | .061 | .948 | .936 | .040 | |||
| 2. Metric | 551.09 | 138 | <.001 | .055 | .050 | .059 | .946 | .939 | .044 | 1 vs. 2 | −.002 | −.001 |
| 3 . Scalar | 595.75 | 150 | <.001 | .054 | .050 | .059 | .942 | .939 | .044 | 2 vs. 3 | −.004 | −.001 |
|
| ||||||||||||
| 90% CI RMSEA | ||||||||||||
|
| ||||||||||||
| Year in School | X 2 | df | p | RMSEA | LB | UB | CFI | TLI | SRMR | ΔCFI | ΔRMSEA | |
|
| ||||||||||||
| 1. Configural | 650.14 | 252 | <.001 | .056 | .051 | .061 | .949 | .937 | .043 | |||
| 2. Metric | 691.7 | 288 | <.001 | .053 | .048 | .058 | .948 | .944 | .048 | 1 vs. 2 | −.001 | −.003 |
| 3. Scalar | 757.24 | 324 | <.001 | .052 | .047 | .056 | .944 | .946 | .049 | 2 vs. 3 | −.004 | −.001 |
Bivariate and partial correlations.
As shown in Table 3, the total score of the SRSCUD was strongly correlated with other cannabis use severity/CUD symptoms measures (.617 < rs < .697). The SRSCUD also demonstrated a moderate positive correlation with coping motives and a moderate negative correlation with cannabis protective behavioral strategies use as well as a moderate positive correlation with marijuana use frequency and a small positive correlation with marijuana use quantity. The results of the correlation analyses support the convergent validity of the SRSCUD. Further, supporting the incremental validity of the SRSCUD over previous scoring methods, all but one of these correlations (cannabis quantity) remained statistically significant while independently controlling for CUD symptom count and presence based on dichotomized SRSCUD items (see Table 3).
Table 3.
Bivariate and partial correlations between the Self-Report Symptoms of Cannabis Use Disorder (SRSCUD) and the other study variables
| Bivariate correlations | r | p | n |
|
| |||
| CUDIT-R | 0.697 | <0.001 | 632 |
| SDS | 0.617 | <0.001 | 712 |
| CAST | 0.624 | <0.001 | 678 |
| B-MACQ | 0.496 | <0.001 | 2021 |
| Cannabis PBS | −0.382 | <0.001 | 2021 |
| Coping Motives | 0.475 | <0.001 | 2016 |
| Cannabis Frequency | 0.351 | <0.001 | 2023 |
| Cannabis Quantity | 0.102 | <0.001 | 2023 |
|
| |||
| Partial correlations controlling for CUD symptom count | r | p | n |
|
| |||
| CUDIT-R | 0.343 | <0.001 | 632 |
| SDS | 0.183 | <0.001 | 712 |
| CAST | 0.337 | <0.001 | 678 |
| B-MACQ | 0.277 | <0.001 | 2021 |
| Cannabis PBS | −0.231 | <0.001 | 2021 |
| Coping Motives | 0.228 | <0.001 | 2016 |
| Cannabis Frequency | 0.167 | <0.001 | 2023 |
| Cannabis Quantity | 0.041 | 0.067 | 2023 |
|
| |||
| Partial correlations controlling for CUD presence | r | p | n |
|
| |||
| CUDIT-R | 0.457 | <0.001 | 632 |
| SDS | 0.480 | <0.001 | 712 |
| CAST | 0.461 | <0.001 | 678 |
| B-MACQ | 0.252 | <0.001 | 2021 |
| Cannabis PBS | −0.197 | <0.001 | 2021 |
| Coping Motives | 0.287 | <0.001 | 2016 |
| Cannabis Frequency | 0.141 | <0.001 | 2023 |
| Cannabis Quantity | 0.053 | 0.017 | 2023 |
Note. CUDIT-R = Cannabis Use Disorder Identification Test-Revised, SDS = Severity of Dependence Scale, CAST = Cannabis Abuse Screening Test, B-MACQ = Brief-Marijuana Consequences Questionnaire, PBS = Protective behavioral strategies.
ROC/AUC.
Table 4 presents the results of the ROC curve analysis. The area under the curve was .905, indicating excellent accuracy in detecting probable CUD determined by the CUDIT-R suggesting further support for convergent validity. At a cutoff of 0.5 on the average score (or 6.5 on the sum score), the SRSCUD had excellent sensitivity (.866) and specificity (.827).
Table 4.
Receiver Operator Characteristic (ROC) Curve Analyses Demonstrating Sensitivity and Specificity at Various Cut-Offs of the SRSCUD Scores.
| SRSCUD Averaged Score | SRSCUD Summed Score | Sensitivity | Specificity | Youden Index (J) |
|---|---|---|---|---|
| 0.04 | 0.50 | 0.985 | 0.315 | 0.300 |
| 0.12 | 1.50 | 0.985 | 0.430 | 0.415 |
| 0.16 | 2.08 | 0.970 | 0.564 | 0.534 |
| 0.20 | 2.58 | 0.963 | 0.566 | 0.529 |
| 0.24 | 3.13 | 0.940 | 0.663 | 0.603 |
| 0.28 | 3.63 | 0.940 | 0.665 | 0.605 |
| 0.35 | 4.50 | 0.918 | 0.729 | 0.647 |
| 0.40 | 5.21 | 0.888 | 0.779 | 0.667 |
| 0.44 | 5.71 | 0.888 | 0.783 | 0.671 |
| 0.50 | 6.50 | 0.866 | 0.827 | 0.693 |
| 0.58 | 7.50 | 0.813 | 0.851 | 0.665 |
| 0.64 | 8.33 | 0.791 | 0.871 | 0.663 |
| 0.68 | 8.83 | 0.791 | 0.873 | 0.665 |
| 0.73 | 9.50 | 0.731 | 0.900 | 0.631 |
| 0.80 | 10.42 | 0.701 | 0.910 | 0.611 |
| 0.84 | 10.92 | 0.701 | 0.912 | 0.613 |
| 0.88 | 11.50 | 0.649 | 0.928 | 0.577 |
| 0.96 | 12.50 | 0.604 | 0.936 | 0.540 |
| 1.04 | 13.50 | 0.500 | 0.956 | 0.456 |
Note. SRSCUD = Self-Reported Symptoms of Cannabis Use Disorder.
Discussion
We sought to extend the measurement of CUD symptomatology among college students by creating a measure with items based on DSM-5 criteria for CUD that are assessed using a continuous rather than dichotomous scale. Our goal in developing a continuous measure of CUD symptomatology, which we deemed the SRSCUD, is that it would demonstrate improved sensitivity to aid research attempting to understand the psychological and behavioral influences on the etiology of CUD. Better understanding of the etiology of CUD can contribute to the development of novel interventions and the refinement of existing interventions for CUD among college students.
As hypothesized, the results of factor analyses strongly supported the unidimensionality of the SRSCUD as a single-common factor model provided good fit to the data with all items loading saliently onto a factor representing CUD. Although all items loaded saliently, the lowest loadings were for Items 1 and 4, which assessed the longer/larger criterion and craving, respectively. Although both are key symptoms of CUD, they were endorsed at higher rates than the other symptoms. In item response theory terminology, these items had lower item difficulties, which is related to lower item discrimination (i.e., factor loadings). Notably, the one-factor solution provided a good fit to the data when estimating the correlations between the residual variances of Items 10 and 11 and Items 12 and 13, which was expected given that these item pairs reflect different manifestations of same symptoms, tolerance and withdrawal, respectively, and thus have something in common beyond CUD. The items of the SRSCUD were also found to be highly reliable. Together, these findings suggest that items assessing DSM-5 CUD symptoms on a continuous scale of severity reflect a common construct of CUD and are highly reliable. That said, our results do not suggest that CUD itself is a unidimensional construct. Addictive disorders have been conceptualized as multidimensional (e.g., Kwako et al., 2016), but the purpose of the present study was not to develop a measure to assess each of the proposed facets of CUD.
Importantly, multi-group CFAs supported the measurement invariance of the SRSCUD across several socio-demographic groups. These findings suggest that, across diverse groups of college students, the SRSCUD items are interpreted similarly and can be used to make meaningful comparisons in CUD symptomatology. That said, we found that females reported significantly fewer CUD symptoms than males, which is consistent with national surveys showing that more males (3.5%) than females (1.7%) meet the criteria for past-year CUD (Kerridge et al., 2018). We also found that freshman and juniors reported significantly fewer CUD symptoms than sophomores. No other group differences were found suggesting that severity of CUD symptomatology is consistent across these groups.
The SRSCUD was strongly and positively correlated with measures of cannabis use and dependence severity, moderately and positively correlated with negative cannabis-related consequences, moderately and positively correlated with cannabis use frequency, and weakly and positively correlated with cannabis use quantity. Additionally, the correlations of the SRSCUD with risk/protective factors of CUD were of medium effect size and in the expected directions. That is, greater endorsement of coping motives was associated with more severe CUD symptoms and more frequent use of PBS was associated with less severe CUD symptoms. These correlations are consistent with the expected associations between CUD symptom severity and cannabis-related outcomes, suggesting that the SRSCUD is a valid to measure of CUD symptoms to use with college students. Most importantly, all but one of these correlations remained statistically significant, and were of small-to-medium effect size, when controlling for variables used in prior research to assess CUD symptomatology (i.e., CUD symptom count and presence based on dichotomous items). Only the partial correlation between the SRSCUD and cannabis quantity while controlling CUD symptom count was not statistically significant. However, this was the weakest bivariate correlation and there are known challenges to assessing cannabis quantity (Prince et al., 2018). Overall, the results of these partial correlations suggest that the SRSCUD is associated with cannabis-related outcomes beyond typical methods used to assess CUD symptomatology and may indeed be useful for future research.
As powerfully demonstrated by Cohen (1983), dichotomizing a continuous variable can result in substantial reductions in statistical power. DeCoster et al. (2009) demonstrated that dichotomous variables perform well when the underlying distribution of the variable is strongly categorical, the proportion of individuals assigned to each category match the proportions found in the latent distribution, and the continuous measure being dichotomized is highly reliable. DeCoster and colleagues demonstrated that “violating any of these three criteria caused the dichotomized indicator to perform notably worse than the original continuous indicator” (pp. 363–364). In the case of CUD symptoms, a simple examination of the distribution of symptoms does not support a “strongly categorical” distribution. Therefore, we assert that a continuous measure of CUD symptoms like the SRSCUD will enhance statistical power to detect etiological pathways to CUD. As demonstrated in the incremental validity analyses, this continuous symptom measure was significantly related to a wide range of cannabis-related outcomes when controlling for CUD symptom counts or a binary variable separating those with and without probable CUD. Thus, we demonstrated empirically the added value of a continuous measure of CUD symptoms.
Limitations
Several limitations of the present study should be considered in evaluating support for the SRSCUD. Although the sample was large and relatively diverse given recruitment from nine sites, convenience sampling was used at each site and therefore the generalizability of the psychometric properties of the SRSCUD to the United States college student population is unknown. Future work is needed to replicate these findings among other samples. Also, the data were cross-sectional, limiting causal inference and the ability to test important psychometric properties of the SRSCUD (e.g., predictive validity). Longitudinal studies evaluating the SRSCUD are needed. Although we found evidence of good psychometric properties, there are important limitations to our psychometric testing. Research has shown that substance use disorder criteria are not equally severe (e.g., Boness et al., 2019; Lane et al., 2016), which complicates the use of a total score as we used for the validation analyses. One proposed method for addressing this is the use of factor scores derived from Item Response Theory analyses (Dawson & Grant, 2010), but it is unclear whether this method improves the assessment of substance use disorder symptomatology (Boness et al., 2019). Although we recommend against dichotomizing continuous CUD symptom measures, receiver operator characteristic curve analyses suggested that the SRSCUD measure had excellent sensitivity and specificity in detecting probable CUD based on the CUDIT-R. However, additional work is needed to validate the SRSCUD against more intensive, structured clinical interviews (e.g., First et al., 2016) rather than other self-report measures. Overall, the present study provides initial support for desirable psychometric properties of the SRSCUD, and future studies are needed to test potential benefits of such a continuous scale and validity compared to clinical diagnoses.
Conclusion
Given the prevalence of cannabis use among college students and associated negative consequences, a measure of the severity of CUD symptoms as opposed to a binary measure of presence/absence of CUD may have advantages for examining risk/protective factors for CUD in an effort to develop preventions/interventions. In other words, the SRSCUD may be a more sensitive outcome measure for research compared to dichotomized symptom counts which is timely as there have been recent calls to improve the outcome used measures in CUD intervention trials (Lee et al., 2019; Loflin et al., 2020). Better understanding the severity of symptoms using the SRSCUD may also have clinical utility as treatment could focus on the most severe symptoms. The desirable psychometric properties of the SRSCUD found in the present study warrants future research evaluating the SRSCUD, including studies among other populations, longitudinal studies, and studies comparing SRSCUD scores with clinical diagnosis of CUD.
Public significance statement:
The present study found initial support for a self-report measure that assesses the degree of severity of cannabis use disorder symptoms described by the DSM-5. This novel measure may aid researchers in identifying protective and risk factors for cannabis use disorder, which, in turn, may inform the development of prevention, intervention, and treatment programs for cannabis use disorder.
Acknowledgments
DKR is supported by an individual training grant (F32-AA028712) from the National Institute on Alcohol Abuse and Alcoholism (NIAAA). FJS is supported by an institutional training grant (T32-AA018108) from the NIAAA. MRP is supported by a career development grant (K01-AA023233) from the NIAAA. NIAAA had no role in the study design, collection, analysis or interpretation of the data, writing the manuscript, or the decision to submit the paper for publication.
Footnotes
We have no conflicts of interest to disclose.
References
- Adamson SJ, Kay-Lambkin FJ, Baker AL, Lewin TJ, Thornton L, Kelly BJ, & Sellman JD (2010). An improved brief measure of cannabis misuse: The Cannabis Use Disorders Identification Test-Revised (CUDIT-R). Drug and Alcohol Dependence, 110, 137–143. [DOI] [PubMed] [Google Scholar]
- American Psychiatric Association (APA). (2013). Diagnostic and statistical manual of mental disorders (5th ed.). Washington, DC: Author. [Google Scholar]
- Blackburn R, Donnelly JP, Logan C, & Renwick SJ (2004). Convergent and discriminative validity of interview and questionnaire measures of personality disorder in mentally disordered offenders: A multitrait-multimethod analysis using confirmatory factor analysis. Journal of Personality Disorders, 18, 129–150. [DOI] [PubMed] [Google Scholar]
- Boness CL, Lane SP, & Sher KJ (2019). Not all alcohol use disorder criteria are equally severe: Toward severity grading of individual criteria in college drinkers. Psychology of Addictive Behaviors, 33, 35–49. [DOI] [PMC free article] [PubMed] [Google Scholar]
- Bonn-Miller MO, Heinz AJ, Smith EV, Bruno R, & Adamson S (2016). Preliminary development of a brief cannabis use disorder screening tool: the cannabis use disorder identification test short-form. Cannabis and Cannabinoid Research, 1, 252–261. [DOI] [PMC free article] [PubMed] [Google Scholar]
- Bruno R, Marshall S, & Adamson S (2013, November). Screening for DSM-5 cannabis dependence using the Cannabis Use Identification Test-Revised (CUDIT-R). Australasian Professional Society on Alcohol and other Drugs, Brisbane, Australia. [Google Scholar]
- Chen FF (2007). Sensitivity of goodness of fit indexes to lack of measurement invariance. Structural Equation Modeling: A Multidisciplinary Journal, 14, 464–504. [Google Scholar]
- Cheung GW, & Rensvold RB (2002). Evaluating goodness-of-fit indexes for testing measurement invariance. Structural Equation Modeling, 9, 233–255. [Google Scholar]
- Cohen J (1983). The cost of dichotomization. Applied Psychological Measurement, 7(3), 249–253. [Google Scholar]
- Collins RL, Parks GA, & Marlatt GA (1985). Social determinants of alcohol consumption: the effects of social interaction and model status on the self-administration of alcohol. Journal of Consulting and Clinical Psychology, 53, 189–200. [DOI] [PubMed] [Google Scholar]
- Curran HV, Hindocha C, Morgan CJ, Shaban N, Das RK, & Freeman TP (2019). Which biological and self-report measures of cannabis use predict cannabis dependency and acute psychotic-like effects? Psychological Medicine, 49, 1574–1580. [DOI] [PMC free article] [PubMed] [Google Scholar]
- Dawson DA, & Grant BF (2010). Should symptom frequency be factored into scalar measures of alcohol use disorder severity? Addiction, 105, 1568–1579. [DOI] [PubMed] [Google Scholar]
- DeCoster J, Iselin AMR, & Gallucci M (2009). A conceptual and empirical examination of justifications for dichotomization. Psychological Methods, 14(4), 349–366. [DOI] [PubMed] [Google Scholar]
- First MB, Williams JB, Karg RS, & Spitzer RL (2016). User’s guide for the SCID-5-CV Structured Clinical Interview for DSM-5® disorders: Clinical version. American Psychiatric Publishing, Inc.. [Google Scholar]
- Foster KT, Arterberry BJ, Iacono WG, McGue M, & Hicks BM (2018). Psychosocial functioning among regular cannabis users with and without cannabis use disorder. Psychological Medicine, 48, 1853–1861. [DOI] [PMC free article] [PubMed] [Google Scholar]
- Gossop M, Darke S, Griffiths P, Hando J, Powis B, Hall W, & Strang J (1995). The Severity of Dependence Scale (SDS): psychometric properties of the SDS in English and Australian samples of heroin, cocaine and amphetamine users. Addiction, 90, 607–614. [DOI] [PubMed] [Google Scholar]
- Haug NA, Padula CB, Sottile JE, Vandrey R, Heinz AJ, & Bonn-Miller MO (2017). Cannabis use patterns and motives: a comparison of younger, middle-aged, and older medical cannabis dispensary patients. Addictive Behaviors, 72, 14–20. [DOI] [PMC free article] [PubMed] [Google Scholar]
- Horn JL (1965). A rationale and test for the number of factors in factor analysis. Psychometrika, 30, 179–185. [DOI] [PubMed] [Google Scholar]
- Hu LT, & Bentler PM (1999). Cutoff criteria for fit indexes in covariance structure analysis: Conventional criteria versus new alternatives. Structural Equation Modeling: A Multidisciplinary Journal, 6, 1–55. [Google Scholar]
- Insel T, Cuthbert B, Garvey M, Heinssen R, Pine DS, Quinn K, ... & Wang P (2010). Research domain criteria (RDoC): Toward a new classification framework for research on mental disorders. American Journal of Psychiatry, 167, 748–751. [DOI] [PubMed] [Google Scholar]
- Kerridge BT, Pickering R, Chou P, Saha TD, & Hasin DS (2018). DSM-5 cannabis use disorder in the National Epidemiologic Survey on Alcohol and Related Conditions-III: Gender-specific profiles. Addictive Behaviors, 76, 52–60. [DOI] [PubMed] [Google Scholar]
- Kwako LE, Momenan R, Litten RZ, Koob GF, & Goldman D (2016). Addictions neuroclinical assessment: a neuroscience-based framework for addictive disorders. Biological Psychiatry, 80, 179–189. [DOI] [PMC free article] [PubMed] [Google Scholar]
- Lane SP, Steinley D, & Sher KJ (2016). Meta-analysis of DSM alcohol use disorder criteria severities: Structural consistency is only ‘skin deep’. Psychological Medicine, 46, 1769–1784. [DOI] [PMC free article] [PubMed] [Google Scholar]
- Leadbeater BJ, Ames ME, & Linden-Carmichael AN (2019). Age-varying effects of cannabis use frequency and disorder on symptoms of psychosis, depression and anxiety in adolescents and adults. Addiction, 114, 278–293. [DOI] [PMC free article] [PubMed] [Google Scholar]
- Lee DC, Schlienz NJ, Peters EN, Dworkin RH, Turk DC, Strain EC, & Vandrey R (2019). Systematic review of outcome domains and measures used in psychosocial and pharmacological treatment trials for cannabis use disorder. Drug and Alcohol Dependence, 194, 500–517. [DOI] [PMC free article] [PubMed] [Google Scholar]
- Legleye S, Karila L, Beck F, & Reynaud M (2007). Validation of the CAST, a general population Cannabis Abuse Screening Test. Journal of Substance Use, 12, 233–242. [Google Scholar]
- Loflin MJ, Kiluk BD, Huestis MA, Aklin WM, Budney AJ, Carroll KM, ... & Strain EC (2020). The state of clinical outcome assessments for cannabis use disorder clinical trials: A review and research agenda. Drug and Alcohol Dependence, 212, 107993. [DOI] [PMC free article] [PubMed] [Google Scholar]
- Maisto SA, Conigliaro J, McNeil M, Kraemer K, & Kelley ME (2000). An empirical investigation of the factor structure of the AUDIT. Psychological Assessment, 12, 346–353. [DOI] [PubMed] [Google Scholar]
- McDonald RP (1999). Test theory: a unified treatment. Erlbaum. [Google Scholar]
- Meredith W (1993). Measurement invariance, factor analysis and factorial invariance. Psychometrika, 58, 525–543. [Google Scholar]
- Miech RA, Patrick ME, O’Malley PM, & Johnston LD (2017). The influence of college attendance on risk for marijuana initiation in the United States: 1977 to 2015. American Journal of Public Health, 107, 996–1002. [DOI] [PMC free article] [PubMed] [Google Scholar]
- Muthén LK, & Muthén BO (1998–2019). Mplus user’s guide (8th ed). Muthén & Muthén. [Google Scholar]
- Pearson MR, Liese BS, Dvorak RD, & Marijuana Outcomes Study Team. (2017). College student marijuana involvement: Perceptions, use, and consequences across 11 college campuses. Addictive Behaviors, 66, 83–89. [DOI] [PMC free article] [PubMed] [Google Scholar]
- Pearson MR, Marijuana Outcomes Study Team, & Protective Strategies Study Team. (2020). Marijuana use grid: A brief, comprehensive measure of cannabis use. Unpublished manuscript.
- Pedersen ER, Huang W, Dvorak RD, Prince MA, & Hummer JF (2017). The Protective Behavioral Strategies for Marijuana Scale: Further examination using item response theory. Psychology of Addictive Behaviors, 31, 548–559. [DOI] [PMC free article] [PubMed] [Google Scholar]
- Pedersen ER, Hummer JF, Rinker DV, Traylor ZK, & Neighbors C (2016). Measuring protective behavioral strategies for marijuana use among young adults. Journal of Studies on Alcohol and Drugs, 77, 441–450. [DOI] [PMC free article] [PubMed] [Google Scholar]
- Prince MA, Conner BT, & Pearson MR (2018). Quantifying cannabis: A field study of marijuana quantity estimation. Psychology of Addictive Behaviors, 32, 426–433. [DOI] [PMC free article] [PubMed] [Google Scholar]
- Rucker DD, McShane BB, & Preacher KJ (2015). A researcher’s guide to regression, discretization, and median splits of continuous variables. Journal of Consumer Psychology, 25, 666–678. [Google Scholar]
- Saunders JB, Aasland OG, Babor TF, De la Fuente JR, & Grant M (1993). Development of the alcohol use disorders identification test (AUDIT): WHO collaborative project on early detection of persons with harmful alcohol consumption-II. Addiction, 88, 791–804. [DOI] [PubMed] [Google Scholar]
- Schulenberg JE, Johnston LD, O’Malley PM, Bachman JG, Miech RA & Patrick ME (2020). Monitoring the Future national survey results on drug use, 1975–2019: Volume II, College students and adults ages 19–60. Ann Arbor: Institute for Social Research, The University of Michigan. Available at http://monitoringthefuture.org/pubs.html#monographs [Google Scholar]
- Schultz NR, Bassett DT, Messina BG, & Correia CJ (2019). Differential role of cannabis use motives in predicting impairment across three measures. Journal of Studies on Alcohol and Drugs, 80, 26–31. [PubMed] [Google Scholar]
- Simons J, Correia CJ, Carey KB, & Borsari BE (1998). Validating a five-factor marijuana motives measure: Relations with use, problems, and alcohol motives. Journal of Counseling Psychology, 45, 265–273. [Google Scholar]
- Simons JS, Dvorak RD, Merrill JE, & Read JP (2012). Dimensions and severity of marijuana consequences: Development and validation of the Marijuana Consequences Questionnaire (MACQ). Addictive Behaviors, 37, 613–621. [DOI] [PMC free article] [PubMed] [Google Scholar]