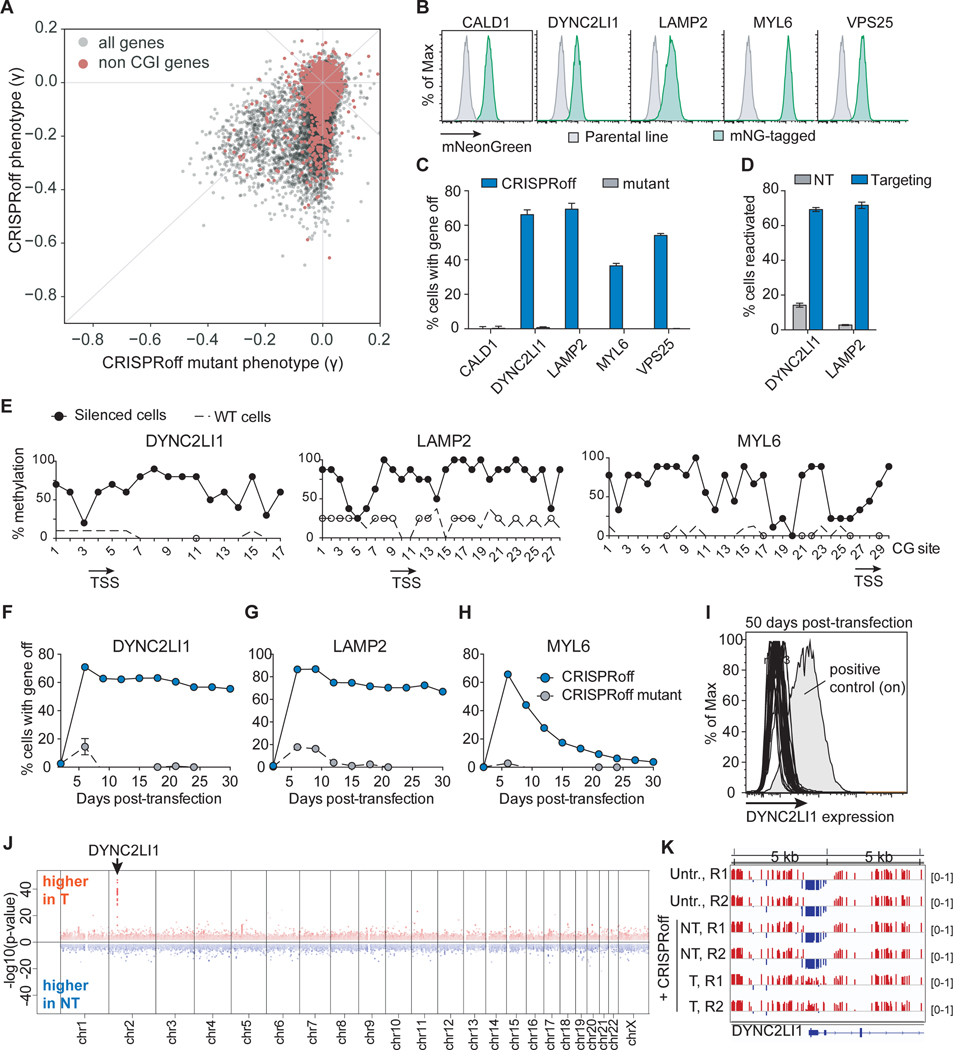
Figure 5. CRISPRoff-mediated silencing of genes without promoter CpG island annotations.
(A) A plot comparing the phenotype score of genes between the CRISPRoff and CRISPRoff mutant screens with genes that lack a CGI annotation highlighted in red.
(B) Histograms of mNeonGreen fluorescence of five HEK293T cell lines, each with the indicated gene endogenously tagged with split mNeonGreen.
(C) Quantification of cells with CALD1, DYNC2LI1, LAMP2, MYL6, or VPS25 silenced after CRISPRoff or CRISPRoff mutant treatment. The data were measured at 14 days p.t., except for VPS25 which was collected at 11 days p.t. due to a growth defect upon gene knockdown.
(D) Quantification of percent of cells with DYNC2LI1 or LAMP2 reactivated after TETv4 treatment with targeting or non-targeting sgRNAs, obtained at 14 days p.t.
(E) CpG methylation profiling within the LAMP2, DYNC2LI1, and MYL6 promoters after CRISPRoff treatments. White circles represent the CpG methylation status of untransfected HEK293T cells. Each dot is an average of eight independent clones.
(F, G, H) Time course plots of DYNC2LI1 (F), LAMP2 (G), and MYL6 (H) expression after transfection of either CRISPRoff or CRISPRoff mutant. Error bars represent the SD of three independent replicates.
(I) A histogram of DYNC2LI1 expression in 33 clonal lines, measured at 50 days p.t. A positive control of untransfected cells is labeled.
(J) A Manhattan plot displaying differentially methylated CpGs between cells treated with CRISPRoff and either DYNC2LI1-targeting or NT sgRNA, as analyzed by WGBS. The arrow points to the genomic location of DYNC2LI1.
(K) A view of a 10 kb genomic window containing the DYNC2LI1 locus, highlighting gain of CpG methylation (red) at the promoter in cells transfected with CRISPRoff and DYNC2LI1-targeting sgRNAs.

