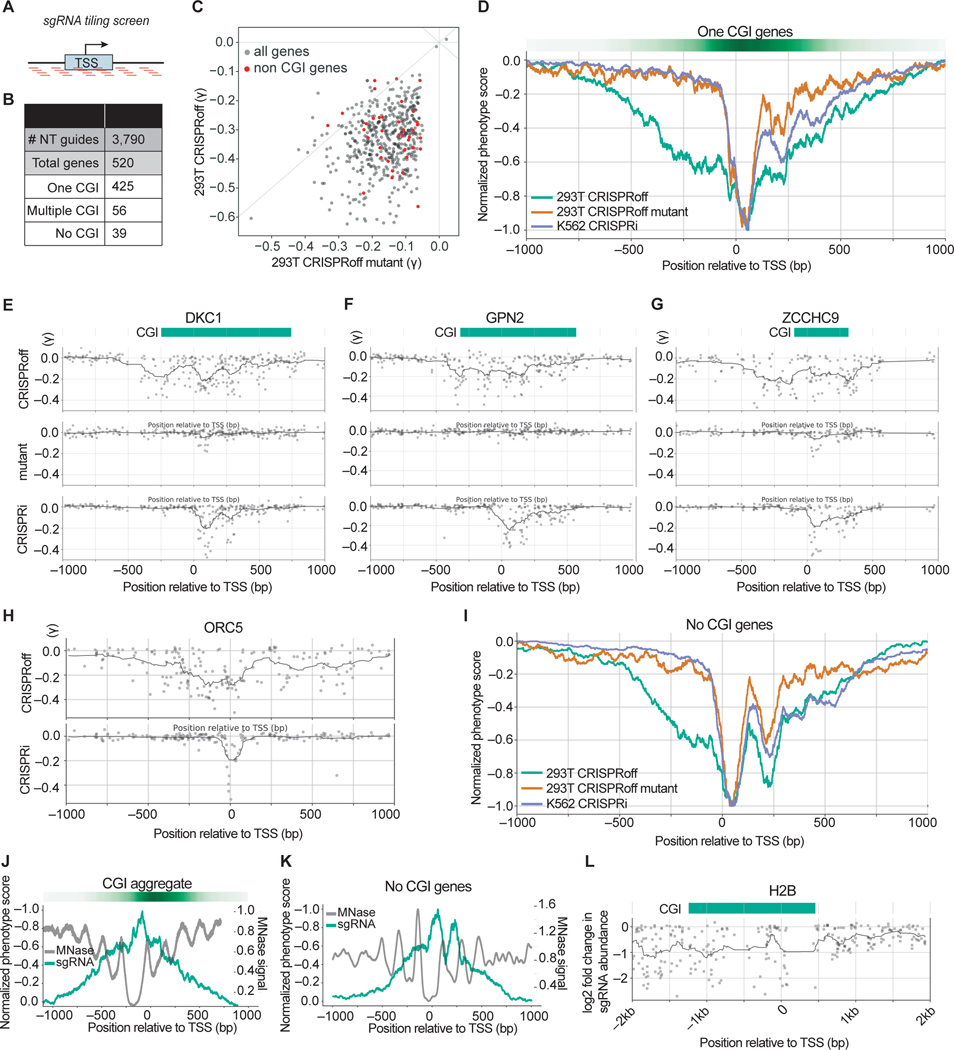
Figure 6. Pooled sgRNA tiling screens reveal a wide targetable window of CRISPRoff-mediated gene repression.
(A) A schematic of the sgRNA library that tiles PAM-containing sgRNAs within a +/− 1 kb window from annotated transcription start sites (TSS).
(B) A summary of the number of genes per indicated category that comprise the tiling sgRNA library.
(C) A comparison of the phenotype score (γ) for genes with annotated CGI between CRISPRoff (y-axis) and CRISPRoff mutant (x-axis). Each dot is the average of the three most active sgRNAs for each gene. The red dots highlight genes that lack a promoter CGI annotation.
(D) An aggregate plot comparing the normalized phenotype score for each sgRNA targeting genes with one annotated CGI. The green line represents screen data from CRISPRoff in HEK293Ts, orange from CRISPRoff mutant in HEK293Ts, and purple from CRISPRi in K562s.
(E, F, G) Representative sgRNA activity score profiles for DKC1, GPN2, and ZCCHC9 from the indicated screen (y-axis). The green bar depicts the annotated CGI obtained from UCSC Genome Browser.
(H) Representative sgRNA activity score profile for ORC5 from the indicated screen (y-axis).
(I) An aggregate plot comparing the normalized phenotype score for each sgRNA for genes without annotated CGIs.
(J) An overlay of normalized sgRNA phenotype score from the CRISPRoff screen (green) with MNase signal that represents nucleosome occupancy (gray). The plot is an aggregate of genes with one annotated CGI.
(K) An overlay of normalized sgRNA phenotype score from the CRISPRoff screen (green) with MNase signal that represents nucleosome occupancy (gray). The plot is an aggregate of the 39 genes with no annotated CGI.
(L) A plot of sgRNA activity along with MNase signal for H2B, derived from the sgRNA tiling screen outlined in Figure S6F.

