. 2021 Aug 10;10:e71188. doi: 10.7554/eLife.71188

Figure 3. Overall structure of TACAN.

(A) Cartoon representation of the TACAN dimer with each protomer colored uniquely. (B) Surface charge distribution and the possible orientation of TACAN, blue and red representing the positive and negative charges, respectively. The membrane is demarcated by dashed lines. (C) Tertiary structure of TACAN protomer viewed from the side and the cytoplasmic side. The protein is colored rainbow from N-terminus (blue) to C-terminus (red). The six transmembrane helices (S1–S6), two horizontal helices (H1 and H2), as well as a short helix (H3) in between are labeled.

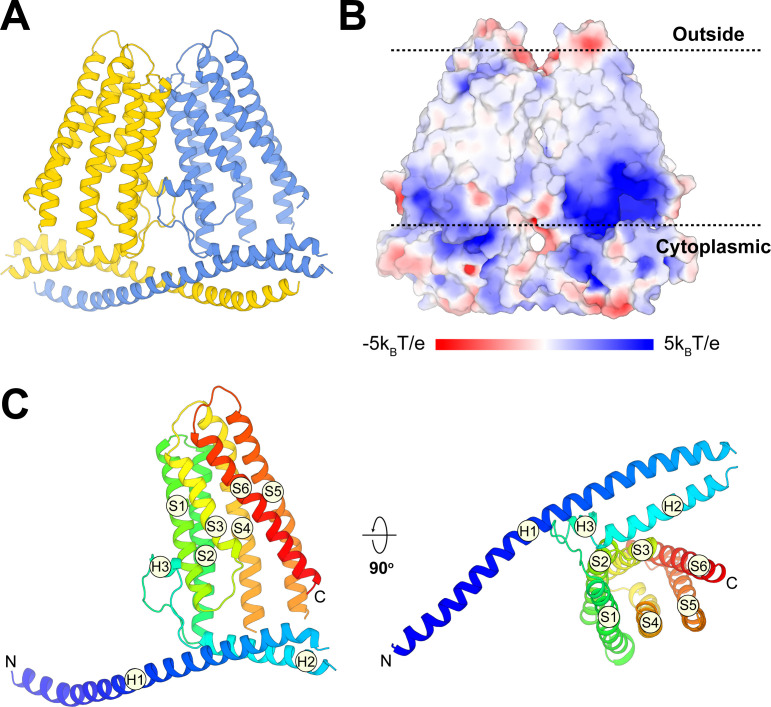
Figure 3.

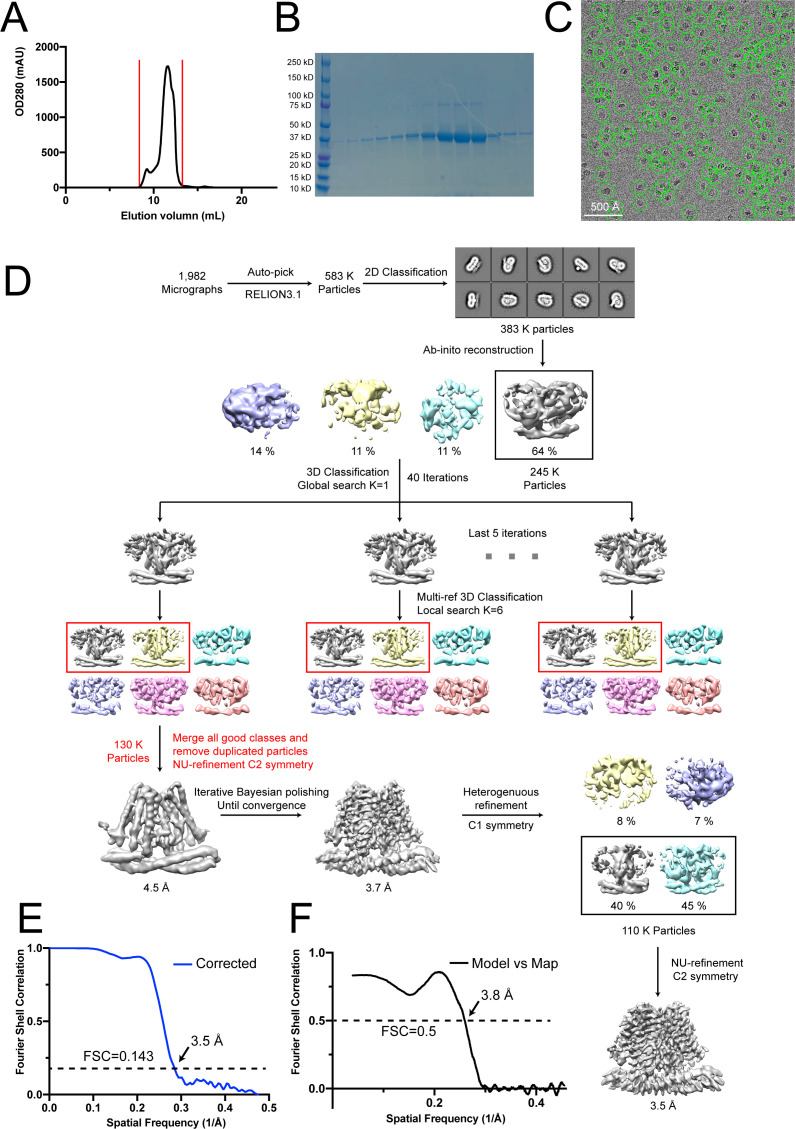
Figure 3—figure supplement 1. Cryo-EM analysis of wild-type TACAN.

Figure 3—figure supplement 1.

(A) Size-exclusion chromatography of TACAN on a Superdex 200 Increase 10/300 GL column. (B) SDS- PAGE of fractions from size-exclusion chromatography between the red vertical lines shown in (A). (C) Representative cryo-EM image of the TACANWT, selected particles are circled in green, and the scale bar is 50 nm. (D) Cryo-EM data processing workflow for TACANWT. (E) Gold-standard Fourier shell correlation (FSC) curve after correction for masking effects. The resolution was estimated based on the FSC = 0.143 criterion. (F) FSC curve of the refined model versus EM map. The resolution was estimated based on the FSC = 0.5 criterion.
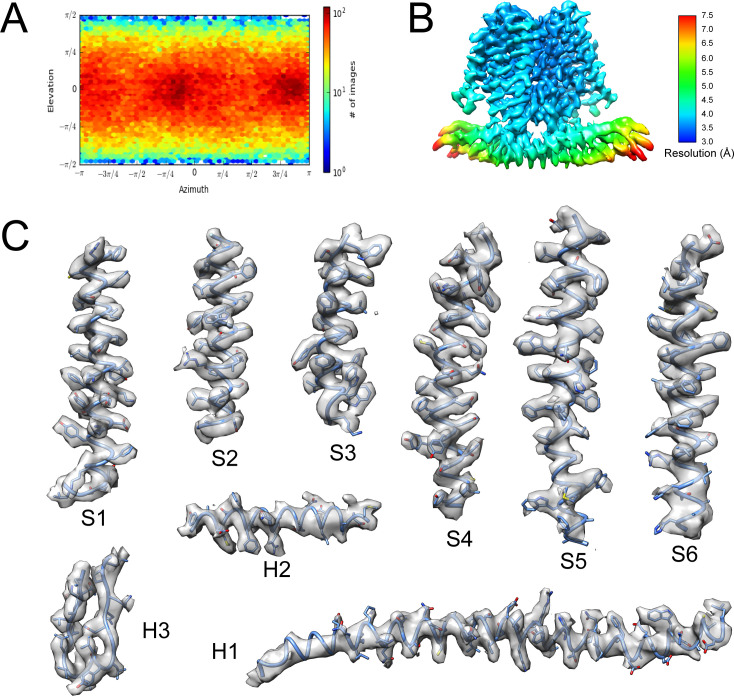
Figure 3—figure supplement 2. Representative density in the cryo-EM map of wild-type TACAN.

Figure 3—figure supplement 2.

(A) The angular distribution of final reconstruction. (B) Local resolution map of TACANWT. (C) Cryo-EM densities for selected regions of TACANWT (contour level 4.4 in COOT).
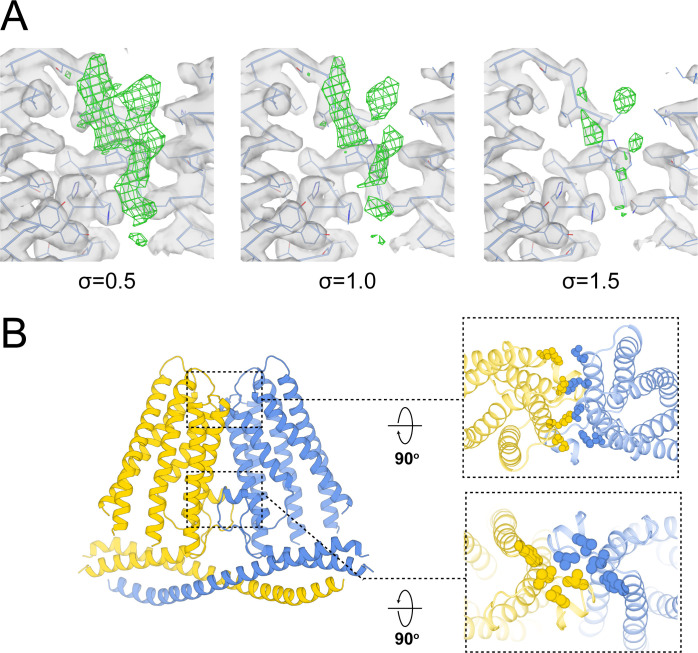
Figure 3—figure supplement 3. Structural analysis of wild-type TACAN.

Figure 3—figure supplement 3.

(A) The non-protein density (green mesh) observed in TACANWT is shown at different contour levels (UCSF Chimera). The surrounding protein density is shown as gray surface. (B) Interactions of TACAN protomers at the dimer interface. The protomers are colored uniquely, and the interfacial residues are shown in spheres.