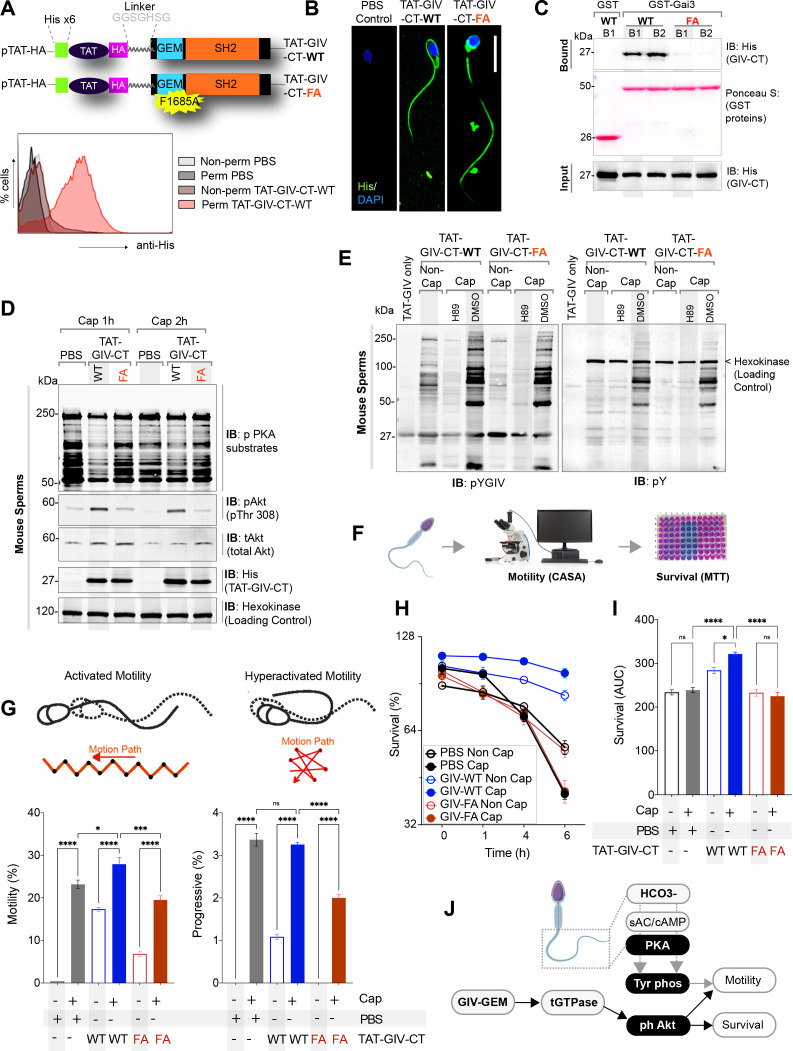
Figure 6. GIV’s GEM function is required for sperm motility and survival during capacitation.
(A, B) Schematic (A, top) of cell-permeant His-TAT-GIV-CT wildtype (WT) and GEM-deficient mutant (F1685A; FA) peptides used in this work. Immunofluorescence images (B) representative of sperms after treatment with cell-permeant TAT-GIV-CT peptides and stained with anti-His antibody and DAPI. Scale bar = 15 µm. Histograms (A, bottom) from flow cytometry studies conducted with or without permeabilization confirm the uptake of His-TAT peptides in sperm. (C) Immunoblots of GST pulldown assays testing the ability of GDP-loaded GST-Gαi3 to bind TAT-GIVCT peptides from lysates of sperms at 1 hr (B1) and 6 hr (B2) after transduction (Figure 6—source data 1). (D, E) Immunoblots of lysates of TAT-GIVCT-transduced sperms at the indicated time points after capacitation analyzed for phospho-PKA substrates (D), phospho(p) and total (t) Akt (D; Figure 6—source data 2), pYGIV (E, left), pan-pY (E, right) (Figure 6—source data 3), and hexokinase (loading control, D). (F–I) Schematic in (F) summarizes workflow in assessing motility and survival of sperms during capacitation. Bar graphs in (G; Figure 6—source data 4) display the relative % of motile and progressively motile population of sperms. Line graphs in (H) show survival of sperms as determined by methy thiazolyl tetrazolium (MTT) assay; bar graphs in (I) show the area under the curve (AUC) of the line graphs in (H) (Figure 6—source data 5). All results are presented as average ± SEM of three independent studies conducted on sperm isolated from three mice. Statistical significance was assessed using one-way analysis of variance (ANOVA) followed by Tukey’s test for multiple comparisons. *p<0.05, ***p<0.001, ****p<0.0001, ns p>0.05. (J) Schematic summarizes the conclusions of how GIV’s GEM function impacts sperm phenotypes during capacitation.

