. 2021 Jul 15;10:e68110. doi: 10.7554/eLife.68110

Figure 1. QA013.2 inferred clonal lineage development.

(A) Timeline of HIV infection, isolation of QA013.2 bnAb, and longitudinal PBMC samples used for antibody variable region sequencing. Days post initial HIV infection are listed above the timeline and black arrows below the timeline correspond to the specific PBMC samples that were used for deep sequencing. Approximate heterologous plasma breadth as determined previously (Cortez et al., 2012) is depicted above the timeline, which is not to scale. Estimated timing of superinfection as previously described (Chohan et al., 2005) is shown in purple on the timeline, with the timing of superinfection estimated as the midpoint, 324.5 days post initial infection. The QA013.2 bnAb was not isolated until 2282 days, or about 6.2 years post initial infection, as indicated. (B) Lineage graphics representing probable developmental paths for heavy and light chain lineages between inferred naïve BCR and mature QA013.2 sequences. Nodes represent inferred ancestral sequences, while arrows in between each node represent amino acid transitions. The red shading of nodes is proportional to the posterior probability that this ancestral sequence was present in the true lineage. For each given node, the blue shading of arrows arising from that node is proportional to the corresponding transition probability. Low probability nodes were filtered out, resulting in some incomplete pathways within the graphics. Dashed arrows indicate possible developmental paths that were not chosen based on low probability. See Figure 1—figure supplements 14. (C) Probable lineage sequences for the developing QA013.2 heavy (blue) and light chains (orange) are displayed in their inferred chronological order. With respect to the inferred naive sequence at the top of each lineage, variable region amino acid substitutions are indicated by black lines. Dashed lines demarcate the CDRs that are flanked by FWRs. Red percentages to the right of each sequence represent the nucleotide identity of each computationally inferred lineage member to sampled NGS sequences present in the longitudinal B cell repertoire of QA013, rounded to the nearest percent. See also Supplementary files 1 and 2 for fasta files of computationally inferred lineage members and sampled NGS sequences with high nucleotide identity to inferred lineage members.

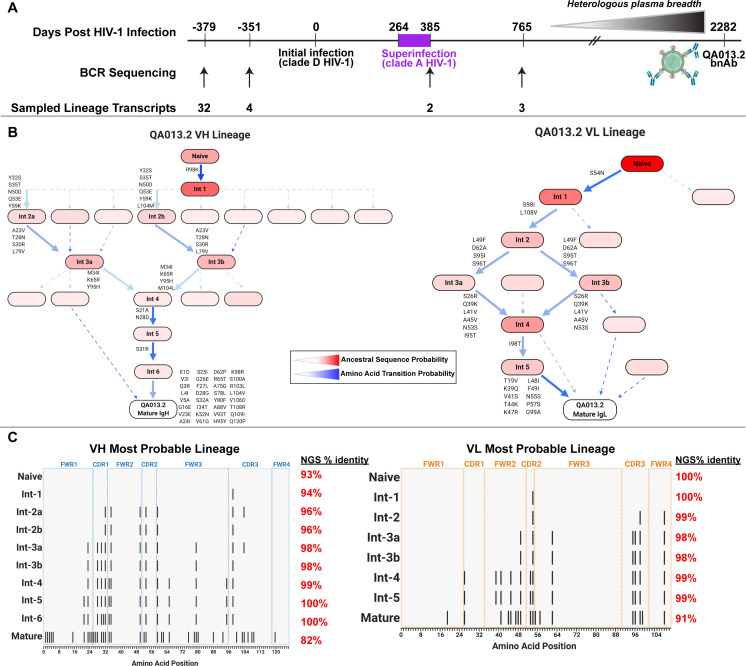
Figure 1.

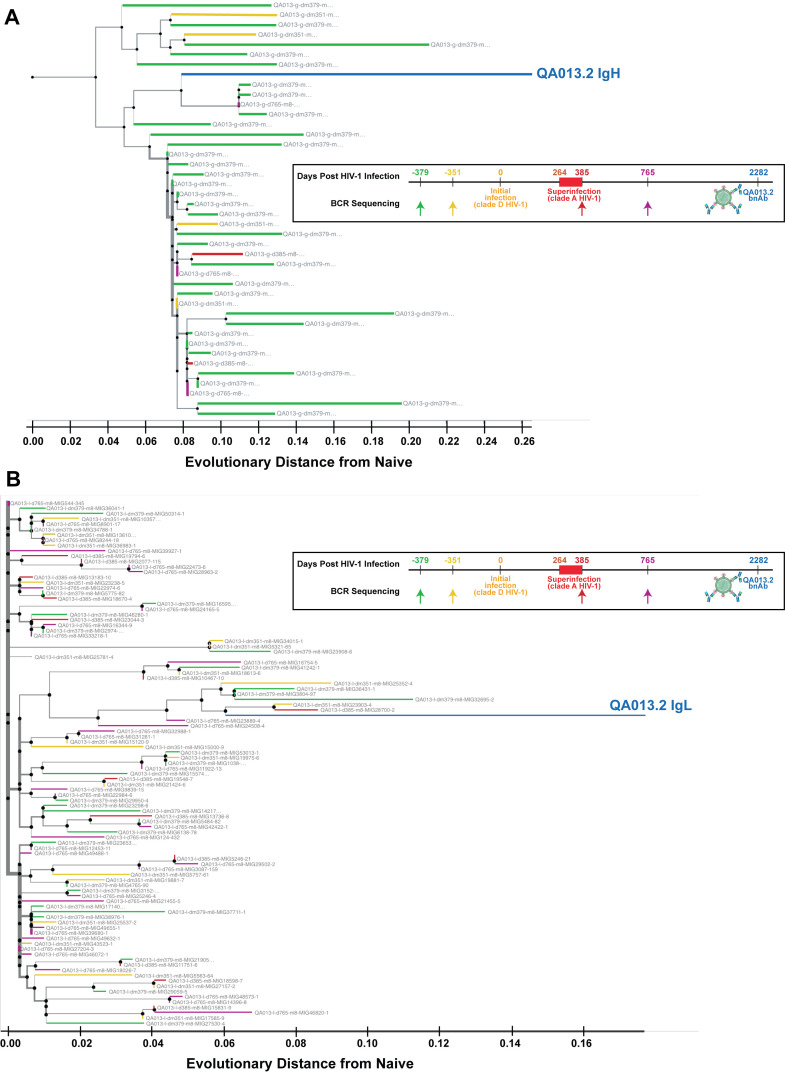
Figure 1—figure supplement 1. Phylogenetic relationship of sampled QA013.2 heavy and light chain clonal family sequences from four longitudinal PBMC samples.

Figure 1—figure supplement 1.

(A) Maximum-likelihood (ML) tree of the 42 sampled clonal family sequences for QA013.2 heavy chain colored by NGS timepoint. (B) ML tree of the pruned clonal family containing 100 sequences for QA013.2 light chain colored by NGS timepoint. Nodes on each tree represent ancestral sequences that have been computationally inferred using the tool linearham (https://github.com/matsengrp/linearham) (Dhar et al., 2020). ML clonal family trees were visualized using Olmsted (https://github.com/matsengrp/olmsted), Ralph, 2021b. Tree branch width depicts the local branching index (lbi) (Neher et al., 2014). The x-axis depicts the number of nucleotide substitutions per site relative to the inferred naïve BCR for each antibody chain.
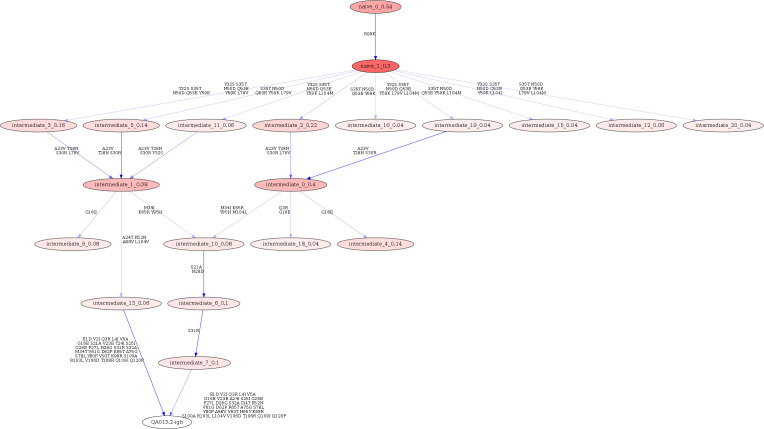
Figure 1—figure supplement 2. Linearham lineage trajectory graphics of QA013.2 VH inferred lineage members from inferred naive antibody sequence to mature.

Figure 1—figure supplement 2.

Nodes represent inferred ancestral sequences, while arrows in between each node represent amino acid transitions. The red shading of nodes is proportional to the posterior probability that this ancestral sequence was present in the true lineage, and these probability values are listed in each node following each inferred intermediate (i.e. intermediate_x_probability). The VH lineage was analyzed using 0.04 probability cutoff such that any edge with probability less than this threshold was discarded. Since low probability nodes were filtered out, there are some incomplete pathways within the graphics. For each given node, the blue shading of arrows arising from that node is proportional to the posterior probability of the associated amino acid sequence transition. Lineage members have been renamed for clarity in the main text and numbers listed here do not correspond with those in the main text. Refer to Figure 1 for lineage intermediate numbering scheme.
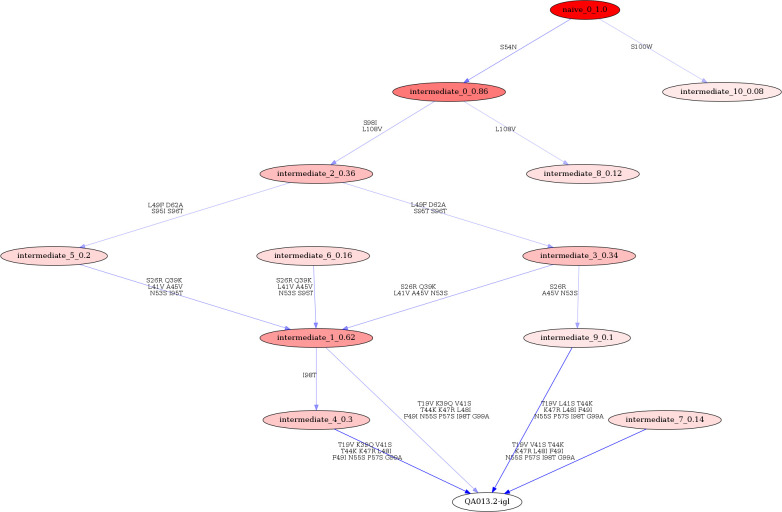
Figure 1—figure supplement 3. Linearham lineage trajectory graphics of QA013.2 VL inferred lineage members from inferred naive antibody sequence to mature.

Figure 1—figure supplement 3.

Nodes represent inferred ancestral sequences, while arrows in between each node represent amino acid transitions. The red shading of nodes is proportional to the posterior probability that this ancestral sequence was present in the true lineage, and these probability values are listed in each node following each inferred intermediate (i.e. intermediate_x_probability). The VL lineage was analyzed using 0.08 probability cutoff such that any edge with probability less than this threshold was discarded. Since low probability nodes were filtered out, there are some incomplete pathways within the graphics. For each given node, the blue shading of arrows arising from that node is proportional to the posterior probability of the associated amino acid sequence transition. Lineage members have been renamed for clarity in the main text and numbers listed here do not correspond with those in the main text. Refer to Figure 1 for lineage intermediate numbering scheme.
Figure 1—figure supplement 4. Partis clonal family cluster for QA013.2 clonal family containing VH sequences sampled from QA013 over four longitudinal timepoints.

Figure 1—figure supplement 4.

Partis software was run on the aggregated IgG NGS dataset from QA013 using the ‘seeded’ method (see Materials and methods section) where QA013.2 variable heavy (VH) chain was the seed sequence of interest. These clonal family clustering data demonstrate shared mutations of sampled VH sequences from pre-HIV infection (dm379 and dm351) with the QA013.2 mature bnAb VH sequence. The red nucleotides represent mutated bases relative to the inferred naïve BCR, with germline sequences listed at the top of the alignment.