Abstract
Resistance to immune checkpoint inhibitors (ICR) is a key challenge in cancer therapy. To elucidate underlying mechanisms, we developed Perturb-CITE-seq, enabling pooled CRISPR-Cas9 perturbations with single-cell transcriptome and protein read-outs. In patient-derived melanoma cells and autologous tumor infiltrating lymphocyte (TIL) co-cultures, we profiled transcriptomes and 20 proteins in ~218,000 cells under ~750 perturbations associated with cancer cell-intrinsic ICR. We recover known mechanisms of resistance, including defects in the IFNγ-JAK/STAT and antigen-presentation pathways in RNA, protein and perturbation space, and novel ones, including loss/downregulation of CD58. Loss of CD58 conferred immune evasion in multiple co-culture models and was downregulated in tumors of melanoma patients with ICR. CD58 expression was not significantly regulated by IFNγ and CD58 loss conferred immune evasion without compromising MHC expression, suggesting that it acts orthogonal to known mechanisms of ICR. This work provides framework for deciphering complex mechanisms by large-scale perturbation screens with multi-modal single-cell readouts, and discovers potentially clinically relevant mechanisms of immune evasion.
INTRODUCTION
Molecular circuits form the basic driving force from genotype to phenotype in cells, tissues, and entire organisms. Circuits in cells process diverse signals, make appropriate decisions, and orchestrate physiological responses to these signals. Diseases arise from circuit malfunctions: one or more components are missing or defective; a key module is over- or under-activated. One key approach to chart circuits and understanding their function is pooled perturbation screens. The recent development of methods like Perturb-seq1–4 combined pooled genetic perturbation screens, where through single cell RNA-seq (scRNA-seq) the perturbation is read as an RNA barcode along with the full RNA profile of the cell, as a rich readout. However, many relevant phenotypes are functionally best understood at protein level, and are reflected differently at the RNA and protein level, thus requiring expansion of prior Perturb-Seq schemes. A proof-of-concept study using ECCITE-seq5 demonstrated simultaneous detection of protein, RNA, and guide RNAs in individual cells and was applied at a small scale without the analytical framework required for large scale screens.
Multi-modal genetic screens should provide in principle a powerful opportunity to enhance our understanding of immune checkpoint inhibitor (ICIs) resistance (ICR). Antibodies targeting CTLA-4 or the PD-1/PD-L1 axis release tumor-mediated immune inhibition and enable T-cell mediated killing of tumor cells6. While ICIs produce durable responses in some patients most patients either do not benefit or develop resistance over time. Understanding mechanisms of resistance is therefore a key challenge and opportunity. Clinically relevant mechanisms of include mutations in beta-2-microglobulin (B2M) resulting in loss of MHC Class I presentation, downregulation of the antigen presentation machinery, and mutations in the IFNγ-JAK/STAT pathway that impair response to T cell mediated anti-tumor activity7–9. However, genetic signals only account for a minority of cases. We previously identified an ICR signature, which is predictive of intrinsic resistance to ICI, in a subset of malignant cells in patients with metastatic melanoma using scRNA-seq9. CRISPR/Cas9 KO screens in murine models or engineered human cell lines testing tumor-T cell interactions identified putative novel mechanisms of immune evasion involving chromatin regulators10, TNFα signaling11, SOX412, PTPN213, and APLNR10, yet their clinical relevance is unclear. Recent advances in cellular models should allow us to study co-cultures of malignant cells derived directly from patient tumors along with their ex vivo expanded autologous tumor infiltrating lymphocytes (TILs)14 and provide and excellent screening platform to study effects of cancer immunotherapy14–17.
Here, we develop Perturb-CITE-Seq, an extension of Perturb-Seq that combines scRNA-seq profiling and epitopes sequencing (CITE-seq)18 of single-cell surface proteins under perturbations5. We performed pooled Perturb-CITE-Seq screens of the ICR program genes in a patient-derived tumor-TIL co-culture model, targeting 248 genes of the ICR signature (744 targeting guides) and profiling single-cell transcriptomes and 20 surface proteins in >218,000 cells. We developed an integrated analytical framework and recover the known landscape of clinically relevant immune resistance mutations along with novel ones. Among others, we find that loss or downregulation of CD58 confers immune evasion to T cell (and in part to Natural Killer (NK) cells) mediated killing, and we validate this finding in additional patient models and in clinical scRNA-seq data of patients with ICR. Our work provides a broadly applicable experimental and analytical framework for Perturb-CITE-Seq in patient models and identifies mechanisms of immune evasion that are in part orthogonal to previously described mechanisms in patients.
RESULTS
Patient-derived co-cultures for pooled perturbation screens
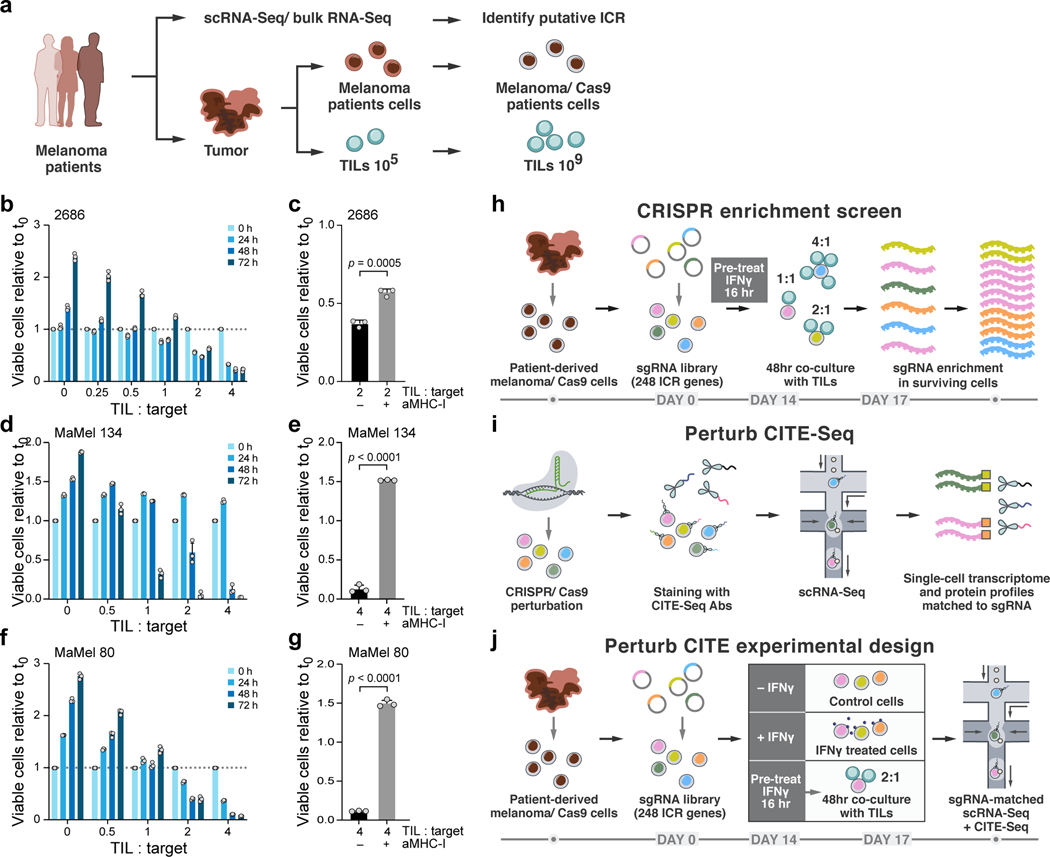
To systematically and functionally evaluate the contribution of ICR signature genes to T cell mediated killing resistance, we designed two types of CRISPR/Cas9 loss of function (KO) screens using a human tumor-immune co-culture model9 (Fig.1a): a viability screen, to determine the impact of perturbation on T cell-mediated killing (Fig. 1h) and a Perturb-CITE-Seq screen, to decipher the underlying circuitry (Fig. 1i,j).
Figure 1. Perturb-CITE-Seq to study tumor intrinsic mechanisms of T cell resistance using patient derived co-culture models.
a. Patient derived cell models and programs. Resected melanomas (left) were profiled by bulk and scRNA-seq (top) to identify an immune resistance program (ICR)9. Melanoma (brown, middle) and tumor infiltrating lymphocytes (TILs, blue, bottom) cells were grown from patients’ tumors; melanoma cells were transduced to express Cas9 and TILs were expanded to yield sufficient numbers for screening (Methods). b-g. Optimization and validation of co-culture system for TIL mediated killing of melanoma cells. b,d,f. Time and dose-dependent killing of melanoma target cells by autologous TILs in three patient derived co-culture models. Ratio of viable cancer cells (y axis, relative to t0) at different TIL : cancer cell ratios (x axis) at different time points (color legend) after pre-treatment of target cells with 1 ng/ml IFNγ for 16 hours using TILs without prior restimulation in each patient-derived co-culture model (panels). Experiment was performed in triplicates in each of two independent experiments. c,e,g. Target cell killing depends on MHC-I. Ratio of viable cancer cells (y axis, relative to t0) after 48 hours in a 4:1 TIL and cancer cell co-culture with cancer cells pre-treated with 1ng/ml IFNγ for 16 hours and TILs without prior restimulation, in the absence or presence of MHC-I blocking antibodies (x axis). Two-sided t-test. Error bars: Mean ±SD. Experiment was performed in triplicates in each of two independent experiments. h. Viability screen design. i. Perturb-CITE-Seq approach. j. Perturb-CITE-Seq screens to characterize regulators of melanoma immune evasion.
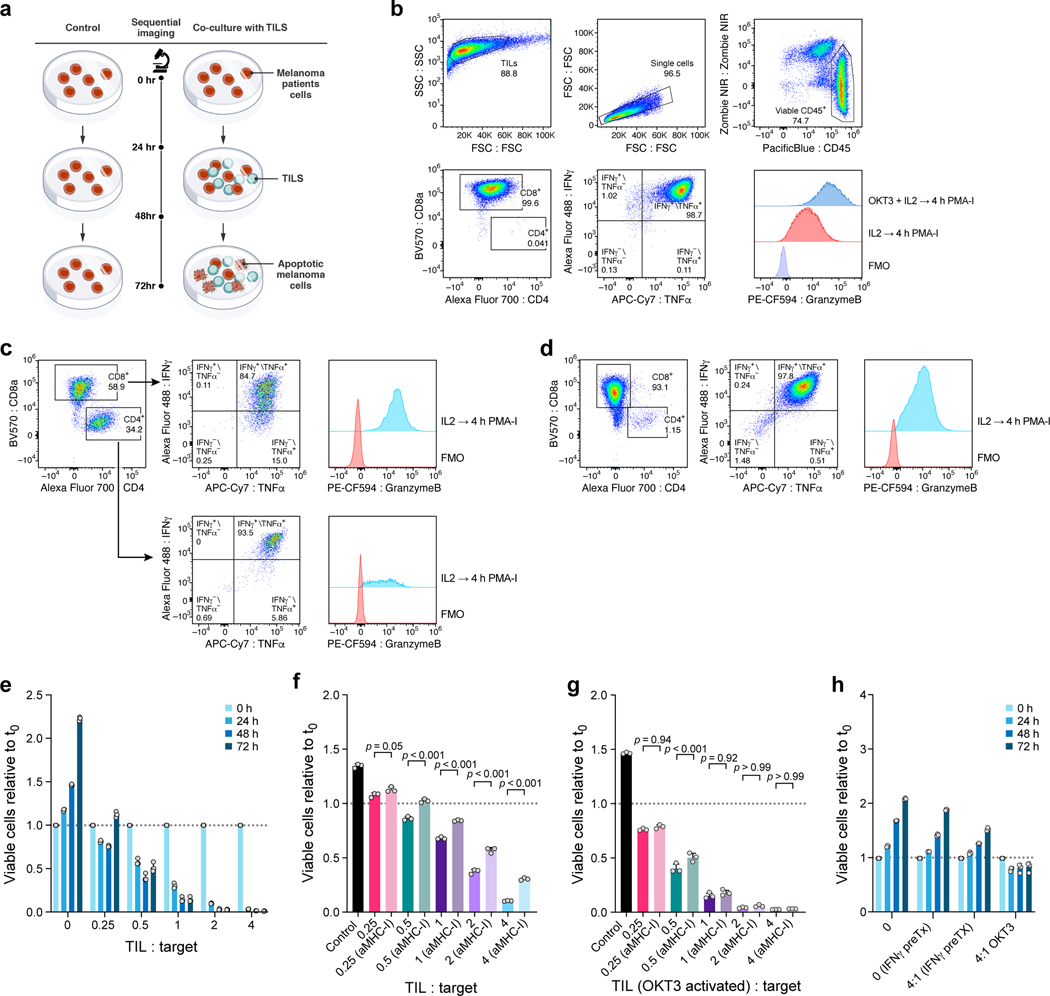
We established autologous co-culture models of melanoma cell lines and ex vivo expanded TILs from multiple patients (Fig. 1a, Methods). The expanded TILs consisted of either exclusively CD8+ T cells (Extended Data Fig. 1b,d) or a mixed population of CD8+ and CD4+ T cells (Extended Data Fig. 1c). Using a miniaturized optical platform (Extended Data Fig. 1a, Methods) and improved methods of T cell activation to reduce bystander killing (Extended Data Fig. 1b-h, Methods), co-cultures of T cells and cancer cells resulted in dose- (TIL:cancer cell ratio) and time-dependent cancer cell killing (Fig. 1b,d,f). Tumor cell lysis was highly reproducible and specific to T cell receptor (TCR)/MHC Class I interactions (Fig. 1c,e,g, Extended Data Fig. 1h).
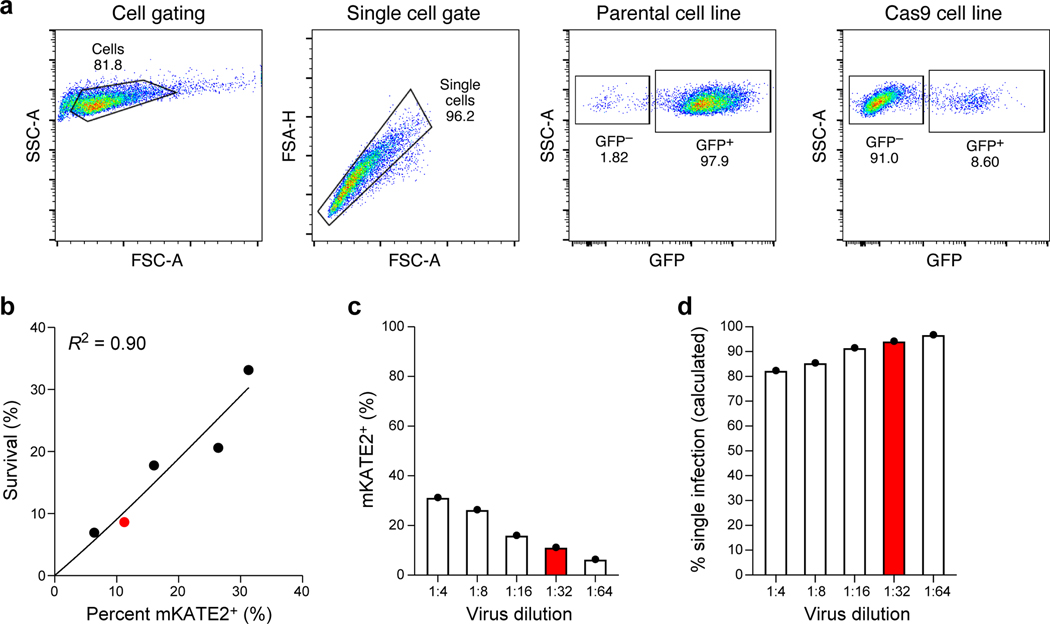
Next, for both viability and Perturb-CITE-Seq pooled screens, we established a pooled library of 744 single-guide (sg)RNA targeting 248 genes with putative roles in immunotherapy resistance (ICR library, Supplementary Table 1, Methods). We transduced patient-derived melanoma cells that stably expressing active Cas9 (Extended Data Fig. 2a) with the ICR library at multiplicity of infection (MOI) 0.1 to achieve a high rate of single-guide transductions with ~1,000 cells/guide (Extended Data Fig. 2b-d), cultured the cells for 14 days, and then either co-cultured them with a range of TIL doses (1:1, 2:1 or 4:1 ratios), treated them with IFNγ (no co-culture), or maintained them in culture media alone (control). Survivor cells of each condition were collected after 48 hours of co-culture for gDNA isolation, sequencing, and identification of enriched perturbations (Fig. 1h, Methods).
To develop Perturb-CITE-Seq, we combined 3’ droplet-based scRNA with extracellular protein detection (CITE-seq) and single cell gRNA detection1–3. We expressed the gRNA on a polyadenylated transcript using a modified CROP-seq vector (Methods) and performed a targeted “dial-out” amplification generating a robust dictionary linking gRNA identities to single-cell transcriptional and protein profiles. Notably, previously described methods to detect gRNAs are compatible with Perturb-CITE-Seq, including ECCITE-seq and direct capture of gRNAs by feature barcoding1,2,5.
For the Perturb-CITE-Seq screen, we collected surviving cells from each of the three conditions (Fig. 1j) with a representation of ~100 cells per perturbation1. We detected an average of 16 antibodies per cell (of 24 total antibodies including IgG controls) with an average 45.2 unique molecular identifiers (UMIs) per antibody, and 89.5% of all cells with both an assigned sgRNA and multiple detected antibodies. The sensitivity of gRNA, protein, and mRNA detection was similar to previously described sensitivity of Perturb-seq1–3 and CITE-seq as separate experiments18.
Pooled screens identify mechanisms of immune evasion
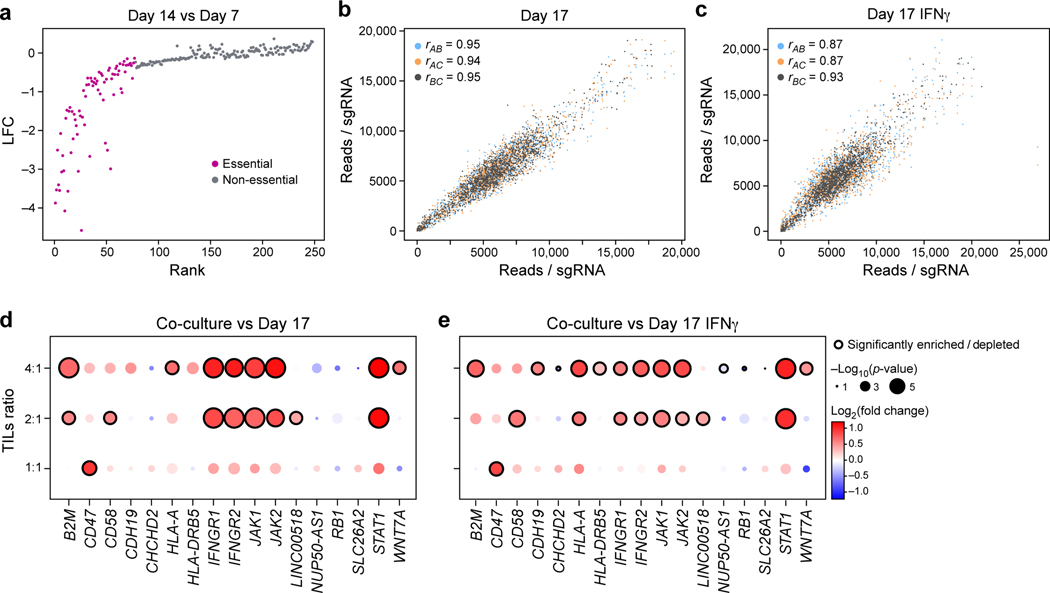
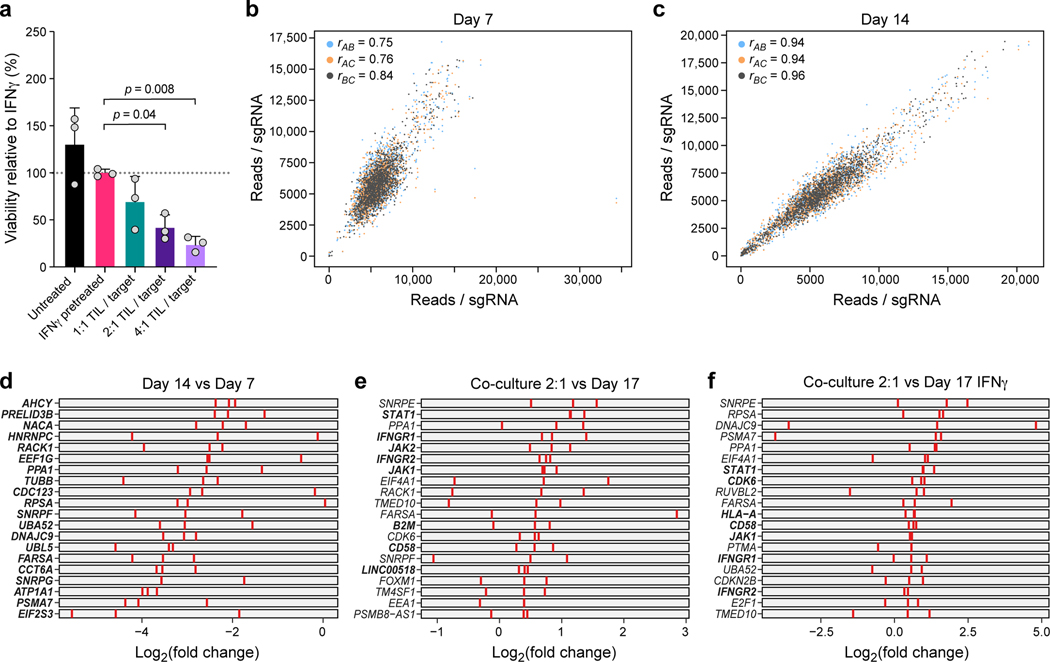
To identify “essential” genes independent of T cell mediated killing in this robust screen (Extended Data Fig. 3a-c), we identified sgRNAs that are depleted by day 7 and day 14 prior to any treatment or co-culture (Fig. 2a, Extended Data Fig. 3b-d, Supplementary Table 2). These included expected genes such as MYC. On day 14, we treated cells with IFNγ or control media for 16 hours, followed by either co-culture for 48 hours at different TIL:tumor cell ratios or media only (Fig. 1h). The screens were highly reproducible across triplicate samples (Fig. 2b,c, Extended Data Fig. 3b,c), and co-culture showed dose-dependent lysis of cancer cells with 30.96%, 58.35 % and 75.0% killing at 1:1, 2:1 and 4:1 ratios, respectively (Extended Data Fig. 3a). As expected, perturbations of B2M, HLA-A, JAK1, JAK2, STAT1, IFNGR1 and IFNGR2 (Fig. 2d,e, Extended Data Fig. 3e,f, Supplementary Table 2) conferred immune evasion, consistent with clinical mechanisms of resistance to immunotherapy7–9.
Figure 2. Identification of genes for evasion of TIL-mediated killing by CRISPR/Cas9 viability screen in patient-derived models exposed to increasing immune pressures.
a, Identification of essential gene unrelated to immune pressure. Change in abundance (negative log2 fold-change (LFC), y axis) of each sgDNA (dot) in day 14 vs. day 7 following lentivirus transduction, with guides ranked (x axis) by LFC value. Pink: called essential genes (Methods). b,c, High reproducibility of screen across triplicates. Number of reads detected (x, y axis) for each sgDNA (dots) when comparing each pair within triplicate experiments (color legend) in either control cells (b) and in IFNγ treated cells (c) on day 17. Pearson (r) correlation coefficients are noted in the color legend. (d,e) Co-culture screen highlights role for IFN γ/Jak-STAT pathway and additional mechanisms. Log2(Fold Change) (dot color) and significance (-log10(p-value), dot dize (and significantly enriched/depleted cirled with black border), Methods) of genes (columns) whose sgDNA in tumor cells co-cultured with different doses of TILs (rows) was differentially enriched compared to control cells on Day 17 (d) or IFNγ-treated cells on day 17 (e).
Other enriched perturbations included CD47, CD58, CDH19 and (Fig. 2d,e). CD47 is a “don’t eat me” signal on tumor cells that interacts with SIRPa on phagocytic cells; and blockade of the CD47/SIRPa axis improves tumor control in vivo19. Recent studies revealed that activated T cells also express SIRPa and that interaction with CD47 results in increased T cell activation and cytokine production20, which may impact the potential clinical benefit of CD47-blockade21. CD58 (also known as LFA3) is an understudied adhesion molecule, typically expressed on antigen-presenting cells, that binds CD2 on T cell and Natural Killer (NK) cells22. The role of CD58 in cancer is poorly understood. Notably, there is no known mouse homolog of CD58, emphasizing the value of performing such screens in human models10. Overall, the viability screen recovered known immune evasion mechanisms in a dose-dependent manner, and identified several novel candidates. We next explored our Perturb-CITE-Seq data organizing these candidates in pathway along with the molecular processes they regulate.
Multi-modal single-cell readouts of immune evasion
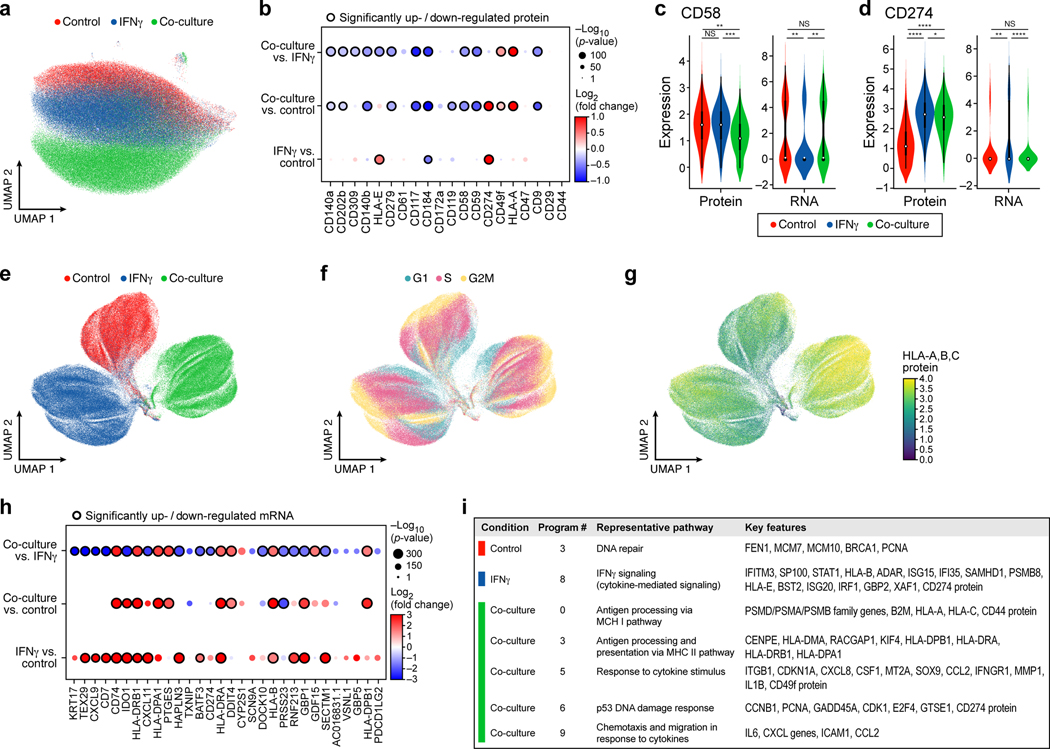
Across all Perturb-CITE-Seq screens, we analyzed 218,331 high quality single-cell RNA and protein profiles spanning the co-culture (73,114 cells), IFNγ (87,590), and control (57,627) conditions (Fig. 3a,e, Extended Data Fig. 4a-d, Methods). We removed 805 contaminating T cells using unsupervised clustering (Extended Data Fig. 4a,b, Methods). We first focused on the RNA and protein profiles in the context of the different conditions (irrespective of perturbations). Embedding cells by either protein (Fig. 3a) or RNA (Fig. 3e) profiles alone separated by treatment conditions. Within each condition, both the cell cycle (G1/0, S, G2/M) (Fig. 3f) and complexity (Extended Data Fig. 4c) impacted RNA profiles, revealing important covariates, which we address in later analyses (Extended Data Fig. 4d-h), Both on a protein and RNA level we identify expected responses to T cell mediated killing (Supplementary Table 3, Methods).
Figure 3. Single-cell protein and RNA profiles reveal regulation of genes and program involved in immune evasion.
a,b. Distinct protein profiles across immune pressures highlight regulation of cell surface proteins whose genetic perturbation confers resistance to TIL mediated killing. a. Uniform Manifold Approximation and Projection (UMAP) embedding of single cell CITE-antibody count profiles (dots) colored by condition (color legend). b. Log2(Fold Change) (dot color) and significance (-log10(p-value)), dot size (and statistically significantly up/downregulated circled with black border), logistic regression model; Methods) between each pair of conditions (rows) of each cell surface protein (columns) measured by CITE-Seq. c,d. Regulation of CD58 and CD274 (PDL1) by culture conditions. Distribution of protein counts (y axis, left) or RNA (normalized expression, Methods) (y axis, right) for CD58 (c) and CD274 (d). **** P < 1−10, Welch’s t test. Middle dot: median; box edges: 25th and 75th percentiles; whiskers: most extreme points that do not exceed ± 1.5 times interquartile range (IQR). Shading denotes a kernel density estimate with a bandwidth of 0.4. e-g. Variation in RNA profiles across and within conditions captures cell cycle state and MHC-I protein expression. UMAP embedding of scRNA-seq profiles (dots) colored by condition (e), cell cycle phase signature (f), or MHC (HLA-A,B,C) expression level (g, color bar). h,i. RNA expression of key immune genes and programs is impacted by increased immune pressure. h. Log2(Fold Change) (dot color) and significance (-log10(p-value)), dot size (and statistically significantly up/downregulated circled with black border)31 between each pair of conditions (rows) of the RNA of select immune genes (columns) measured by scRNA-seq, and differentially expressed between conditions. i. Gene programs identified by jackstraw PCA in each condition, representative enriched Gene Ontology processes, and select member genes.
At the protein level, we observe increases in MHC proteins and PD-L1 (CD274) in IFNγ-treated vs. control cells; a global increase in MHC proteins in co-culture vs. control cells (Fig. 3b, Supplementary Table 4, Methods), and, consistent with prior reports12, induction of CD49f, which encodes an integrin associated with epithelial-to-mesenchymal transition (EMT). Conversely, there was strong down-regulation of several proteins with potential roles in modifying the response to immunotherapies exclusively in co-culture conditions, including CXCR4 (CD184), c-KIT (CD117) and KDR (CD309)23,24 (Fig. 3b). In particular, CD58, CD47, and IFNGR1 (CD119) protein levels were reduced in co-culture, concordant with enrichment of their genetic KO in the viability screen (Fig. 3b, Fig. 2d,e). Comparing RNA profiles between conditions also highlighted genes involved in antigen presentation, chemokines and immune modulators (Fig. 3g,h, Supplementary Table 4), yet only some of the protein-level differences between treatments were observed at the level of the individual corresponding transcript (Fig. 3c), highlighting the importance of simultaneous RNA and protein detection. Overall, our results suggest that genes functionally impacting susceptibility to T cell mediated killing (based on genetic perturbation in the viability screen) are concordantly regulated at the protein and RNA level.
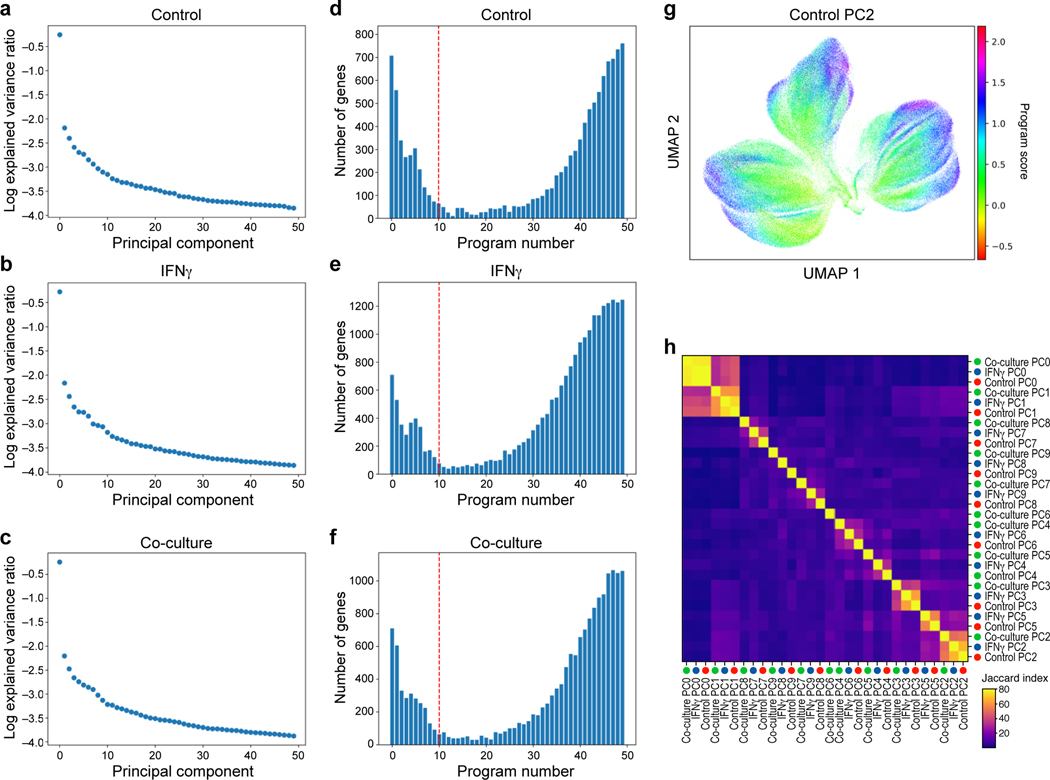
Next, integrating RNA and protein measurements for joint analysis (Methods) highlighted gene programs that are either common across conditions, or unique to different conditions (Fig. 3i), with the co-cultured cells uniquely enriched for induction of immune escape pathway genes and the ICR signature. Specifically, we learned programs in each treatment condition by an adapted jackstraw principal component analysis (PCA) procedure (Methods, Extended Data Fig. 5a-g), and annotated them by enrichment for functional gene categories (Supplementary Table 5). Several programs, including cell cycle regulation, DNA repair, and antigen presentation, were shared across conditions, whereas immune escape programs were uniquely recovered in co-culture data, and interferon response genes in IFNγ stimulation (Fig. 3i, Extended Data Fig. 5h, Supplementary Table 5). Thus, single-cell RNA and protein profiles provide rich relevant phenotypes for assessing the impact of CRISPR perturbations.
A computational framework for analysis of Perturb-CITE-Seq
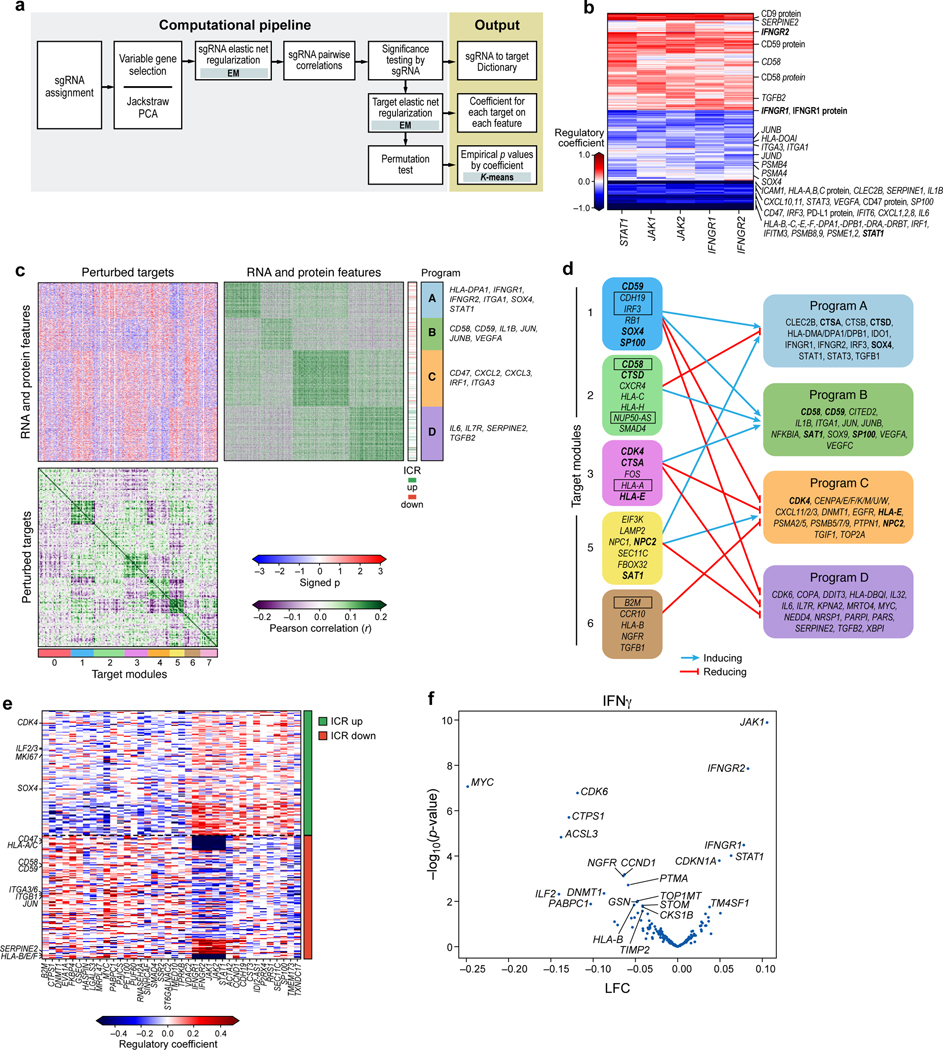
We developed a computational framework to model the effects of genetic perturbations on both RNA and protein profiles of individual genes (Fig. 4a, Methods). Briefly, we used dial-out PCR data to determine the identity of perturbations (sgRNAs) in each cell (Extended Data Fig. 6a, Methods), and applied a linear model with elastic net regularization to infer the mean effect of each perturbation (sgRNA) on each feature (RNA and protein levels). We used a total of 4,461 RNA and 20 protein features, including all measured proteins and the union of the 1,000 top variable genes (Methods) and gene members of the programs identified by jackstraw PCA in any one condition. As we previously showed1, detection of a sgRNA in a cell does not necessarily mean that this cell is perturbed, either because the sgRNA has not perturbed the gene, or the perturbation does not have an impact. To address this, we calculated the probability of a successful perturbation after fitting an initial regulatory matrix, and then updated sgRNA assignments using an estimate of the probability for each cell that it was successfully perturbed. Our model extends our MIMOSCA framework1 by grouping sgRNAs targeting the same gene according to their concordant effects across features (Methods). Following our prior studies1, we included both cell cycle and cell complexity (number of UMIs) as known covariates that impact cell profiles (Fig. 3f, Extended Data Fig. 4c). Including these covariates improved the model fit quality (residuals approach mean zero, independent and identically distributed; Extended Data Fig. 6b,c). Finally, we performed a permutation test to assess the empirical significance of each coefficient in the inferred regulatory matrix (Methods).
Figure 4. Perturb-CITE-Seq reveals co-functional modules that are dependent- or independent of a predominant IFNg/JAK-STAT mechanism.
a. Overview of computational approach (Methods). b. Perturbations in JAK/STAT pathway affect known and putative mechanisms of immune evasion. Regulatory effect ( values) on RNA and protein features (rows) when perturbing different genes in the JAK-STAT pathway (columns). c,d. Co-functional modules and co-regulated programs in the Perturb-CITE-Seq screen. c. Middle heatmap: Signed significance (−log10(Empirical p) * sign(²), red/blue color bar) for the effect on each RNA/protein feature (rows) of perturbing each gene (columns, excluding JAK-STAT targets) in the co-culture condition. Right and bottom matrices: Pearson correlation coefficient (purple/green color bar) between the significance profiles of either gene/protein features (right matrix) or perturbed genes (bottom matrix). Co-functional modules (bottom bar) and co-regulated programs (right bar) are identified by K-means clustering of each of the bottom and right matrices separately (k=4 and 8, respectively), and the clustering defines the row and column order. d. Representation of the regulatory connections between select modules (left) and programs (right) from c. Bold font: select regulators that are also members of programs. Boxed font: selected regulators significantly enriched/depleted in the viability screen (Fig. 2d,e). Notably, the edges in d are opposite the sign of the empirical p value in c: a target module connected to a co-regulated program with negative signed p values in c activates the corresponding program in d. e,f. The ICR program is coherently regulated by the perturbed regulators. e. Regulatory effect ( values) on RNA/protein features from the ICR program (rows, ICR as defined in Ref. 9) by perturbations of different genes in the screen (columns), clustered by K-means clustering (K=2). f. Change in ICR signature scores and its associated significance (y axis, -log10(P-value), Welch’s t test) for each perturbation (dot) in the IFN condition (Methods). Key perturbations with significant effects are noted.
Perturb-CITE-Seq identifies immune evasion programs/modules
The Perturb-CITE-Seq model correctly reconstructed impacts of genes known to affect resistance to immunotherapy, especially the effect of perturbing the IFNγ response machinery (Fig. 4b), along with novel pathways. The regulatory model can be parsed into eight major co-functional modules of perturbations that similarly impact one or more of four major gene co-regulated programs (Fig. 4c,d). Importantly, genes that were hits in the viability screen partitioned into different functional modules, thus highlighting the effect of the same (converging) or distinct (divergent) mechanism, which could not be distinguished by a viability screen alone. Those genes are also often members of regulated programs (Fig. 4d).
First, the model accurately recovers effects of perturbing components of the IFNγ response pathway. Perturbation of any major known node of this pathway down-regulated a coherent regulatory program in co-culture (Fig. 4b). The downregulated program included key components of antigen presentation and associated machinery (e.g., PSMB4, PSMB8, PSMB9, PSMA4, HLA-A,B,C gene and protein, HLA-E, HLA-F, HLAD-DPB1), chemokines associated with anti-tumor immunity (CXCL1, CXCL2, CXCL8, CXCL10, CXCL11), inflammatory cytokines (STAT3, IL1B, IL6), interferon response elements (STAT1, IRF1, IRF3, IFITM3, IFIT6), surface checkpoints (CD274 protein, CD47 gene and protein), and genes associated with cell differentiation states (SOX4, ITGA3, ITGA1). Thus, multiple transcripts and proteins implicated in modifying the response to immunotherapies are directly regulated by the IFNγ-JAK/STAT axis, suggesting that some of these mechanisms are a consequence of defective IFNγ-JAK/STAT signaling, rather than independent modes of resistance.
Other transcripts and proteins were upregulated following perturbations in the IFNγ-JAK/STAT nodes. These include SERPINE2 and TGFB2, CD9 protein, CD59 protein, and both CD58 transcript and CD58 protein (Fig. 4b). It is likely that the induction of these genes is not through the IFNγ-JAK/STAT pathway. For example, knockout or downregulation of CD58 is associated with immune evasion (Fig. 2d,e; Fig. 3d), and thus its upregulation following perturbations in the IFNγ-JAK/STAT module is likely not part of this pathway’s immune evasion mechanism, and CD58’s role in immune evasion may therefore be distinct from defects in the IFNγ-JAK/STAT pathway.
To focus on other distinct co-functional modules, we examined the regulation matrix after excluding perturbations in the IFNγ-JAK/STAT pathway genes (Fig. 4c), and recovered novel regulators and mechanisms of immune evasion, either related to or distinct from the impact of the IFNγ -JAK/STAT pathway (Fig. 4c,d, Supplementary Table 6, Supplementary Note).
The perturbations also altered the expression of the ICR program, which we originally defined in patients1, in both co-culture (Fig. 4e) and in response to IFN γ treatment (Fig. 4f). Perturbations of the IFNγ-JAK/STAT module strongly increased the Overall Expression of the ICR signature (JAK1 p-value = 1.3e-10, IFNGR2 p-value = 1.4e-8, IFNGR1 p-value = 3.3e-5, STAT1 p-value = 9.6e-5, statistics by Welch’s t test, Methods), as did deletion of TMEM173, encoding STING (STimulator of INterferon Genes), which activates a type I interferon response25 (Fig. 4e). STING agonists are currently evaluated clinical trials in melanoma patients with resistance to ICI therapy, and other cancers26. In contrast, other perturbations, such as KO of CDK6, MYC, ILF2, DNMT1, or ACSL3, repressed the ICR signature (Fig. 4f), consistent with our previously reported patient and pre-clinical data, where we demonstrate that upregulation of MYC and CDK4/6 (and their transcriptional targets) was associated with increased resistance to immunotherapy, and CDK4/6 inhibitors reduced resistance in human and pre-clinical melanoma models9.
Taken together, our Perturb-CITE-Seq analysis rediscovered key mechanisms of immune evasion, organized them into modules and related them to the genes and programs they impact, as well as recovered new modules that may confer immune evasion beyond defects in the IFNγ-JAK/STAT pathway and antigen presentation.
Loss/downregulation of CD58 confers cancer immune evasion
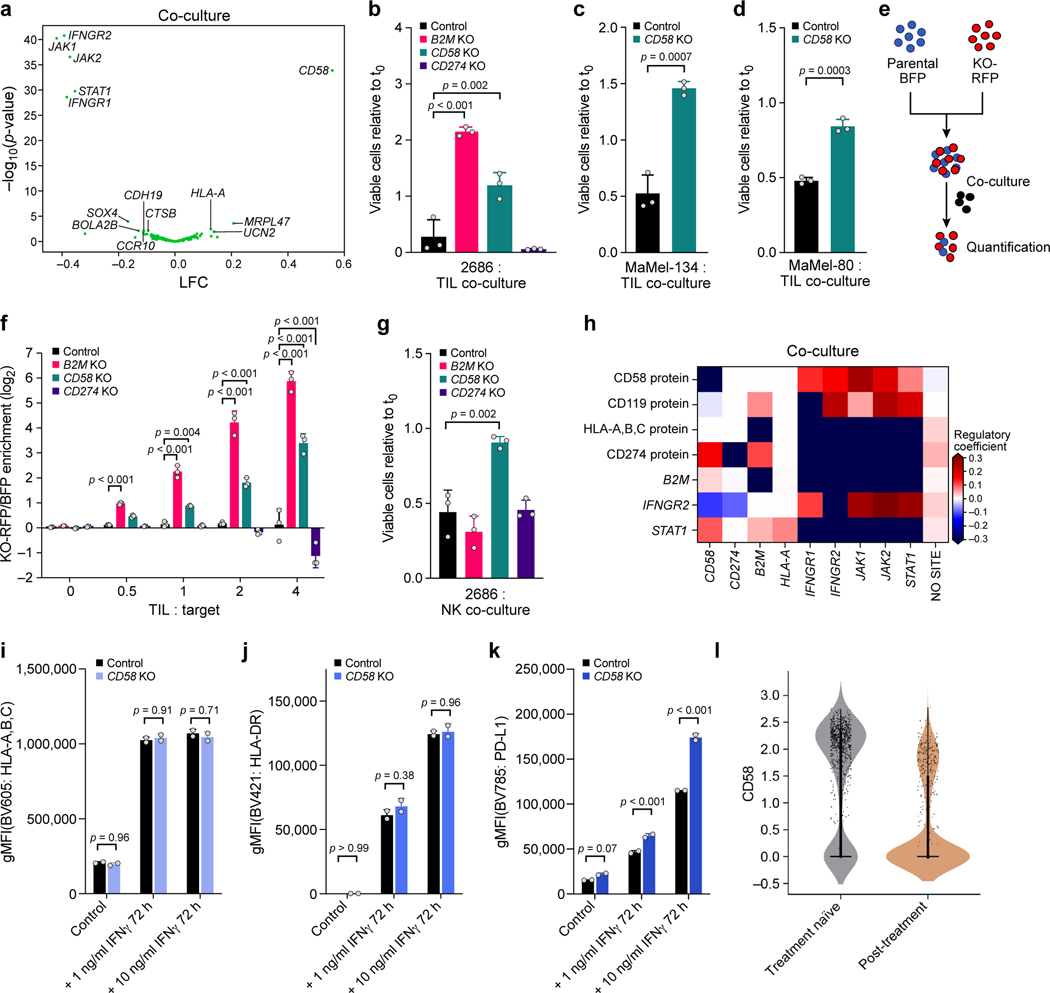
From our analyses across the viability and Perturb-CITE-Seq data, CD58 emerged as a compelling mechanism of immune evasion: KO of CD58 conferred resistance to T cell killing in the viability screen and CD58 RNA/protein were down regulated in cells surviving TIL co-culture. Importantly CD58 is not activated by the IFNγ-JAK/STAT pathway (Fig. 4b), and the CD58 KO conferred a different molecular phenotype than IFNγ-JAK/STAT pathway perturbations, belonged to a distinct module, and did not impact the expression of antigen presentation genes (Fig. 5a). Thus, CD58 loss may represent a resistance mechanism distinct from IFNγ-JAK/STAT pathway inactivation. CD58 is an adhesion protein typically expressed on the surface of antigen-presenting cells (APCs), where it binds to CD2 on CD8+ T cells and NK cells22. Little is known about the potential role of CD58 in cancer, partly because there is no known mouse homolog to study it in pre-clinical models. Thus, patient-derived melanoma/TIL co-cultures provide a unique opportunity to study CD58 in the context of human immune evasion.
Figure 5. CD58 loss is a distinct mechanism of immune evasion from TIL and NK-cell mediated killing.
a.CD58 perturbation affects a distinct regulatory program. Change in signature scores of the CD58 regulatory program (x axis, LFC) and its associated significance (y axis, -log10(P-value), Welch’s t test) for each perturbation in the co-culture. b-d. Ratio of viable cancer cells (y axis, relative to t0) in co-culture models of control, CD58 KO, B2M KO and CD274 KO cells. e. Competition assay schematic. BFP-labeled parental cells and RFP-labeled KO cells are co-cultured with TILs and the RFP/BFP ratio is calculated as an estimate of relative fitness. f. Competition assay of parental cells and matched B2M KO, CD58 KO or CD274 KO after 48 hours of co-culture. g. Ratio of viable cancer cells in an NK co-culture model of parental cells compared to matched indicated genotypes. h-k. CD58 perturbation in co-culture does not affect B2M and HLA expression at the RNA and protein level but induces CD274. h. Regulatory effect ( values from the model shown in a; red/blue: perturbation induces/represses gene feature) in Perturb-CITE-Seq on key RNA and protein (CITE) features (rows) when perturbing different genes in the JAK-STAT pathway, CD58 or CD274 (columns). i-k. Surface expression of MHC class-I (i), MHC class-II (j) or CD274 (k) at baseline and after stimulation with different levels of IFNγ for 72 hours, in parental and CD58 KO cells. l. Distribution of expression levels (y axis, log2(TPM+1)) of CD58 RNA in melanoma cells from tumors in patients who were either treatment naïve (gray) or were resected after failure of immunotherapy (tan) in the scRNA-seq data from the ICR-signature discovery cohort9. One-way ANOVA with Tukey post hoc test in b, f, g, two-sided t test in c,d, and i-k. Error bars: Mean ±SD. All experiments were performed in triplicates (except i-k in duplicates) in each of at least two independent experiments.
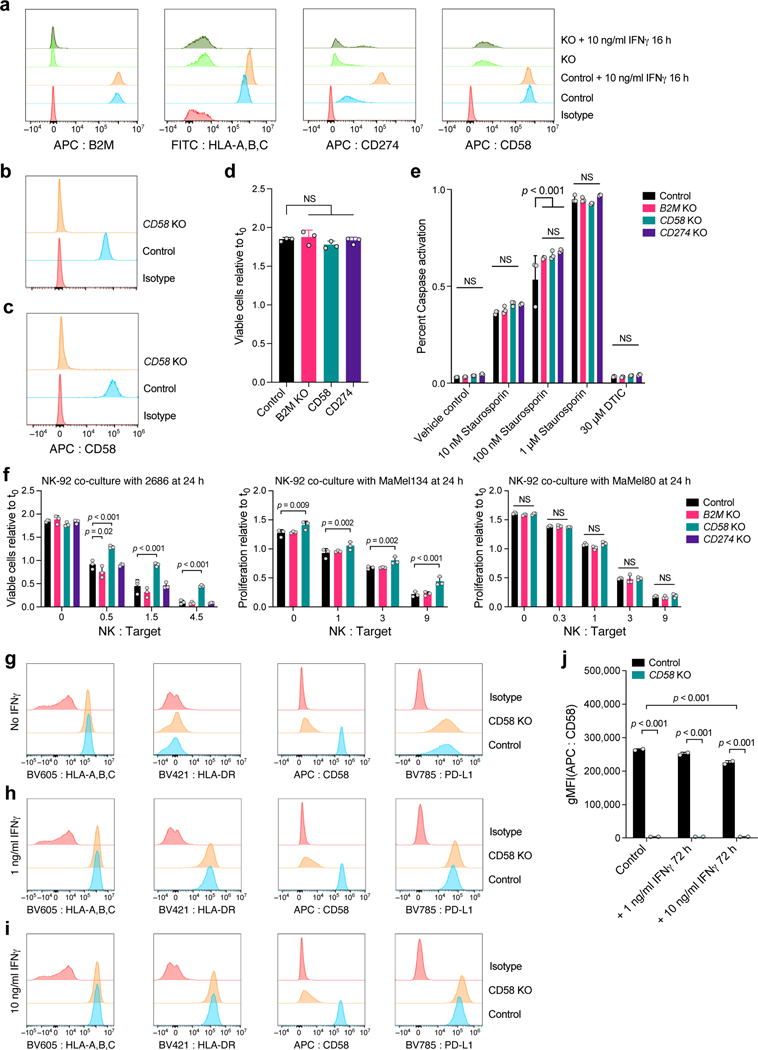
To validate the role of CD58 in immune evasion, we generated individual KO of CD58, B2M or PD-L1 (Methods) in three patient-derived melanoma cell lines and performed co-cultures with their autologous TILs (Extended Data Fig. 7a-c, Methods). In all models, CD58 KO and B2M KO conferred resistance (Fig. 5b-d) while PD-L1 KO sensitized cells to T cell mediated killing (Fig. 5b). Importantly, we excluded the possibility that these differences were due to differences in proliferation rates, (Extended Data Fig. 7d) or apoptotic potential of different KO models (Extended Data Fig. 7e). Next, we performed competition assays where BFP-expressing parental and RFP-expressing KO cell lines were mixed at a 1:1 ratio and co-cultured together with TILs in the same well (Fig. 5e). Both CD58 KO and B2M KO cells had a strong competitive advantage over CD274 KO and parental cell lines (Fig. 5f). Loss of CD58 also conferred resistance to NK cell mediated killing (Fig. 5g, Extended Data Fig. 7f, Supplementary Note).
Loss of CD58 is an orthogonal mechanism of immune evasion
Because CD58 KO conferred immune evasion from both T and NK cells, we hypothesized that its mechanism of action was independent of antigen presentation via MHC. Notably, in our Perturb-CITE-Seq data CD58 KO did not significantly alter the level of the B2M transcript or MHC Class I protein (encoded by HLA-A) (Fig. 5h). Using flow-cytometry, we show that compared to parental cells, CD58 KO did not alter expression of MHC proteins at baseline or their induction in response to IFNγ (Fig. 5i,j). Our Perturb-CITE-Seq data also suggested that CD58 KO led to increased expression of PD-L1 (Fig. 5h). Using flow-cytometry, we confirmed that stimulation with low- or high-dose IFNγ resulted in higher levels of PD-L1 protein in CD58 KO cell lines compared to parental control (Fig. 5k), suggesting that upregulation of PD-L1 could contribute to immune evasion in CD58 KO in T cell co-culture.
Conversely, neither B2M nor HLA-A KO impacted CD58 protein levels in our Perturb-CITE-Seq screen (Fig. 5h, Extended Data Fig. 7a). Indeed, defects in the IFNγ-JAK/STAT nodes led to increased CD58 RNA and protein expression (Fig. 4b, 5h), and stimulation with IFNγ (at 1 ng or 10 ng/mL) did not increase protein abundance of CD58 (Extended Data Fig. 7g-j, Fig. 3b), suggesting that CD58 is not induced via the IFNγ pathway.
Finally, we determined the level of mRNA expression of CD58 in melanoma patients with resistance to ICI. Compared to malignant cells from treatment-naïve patients, ICI resistant patients had a significantly lower expression of CD58 (Fig. 5l).
Together, these data suggest that downregulation or loss of CD58 represents a clinically relevant immune evasion mechanism that is orthogonal to previously described ones involving defects in antigen presentation and IFNγ response.
DISCUSSION
In this study, we developed Perturb-CITE-Seq, a pooled CRISPR/Cas9 screen with multi-modal single-cell profiling readout, and used it in patient-derived tumor-immune models to dissect cancer cell mediated modulators of T cell mediated killing. A proof of concept study developed ECCITE-seq to show simultaneous detection of surface proteins, RNA, and gRNAs in single cells5, and our work presents a parallel methodology, a large genetic screen utilizing multi-modal single cell protein and RNA detection, and a computational framework for integrated multi-modal perturbation analysis. We used a broadly applicable computational and statistical framework for integrated analyses of such screens, which accounts for key co-variates, including cell quality and cell cycle status, focuses on cells harboring impactful perturbations, generates a detailed regulatory model, and partitions it to interpretable co-functional modules that control co-regulated programs.
Our rich, multi-modal screen is critical to dissect which genes are part of a shared mechanism of resistance, which represent distinct mechanisms, and through which gene programs each act. First, Perturb-CITE-Seq data readily identified major known clinical mechanisms of immune evasion, especially perturbations and their associated cell programs in the IFNγ pathway and downregulation or defects of the antigen-presentation axis. Perturbations of different nodes within IFNγ pathway led to highly converging molecular phenotypes, irrespective of the level of the defect. This is consistent with genomic profiling in patients with resistance to either anti-CTLA-427 or anti-PD-1 therapy7, and further emphasizes the role of IFNγ in T cell mediated anti-tumor immunity. Some of the genes down-regulated by IFNγ pathway perturbations, such as CXCL10 and CXCL11, are genes whose downregulation was previously associated with immune evasion, suggesting that these do not represent a salient mechanisms of immune evasion. In contrast, other genes whose perturbation enhanced immune evasion in our screen (e.g., CD58, CD59) appear to reflect distinct mechanism, both because their expression was not impaired by IFNγ signaling defects, and because the molecular phenotype following their perturbation is distinct. Because many gross phenotypes in biology (immune evasion, cell cycle, viability, differentiation, etc.) are affected by multiple pathways and involve interactions between cells, this approach should provide a powerful solution in other systems.
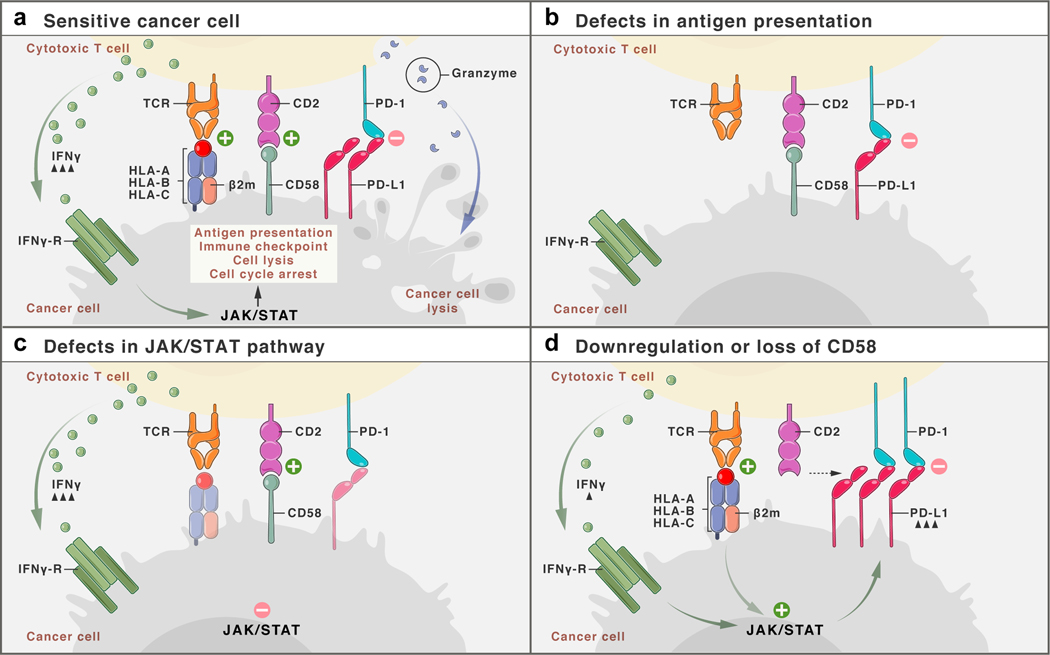
In particular, our Perturb-CITE-Seq and viability screens highlighted CD58, as a gene whose knockout enhances resistance to T cell mediated killing, a member of a co-functional module with a distinct phenotype, and a target whose RNA and protein levels are reduced in co-culture, but are not activated by the IFN γ pathway. Because there is no known mouse homolog of CD58, this target was not discovered in previously reported CRISPR screens performed in mouse models11–13. While it was a top ranking hit in an immunotherapy screen in a human-engineered system10, its role remained poorly understood. In patients with diffuse-large B cell lymphoma (DLBCL)28, CD58 mutations were concurrent with mutations in B2M leading with loss of antigen presentation. Since the two mutations frequently occurred concurrently, it remained unclear whether these are independent mechanisms of immune escape. Our experiments and analysis show that loss of CD58 confers immune evasion to a similar extent as loss of MHC Class I expression itself (through B2M KO), but through an independent path, and without impacting the expression of antigen presentation genes and proteins (Extended Data Fig. 8). Furthermore, PD-L1 is upregulated in CD58 KO, suggesting that CD58 loss could confer immune evasion directly (reduced adhesion) or indirectly (inhibitory PD-L1) (Extended Data Fig. 8). CD58 KO also impacted NK-mediated killing (Fig. 5g), which may have implications for NK cell-based therapies in tumors with loss of antigen presentation. Notably, the CD58/CD2 axis is a potent co-stimulatory pathway in CD8+ T cells that lack expression of CD28 (CD8+CD28- T cells)29, which are common in the tumor-microenvironment and peripheral blood of solid tumor patients30, and were the predominant T cells in our Perturb-CITE-Seq screen (Extended Data Fig. 4b). We speculate that CD58 downregulation or loss may contribute to immune evasion through distinct mechanisms, including loss of T cell co-stimulation, increased expression of co-inhibitory PD-L1, and possibly reduced T cell infiltration due to impaired T cell adhesion. Due to the complex regulation of PD-L1 protein stability, and the poorly understood kinetics of CD58 protein, additional studies evaluating the CD58/PD-L1 balance are necessary to dissect their functional relationship.
Our study presents a large-scale CRISPR/Cas9 screen with multi-modal single-cell readouts, providing a general approach, as well as addressing a critical clinical challenge in a unique patient-derived cell culture model system. We recover the landscape of resistance mechanisms to immunotherapies and, guided by our high-dimensional data, validate a novel mechanism of immune resistance. Large-scale multi-modal screens, spanning RNA, proteins, chromatin accessibility and imaging features, should enable unprecedented discovery across diverse biological systems, and detailed dissection of complex cellular and inter-cellular circuits.
METHODS
Patient derived melanoma cell culture
Patient derived melanoma cell lines were grown on non-pyrogenic, polystyrene tissue culture treated plastic ware (Corning, Corning, NY) in Roswell Park Memorial Institute (RPMI) 1640 Medium supplemented with 10% heat-inactivated fetal bovine serum (FBS), GlutaMax, 10 mM HEPES, 10 mg/L Insulin, 5.5 mg/L Transferrin, 6.7 μg/L Sodium Selenite, and 55 μM 2-Mercaptoethanol (all Thermo Fisher Scientific, Waltham, MA) at 37°C and 5% CO2 in a humidified incubator. Melanoma cell line 2686 and matched tumor infiltrating lymphocytes (TILs) were previously derived (under IRB protocol #2004–0069) and provided by MDACC, Texas, USA9,14. Melanoma cell lines Ma-Mel-80d and Ma-Mel-134 and corresponding TILs were provided by UK-Essen, Germany. Melanoma cells tested repeatedly negative for contamination with mycoplasma and other contaminants using PlasmoTest (InvivoGen, San Diego, CA).
Miniaturized imaging-based co-culture assay
104 melanoma target cells expressing NLS-dsRed were seeded per well of a black walled 96-well plate (Corning) and treated for 16h with 1 ng/mL recombinant human Interferon gamma (Peprotech). After 16h, media were replaced with 100 μL full melanoma media without phenol-red containing 4μM Caspase-3/7 activity dye (CellEvent, ThermoFisher). Plates where imaged using a Celigo Imaging Cytometer (Nexcelom, Lawrence, MA) to obtain time point 0 cell counts. TILs were thawed 3 days prior to co-culture and cultured in TIL media with 3,000 IU/IL2 or re-activated on plates coated with 100ng/ml OKT3 in PBS when comparing preactivated TILs to rested TILs. On the day of the assay, TILs were collected, centrifuged and resuspended in TIL media without IL2, counted and increasing ratios of TILs were added to the melanoma target cells to a complete volume of 200 μL per well (final Caspase activity dye = 2 μM) and the co-cultures were incubated at 37°C and 5% CO2 in a humidified incubator. The plates were reimaged 24, 48 and 72h after TIL addition. Viable target cells were counted using Celigo Imaging Cytometer software. First, cells were identified by size and intensity of the NLS-fluorescent protein. Debris was defined by adjusting gating parameters to exclude condensed, late apoptotic cells and Caspase3/7-dye intensity was measured across all cells in the green channel to identify apoptotic cells. Finally, viable cells were defined as viable Cells (Class) = NLS-dsRed positive AND NOT debris size AND NOT Caspase3/7 positive. Viable target cell counts were normalized to the respective well counts on time = 0 using Excel (Microsoft, Redmond, WA) and plotted using GraphPad Prism 8 (GraphPad, San Diego, CA). To investigate the MHC class I dependency of TIL-mediated lysis of melanoma target cells we performed the co-culture experiments in the presence of MHC class I blocking antibody (final concentration = 50 μg/ml, clone W6/32, ThermoFisher) added 2 hours before addition of TILs. To determine the ratio at which MHC Class I blocking antibodies were tested, we tested several TIL:tumor ratios and performed blocking experiments at a ratio with optimal MHC:TCR dependent tumor lysis over potential bystander effects. For mixing studies of single gene knock-outs with wildtype cells, knock-outs were generated in NLS-dsRed target cells and target cells were mixed with unmodified control target cells expressing NLS-BFP. Viable cells were identified as outlined above and fold enrichment was calculated as dsRed(viable)/BFP(viable) and normalized to dsRed(viable)/BFP(viable) in conditions without TILs.
Large-scale co-culture assay for CRISPR/Cas9 viability screen
Melanoma cells were transduced with an ICR-library extended with an equal number of control-sgRNAs to increase power for enrichment detection, as described in library preparation above, and three pellets of 1×10⁶ perturbed target cells were collected on day 7 to later quantify drop-out of essential genes. After 14 days, perturbed melanoma cells were plated in 12 well plates with 1.25×10⁵ cells/well (~900 x guide representation per plate). At the same time, three aliquots of 1×10⁶ melanoma cells were collected to quantify the distribution of sgDNAs at the beginning of the experiment. Cells were treated with 1 ng/ml recombinant human IFNγ (in both treatment and co-culture conditions) or left untreated and incubated at 37°C and 5% CO2 in a humidified incubator. After 16 hours, media were replaced with fresh pre-warmed media without IFNγ. TILs had been thawed three days prior to the experiment and cultured in TIL media supplemented with 3,000 IU/ml rhIL2. On the day of TIL addition, TILs were resuspended, pelleted at 400 x g at 4°C for 5 minutes, resuspended in TIL media without IL2, counted, and added at effector to target ratio ranging from 1:1 to 4:1 to the perturbed IFNγ pretreated melanoma target cells in a final volume of 2 ml. Plates were centrifuged at 400 x g for 5 minutes to ensure cell-to-cell contact and the co-cultures were kept for 48 h at 37°C and 5% CO2 in a humidified incubator. For the untreated control and IFNγ treatment the experiment was set up in triplicate plates. For each of the co-culture ratios one plate was set up. After 48 hours, each plate was washed once with ice cold PBS to remove TILs and dead cells, surviving cells were detached using Accutase, pelleted, and pellets were stored at −80°C until further processing. Surviving target cells on distinct plates containing all conditions as triplicates were counted to quantify target cell killing to verify accurate immune selection pressure as previously determined in the miniaturized co-culture experiments (above). Genomic DNA was extracted and purified from cells using QIAamp DNA Micro Kit (Qiagen 56304) with the user-developed protocol QA43 and no more than ~0.5M cells per column. sgDNA sequences were amplified from genomic DNA for Illumina sequencing in two PCR steps. The first PCR was conducted in parallel 50 μL reactions, ensuring no more than 500ng of genomic DNA template per reaction. Using primers 642F and 643R and NEBNext High-Fidelity 2X PCR Master Mix (NEB M0541L), PCR was run for 10 cycles with the following parameters: 98°C denaturation for 60 sec, 68°C annealing for 30 sec, and 72°C extension for 60 sec. Taking 5 μL of from PCR1 for another 50 μL reaction, using primers 997 and 998 to add Illumina adapters and NEBNext master mix, PCR2 was run for 10 cycles with the following parameters: 98°C denaturation for 15 sec, 62°C annealing for 15 sec, and 72°C extension for 16 sec. With 5μL of PCR2 product, qPCR was conducted with SYBR green and the same primers and parameters as PCR2 to estimate the number of PCR cycles to reach sufficient amplification for Illumina sequencing. With the same primers and parameters as PCR2, additional cycles were run for each reaction as calculated. PCR products were then purified by 1X SPRI and prepared for sequencing on an Illumina HiSeq 2500 instrument in RapidRun mode with custom read 1 (primer 503F). All primer sequences are listed in Supplementary Table 8.
Viability screen analysis
CRISPR/Cas9 screens from genomic DNA were analyzed using MAGeCK and MAGeCKFlute software packages32. Briefly, MAGeCK maps sequencing reads to the reference library of sgDNA and returns the quantity of reads that confidently mapped to each sgDNA sequence without allowing for mismatches. To control for sequencing depth, sgDNA counts are median-normalized. Several metrics were used to evaluate the quality of each sequenced sample, including Gini index, missed gDNAs, and correlation of sgDNA counts between replicates. MAGeCK’s robust rank aggregation (RRA) method was used to discover significantly enriched or depleted genes in test versus control conditions.
Perturb-CITE-Seq co-culture experiment
After 14 days of editing and selection, 1.25×10⁵ Cas9-expressing, ICR-library perturbed melanoma target cells were seeded per well of a 12-well plate (One Plate with 1.5×10⁶ cells total per condition, >1,800x representation). Cells were treated with 1 ng/ml recombinant human IFNγ (in both treatment and co-culture conditions) or left untreated and incubated at 37°C and 5% CO2 in a humidified incubator. After 16 hours, media were replaced with fresh pre-warmed media for the co-culture group and cells of the control and treatment groups were washed once with cold PBS, detached using Accutase (Stem Cell Technologies, Vancouver, Canada), quenched with full cold media, pelleted at 400 x g at 4°C for 5 minutes, resuspended in CITE staining buffer (PBS with 2% BSA and 0.01% Tween-20), filtered through a pre-wetted 70 μM cell strainer (Corning), counted, and 1×10⁶ cells were aliquoted in 1.5 ml DNA LoBind microcentrifuge tubes (Eppendorf, Hamburg, Germany) and pelleted again. Cells were resuspended in 100 μL CITE staining buffer, and 5 μL TruStain FcX blocking antibodies (Biolegend) were added and incubated for 10 minutes on ice. Cells were again pelleted and resuspended in 100μL CITE staining buffer and 5μL of CITE-seq antibody pool (~1:500 final dilution for each antibody) were added to each sample and incubated for 30 min on ice. Nexy, cells were washed for a total of 3 washes with 100μL CITE staining buffer and then processed for scRNA-Seq with 15,000 cells were loaded onto each of 8 channels per condition using the 10x Chromium system with the Chromium Single Cell 3’ Library and Gel Bead kit v3 (10X genomics, Pleasanton, CA) per manufacturer’s instructions.
For the co-culture condition, TILs had been thawed three days prior to the experiment and cultured in TIL media supplemented with 3,000 IU/ml rhIL2. On the day of TIL addition, TILs were resuspended, pelleted at 400 x g at 4°C for 5 minutes, resuspended in TIL media without IL2, counted, and 2.5×10⁵ cells were added in a final volume of 2 ml to the perturbed IFNγ pretreated melanoma target cells (final effector/target ratio = 2:1). Plates were centrifuged at 400 x g for 5 minutes to ensure cell-to-cell contact and the co-cultures were kept for 48 h at 37°C and 5% CO2 in a humidified incubator. After 48 hours, media was removed from the co-culture plates and the cells were washed once with cold PBS and detached as described above. After initial centrifugation, cells were resuspended in ice-cold PBS with 1:500 dilution of Zombi-NIR dead cell stain (Biolegend) and incubated for 15 minutes in the dark on ice. Cells were then washed once with CITE staining buffer, resuspended, filtered, counted, aliquoted and Fc-blocked as described above. CD45-Pacific Blue (HI30, Biolegend, 304022) was included during the CITE antibody staining to label TILs for sorting. After three washes in CITE buffer, cells were again filtered and viable melanoma target cells were sorted using a FACS Aria III with cooling system. Melanoma target cells were identified using cell gating with FSC-A and SSC-A, doublet exclusion using FSC-A and FSC-H, gating on Zombi-NIR dim cells and then gating on CD45 negative, mKATE2 positive target cells. After sorting, cells were centrifuged once at 400 x g for 5 minutes at 4°C, resuspended in CITE staining buffer and 15,000 cells/channel were loaded onto the 10x Chromium system as described above.
Normalization and integration of single-cell data
scRNA-seq count data was normalized to 1,000,000 total counts per cell (transcripts per million), followed by a natural log transformation. CITE-seq data was normalized according to the formula33:
where ca is the UMI counts for antibody a and cc is the UMI counts for its corresponding IgG control c (Supplementary Table 3). The two modalities were integrated by concatenation of their normalized count matrices for further analysis.
Computational model for Perturb-CITE-Seq analysis
To infer a model of gene regulation from Perturb-CITE-Seq data, following initial sgRNA assignment to cells, we performed feature selection. For each of the three conditions (control, co-culture and IFN γ), 1,000 highly variable genes were selected using the Scanpy version 1.4.4 implementation of highly variably gene selection34. In addition, all features from each condition’s 10 most significant Jackstraw PCA programs were included and all 20 CITE antibodies. The union was taken across all conditions resulting in one set of 4,481 features used for each experimental condition.
Next, for each condition separately, we learned a linear model to predict the effect of each sgRNA on each feature using the Scikit-learn implementation35 of elastic net regularization with the following parameters: l1_ratio = 0.5, alpha = 0.0005, max_iter = 10000.
Fit quality was assessed by correlation of model residuals. Inclusion as covariates of cell quality (defined as the total number of UMIs in each cell) and cell cycle state (assigned with Scanpy’s implementation of scoring cell cycle genes34) improved the fit. Following the first elastic net regularization, an expectation maximization (EM)-like procedure was run along the columns of the sgRNA assignment matrix to account for false positive sgRNA assignments and sgRNAs that did not perturb their target, using our previously published MIMOSCA framework1. Briefly, each cell is modeled as coming from either a perturbed or unperturbed population. For each sgRNA, the elastic net regularization is rerun with perturbed cells assigned to the unperturbed population. The model is run twice: once with cells assigned to the perturbed population, and once with the cells assigned to the un-perturbed population. A sum of squares error (SSE) is calculated for each of these two models. The difference in SSE between these two models is transformed to a probabilistic estimate that the cell originated from the perturbed population via a logistic function. If the SSE is far greater in the model with the cell assigned to the perturbed population, the sgRNA assignment is updated to be near zero. Conversely, if the SSE is larger in the model with the cell assigned to the un-perturbed population, the sgRNA assignment is maintained near one. Running this procedure across all sgRNAs effectively transforms the binary sgRNA assignment matrix to a probabilistic estimate of successful perturbation. Following this procedure, elastic net is rerun with the probabilistic sgRNA assignment matrix. The procedure is iterated only once (and thus is not a full EM). A full EM approach is not guaranteed to converge to a global minimum in a high-dimensional linear regression problem with noisy and missing data36. Empirically, adding a second iteration had only a very modest effect on sgRNA/target assignments. For example, in the co-culture condition, a single iteration of EM adjusts the assignment of 1,741 targets to near zero (confidence that the cell contains an effective sgRNA < 25%), while an additional iteration only adjusted 97 target-cell assignments.
The regulatory matrix fit by this procedure was used to assess concordant effects across sgRNAs with the same target by calculating the pairwise correlation between the regulation profiles for sgRNAs across all features. The Pearson correlation of sgRNAs with different targets was then used to calculate a synthetic null distribution of discordant perturbations, and the pairwise Pearson correlation of sgRNAs with the same target was transformed into an empirical p-value, followed by a Benjamini-Hochberg multiple hypothesis False Discovery Rate (FDR) correction. To aggregate from sgRNAs to the gene level, sgRNAs with correlated activity were mapped to their target gene to construct a sgRNA to target dictionary. A lenient FDR threshold of 0.50 was used due to the large feature space and the sparsity of elastic net regularization. This results in 141, 183, and 181 gene-level targets (of 248 total target genes) for the control, IFNγ, and co-culture conditions, respectively. All non-targeting sgRNAs were collapsed to the same target while intergenic sgRNAs were kept separate as individual negative controls. Note that IFNγ-JAK/STAT perturbations were removed from Fig. 4c for visualization purposes only. The computational pipeline was run in its entirety with all perturbations. Removing these highly impactful perturbations allowed clustering features into programs based on their response to perturbations across our target library.
The sgRNA assignment matrix was mapped to a binary target assignment matrix using the sgRNA to target dictionary for the next iteration of elastic net regularization. An EM-like procedure was then run again according as above, except at the target rather than sgRNA level. A final elastic net regularization was run following the reassignment step.
A permutation test was used to assess the empirical significance of regulatory coefficients as we previously described1. Briefly, for each target, the assignment of cells to targets was randomly permuted, followed by recomputing the linear model. This procedure was run separately for each target, each with 10,000 random permutation, to calculate target-wise null distributions of coefficient values. The coefficients of the model with correct cell assignment are then transformed to empirical p values. This procedure partially corrects for the bias of sample size and effect size in regulatory coefficients, and enables direct comparison of the empirical p values across targets.
Empirical p value matrices were clustered using the Scikit-learn implementation of k-means clustering. The number of clusters was determined using the “elbow method” based on the inertia of the fit sweeping the number of clusters from 2 to 20.
Single gene knock-out in patient-derived cells using nucleofection of Cas9 ribonucleoprotein
Virus free knock-out cell lines of human melanoma cell lines were generated using nucleofection of Cas9 ribonucleoproteins (RNP). Target sequences were derived from the original ICR library used to generate the CROP-Seq library and are listed individually for the perturbed targets in Supplementary Table 8. To form RNPs, equimolar ratios of crRNA (IDT, Coralville, IA) were incubated with tracrRNA (IDT) at 95°C for 5 minutes in nuclease-free duplex buffer and thereafter cooled to room temperature to from gRNA complexes. Recombinant Cas9 enzyme (MacroLab, UC Berkeley, CA) was mixed with gRNA at 1:10 molar ratio and incubated at 37°C for 15 minutes to form RNP complexes. In the meantime, human melanoma cell lines were detached, washed once with PBS, and 5×10⁴ cells were resuspended in 20 μL SF electroporation buffer prepared with SF supplement (Lonza, Basel, Switzerland). 3 μL RNP complex solution was mixed with the cells and the cells were nucleofected using program DJ-110 on a 4D-Nucleofector (Lonza) with 16-well strips. Cells were immediately recovered in full melanoma media, seeded in 12 well plates and expanded.
Flow cytometry analysis of surface proteins after IFNγ stimulation
2686 control and CD58 KO cells were stimulated with 1–10 ng/ml IFNγ for 72 hours and then detached with Accutase. Dead cells were labeled using Zombie-NIR (Biolegend) according to the manufacturer’s instructions. Surface antigens were stained on ice using the following antibodies (all Biolegend): HLA-DR-BV421 (L243), HLA-A,B,C-BV605 (W6/32), CD274BV785 (29E.2A3), and CD58-APC (TS2/9). Cells were fixed in fixation buffer (Biolegend) and analyzed on an Aurora Spectral Analyzer (Cytek Biosciences). The samples were than analyzed using FlowJo (FlowJo, Ashland, OR). For quantification of surface proteins. cells were gated based on FSC and SSC, single cells were selected using FSC-A and FSC-H and viable cells were selected using low Zombie-NIR fluorescence. To compare signal intensities of surface markers, geometric mean fluorescence intensity (gMFI) was used and all samples were run in duplicates.
Extended Data
Extended Data Fig. 1. Establishment of patient derived co-culture model.
a, Approach for imaging-based quantification of TIL-mediated killing of melanoma target cells. Plates were imaged at 0, 24, 48 and 72 hours, and viable cell counts were normalized to starting counts to quantify outgrowth of target cells. b-d, Sorting and gating strategy to isolate and expand TIL cultures prior to co-culture. b. TILs grown in IL2 or OKT3-stimulated for 72 hours and analyzed after 4 hours of PMA-I-stimulation. FMO, fluorescent-minus-one control b. TILs from 2686 retain ability to induce IFNγ and TNFa, and OKT-3 reactivation leads to an increase in Granzyme-B production compared to TILs grown in IL2 alone. c, MaMel-134 TILs produce IFNγ, TNFa, and Granzyme-B. d, MaMel-80 TILs produce IFNγ, TNFa, and Granzyme-B. e-h. Impact of time, dose, IFNγ pre-treatment, MHC-I blocking, and OKT3 on TIL-mediated killing in the co-culture system from patient 2686. Ratio of viable cancer cells (y axis, relative to t0) in co-cultures: (e) after different time points of co-culture at increasing TIL:cancer cell ratios (x axis), where TILs were restimulated with immobilized OKT3 for 72 h prior to co-culture; f, after 48 h of co-culture, where cancer cells were pre-treated with 1 ng/ml IFNγ for 16 hours (without prior OKT3-reactivation); g, after 48 hours of co-culture as in (f) but using OKT3-reactivated TILs. h, Specificity of IFNγ pre-treatment approach. Ratio of viable allogenic cancer cells (y axis, relative to t0) in different culture conditions with or without IFNγ pre-treatment (x axis) grown from 0 to 72 hours (color bars) with 2686 TILs with or without prior reactivation with OKT3. For e-h, we performed a one-way ANOVA with Tukey post hoc test. Error bars: Mean±SD. All experiments were performed in triplicates in each of at least two independent experiments.
Extended Data Fig. 2. Generation of Cas9 transgenic patient derived lines and sgDNA library titration.
a, High Cas9 activity in Cas9 transgenic line. Flow cytometry of EGFP levels in Cas9-expressing and parental melanoma cells from patient 2686 transduced with lentivirus encoding EGFP and an EGFP targeting sgRNA at MOI <1 and selected using puromycin. b-d, Transduction of sgDNA lentiviral library to Cas9 transgenic line. b, Proportion of mKATE2+ cells prior to selection (x axis) and survival after puromycin selection (y axis) in 2686 melanoma Cas9 transgenic cells transduced with the ICR library. Line: Linear regression, Pearson R2=0.90. c, Percentage of mKate2+ cells (y axis) in 2686 melanoma Cas9 transgenic cells transduced with the ICR library at virus dilutions (x axis). Red: Dilution used for the Perturb-CITE-seq screen. d. Proportion of cells estimated to be infected by one virus (y axis) at different dilutions of the ICR library (x axis). Red: Dilution used for the Perturb-CITE-seq screen.
Extended Data Fig. 3. CRISPR/Cas9 viability screen in the co-culture system.
a, Dose-response killing in the co-culture experiment validates target killing range. Percent of surviving cells relative to IFNγ pretreated target cells (y axis) in different co-culture conditions (x axis) from a plate run in parallel to the viability and Perturb-CITE screens, with triplicate wells for each condition. One-way ANOVA with Dunnet post-hoc test. Error bars: Mean±SD. b,c, Screen reproducibility across triplicates. Number of reads detected (x, y axis) for each sgDNA (dots) when comparing each pair within triplicate experiments (color legend) in pre-treated day 7 (b) or day 14 (c). Pearson correlation coefficients are noted in the color legend. d-f, Identification of essential genes and genes affecting resistance to TIL mediated killing. Relative depletion (log2(FC), x axis) for each individual sgDNA (red bar) of the top20 target genes by MAGeCK analysis (rows) (n = 3 sgDNAs/target gene, Methods) on day 7 (without TILs, to recover essential genes, d), day 17 of 2:1 TIL:cancer cells co-cultures, comparing control cells (e), or day 17 of IFNγ treated cells (f, no co-culture). Bold lettering indicates significantly enriched / depleted target.
Extended Data Fig. 4. Characterization of different immune pressures by single-cell RNA and protein profiles.
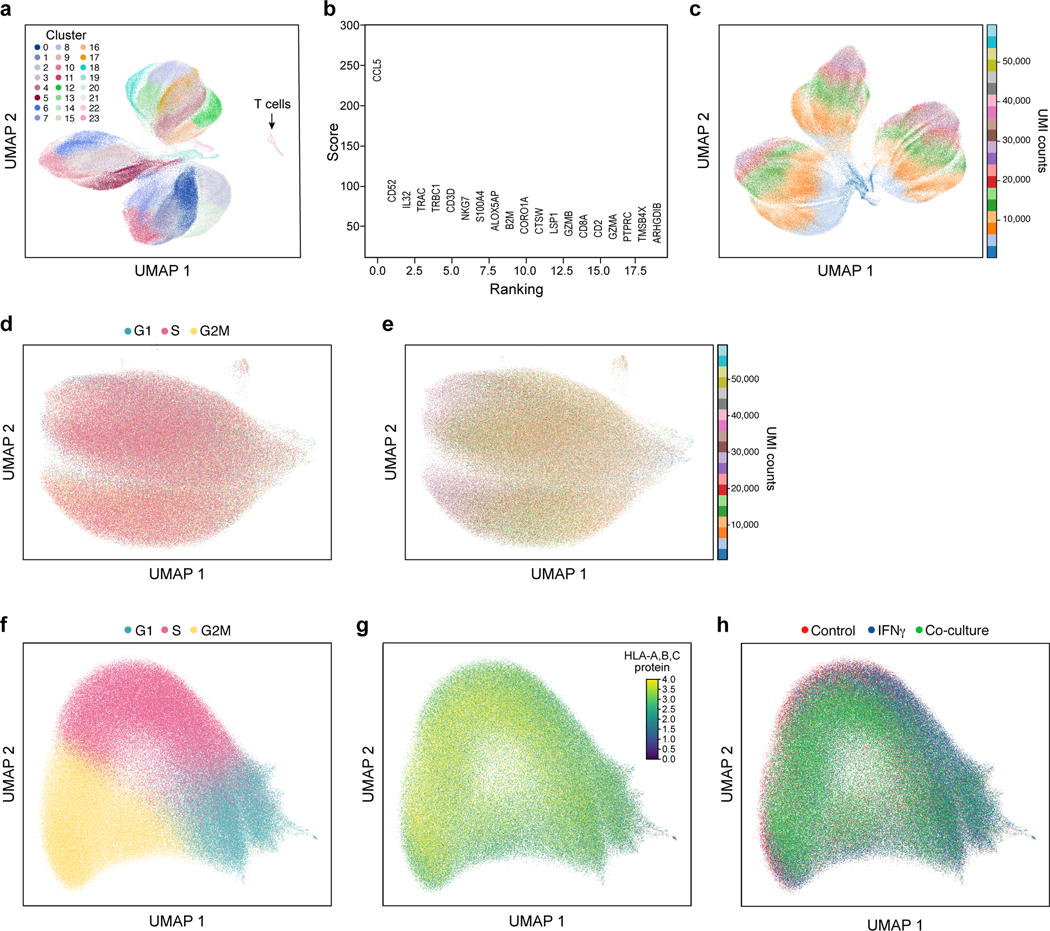
a,b, Removal of profiled T cells. a. UMAP embedding of single cell RNA-Seq profiles from the Perturb-CITE-seq screen, colored by unsupervised cluster assignment34 (Methods). b, A permutation test was used to score marker genes associated with each cluster shown in (a)35. Score (y axis, permutation test, Methods) of marker genes (x axis) associated with the distinct cluster marked by an arrow in (a), include canonical T cell markers. c, Cell complexity affects scRNA-Seq profiles. UMAP embedding of scRNA-Seq profiles of cancer cells only, colored by UMI count bins. d,e, CITE profiles of 20 cell surface proteins do not reflect cell cycle phases (d) or UMI count (e). UMAP embedding of cells (dots) by CITE-seq profiles (dots) colored by cell cycle phase, as scored from scRNA-Seq of the cells, and (e) UMAP of cells by count bins (indicated in legend). f-h, Limited relation between the cell cycle and immune pressure or phenotype. UMAP embedding of cells (dots) based only on RNA expression on cell cycle genes colored by (f) cell cycle phase based on the cell’s RNA profile; (g) MHC protein levels from the CITE signal of the cell; or (h) condition.
Extended Data Fig. 5. Learning expression programs in different conditions.
a-f, Identification of programs by jackstraw PCA in each condition. a-c. Explained variance (y axis) by each principal component (x axis) for PCA performed on control (a), IFNγ-treated (b), or co-culture (c) Perturb-CITE-seq data. d-f, Number of features (y axis) for each jackstraw program (x axis) for models learned on control (a), IFNγ-treated (b), or co-culture (c) Perturb-CITE-seq data. Dotted red line: cutoff for programs considered in further analysis. g, G2M program learned from control dataset. UMAP embedding of cells (dots) by scRNA-seq profiles, with cells colored by the gene set score (color bar) (Methods) of a G2M cell cycle control program (compare to Fig. 3f) (Methods). h, Identifying related programs across conditions. Jaccard index (color bar) for each pair of programs across all 30 programs (rows).
Extended Data Fig. 6. Addressing cell cycle and complexity covariates by the Perturb-CITE-seq model and impact of targeting vs. non-targeting guides.
a, Estimated Multiplicity of infection (MOI). Distribution of cells (%, y axis) at different estimated MOI (x axis) in each experimental condition (color legend) as determined from the guide dictionary (Methods). b,c, Improved model fit following accounting for cell state as a covariate. Pearson correlation (color bar) between the residuals from the linear model fit for each regulated feature (columns) from models learned without (b) or with (c) cell state covariates accounting for the cell cycle and cell complexity.
Extended Data Fig. 7. Role of CD58 in resistance to T cell mediated killing and regulation of PD-L1.
a, Validation of CRISPR/Cas9 KO (and unperturbed control) melanoma cells. a, Distribution of fluorescent intensity of CD58 (APC-CD58), B2M (APC-B2M), MHC-I (FITC-HLA-A,B,C), PD-L1 (APC-CD274) or staining with isotype control, without or with IFNg stimulation, in 2686 melanoma cells. b, Validation of CD58 KO MaMel-134, and c, MaMel-80 melanoma cells. d, Comparable growth of control and KO cells. Ratio of viable cells relative to timepoint 0 (y axis) for control and B2M KO, CD58 KO or CD274 KO melanoma cells from patient 2686 (x axis). e, Comparable induction of apoptosis in response to Staurosporin and resistance to DTIC in control and KO melanoma cells. Percent of cells inducing Caspase 3/7 (y axis) in control and B2M KO, CD58 KO or CD274 KO melanoma cells (color code) from patient 2686 in different treatment conditions (x axis). f, Co-culture experiments of three melanoma cells lines (2686, MaMel134 and MaMel80) at increasing ratios of NK cells and tumor cells with different genotypes (including CD58 KO, B2M KO in all models, and additionally CD274 KO in 2686). g-j, CD58 perturbation in co-culture does not affect B2M and HLA expression at the RNA and protein level but induces CD274. Distribution of fluorescent intensity by flow cytometry (corresponding to Fig. 5i-k) of MHC Class I and II, CD58, and PD-L1 in parental (control) and CD58 KO lines at baseline (g) and after 72 hours of stimulation with either 1 ng IFNγ (h) or 10 ng IFNγ (i), and summary of the impact of IFNγ on CD58 protein abundance after 72 hours. In all experiments, we used a one-way ANOVA with Tukey post hoc test. Error bars: Mean ±SD. All experiments were performed in triplicates in each of at least two independent experiments.
Extended Data Fig. 8. Known mechanisms of immune evasion and distinct role of CD58.
a, Schematic representation of interactions between T cell and cancer cells. At baseline, TCR stimulation via peptide-loaded MHC Class I and through CD58:CD2 co-stimulation results in production of cytokines (such as IFNγ, Granzymes), which lead to activation of the IFNγ-JAK/STAT-pathway that determine the cell fate and expression of surface proteins. b, In the absence of antigen presentation, either due to genetic defects or downregulation of the antigen presentation machinery, cancer cells survive. c, Defects in the JAK/STAT-pathway (such as deleterious mutations in JAK genes) result in poor response of cancer cells to T cell secreted IFNγ and promote cancer cell survival. d, Loss or downregulation of CD58 does not interfere with antigen presentation or JAK/STAT-signaling per se, but reduces T cell co-stimulation while simultaneously promoting increased co-inhibitory signaling via PD-L1, and therefore overall confers resistance to T cell mediated killing.
Supplementary Material
Acknowledgements
This work was supported by the Koch Institute-Dana-Farber/Harvard Cancer Center Bridge Project Grant (Av.R., B.E.J., B.I.), the Klarman Cell Observatory (Av.R., O.R.R.), HHMI (Av.R.), NHGRI Center of Excellence in Genome Science (CEGS) the Center for Cell Circuits (Av.R.), National Institute of Health (NIH) grants K08CA222663 (B.I.) and U54CA225088 (B.I.), the Burroughs Wellcome Fund Career Award for Medical Scientists (B.I.), the Louis V. Gerstner, Jr. Scholars Program (B.I.) and the Velocity Fellow Program (B.I.). P.I.T. was supported by NIH F32AI138458. P.H. was supported by NIH T32GM007367. L.J.A. was supported by a CRI Irvington Fellowship, the Eric and Wendy Schmidt postdoctoral program and the Burroughs Wellcome Fund Career Award at the Scientific Interface. K.W.W. was supported by the Ludwig Center for Cancer Research at Harvard and NIH grants R01CA238039 and P01CA163222. B.C. was supported by the Broad Fellows. Av.R was an Investigator of the Howard Hughes Medical Institute.This research was funded in part through the NIH/NCI Cancer Center Support Grant P30CA013696 at Columbia University.
Conflict of interest statement. Av.R. is a co-founder and equity holder of Celsius Therapeutics, an equity holder in Immunitas, and until July 31, 2020 was an SAB member of ThermoFisher Scientific, Syros Pharmaceuticals, Neogene Therapeutics and Asimov. From August 1, 2020, Av.R. is an employee of Genentech. B.I. is a consultant for Merck and Volastra Therapeutics. B.E.J. is on the Scientific Advisory Board (SAB) of Checkpoint Therapeutics. From November 16, 2020 K.G.S. and O.R.-R. are employees of Genentech. As.R. is a consultant to eGenesis, a SAB member of NucleAI and an equity holder in Celsius Therapeutics. From August 31, 2020, As.R. is an employee of AstraZeneca. K.W.W. serves on the scientific advisory board of TCR2 Therapeutics, T-Scan Therapeutics, SQZ Biotech, Nextechinvest and receives sponsored research funding from Novartis. K.W.W. is a co-founder of Immunitas, a biotech company. These activities are not related to the research reported in this publication. C.B. is on the SAB of Myst Therapeutics.
Footnotes
Data availability
Processed data are available via the single-cell portal: https://singlecell.broadinstitute.org/single_cell/study/SCP1064/multi-modal-pooled-perturb-cite-seq-screens-in-patient-models-define-novel-mechanisms-of-cancer-immune-evasion. Raw data are available on the Broad Data Use and Oversight System https://duos.broadinstitute.org.
Code availability
Code is available on https://github.com/klarman-cell-observatory/Perturb-CITE-seq.
References
- 1.Dixit A. et al. Perturb-Seq: Dissecting Molecular Circuits with Scalable Single-Cell RNA Profiling of Pooled Genetic Screens. Cell 167, 1853–1866.e17 (2016). [DOI] [PMC free article] [PubMed] [Google Scholar]
- 2.Adamson B. et al. A Multiplexed Single-Cell CRISPR Screening Platform Enables Systematic Dissection of the Unfolded Protein Response. Cell 167, 1867–1882.e21 (2016). [DOI] [PMC free article] [PubMed] [Google Scholar]
- 3.Datlinger P. et al. Pooled CRISPR screening with single-cell transcriptome readout. Nat. Methods 14, 297–301 (2017). [DOI] [PMC free article] [PubMed] [Google Scholar]
- 4.Jaitin DA et al. Dissecting Immune Circuits by Linking CRISPR-Pooled Screens with Single-Cell RNA-Seq. Cell 167, 1883–1896.e15 (2016). [DOI] [PubMed] [Google Scholar]
- 5.Mimitou EP et al. Multiplexed detection of proteins, transcriptomes, clonotypes and CRISPR perturbations in single cells. Nat. Methods 16, 409–412 (2019). [DOI] [PMC free article] [PubMed] [Google Scholar]
- 6.Sharma P & Allison JP The future of immune checkpoint therapy. Science 348, 56–61 (2015). [DOI] [PubMed] [Google Scholar]
- 7.Zaretsky JM et al. Mutations Associated with Acquired Resistance to PD-1 Blockade in Melanoma. New England Journal of Medicine 375, 819–829 (2016). [DOI] [PMC free article] [PubMed] [Google Scholar]
- 8.Sade-Feldman M. et al. Resistance to checkpoint blockade therapy through inactivation of antigen presentation. Nature Communications 8, 1136 (2017). [DOI] [PMC free article] [PubMed] [Google Scholar]
- 9.Jerby-Arnon L. et al. A Cancer Cell Program Promotes T Cell Exclusion and Resistance to Checkpoint Blockade. Cell 175, 984–997.e24 (2018). [DOI] [PMC free article] [PubMed] [Google Scholar]
- 10.Patel SJ et al. Identification of essential genes for cancer immunotherapy. Nature 548, 537–542 (2017). [DOI] [PMC free article] [PubMed] [Google Scholar]
- 11.Kearney CJ et al. Tumor immune evasion arises through loss of TNF sensitivity. Science Immunology 3, (2018). [DOI] [PubMed] [Google Scholar]
- 12.Pan D. et al. A major chromatin regulator determines resistance of tumor cells to T cell-mediated killing. Science 359, 770–775 (2018). [DOI] [PMC free article] [PubMed] [Google Scholar]
- 13.Manguso RT et al. In vivo CRISPR screening identifies Ptpn2 as a cancer immunotherapy target. Nature 547, 413–418 (2017). [DOI] [PMC free article] [PubMed] [Google Scholar]
- 14.Peng W. et al. Loss of PTEN Promotes Resistance to T Cell-Mediated Immunotherapy. Cancer Discov 6, 202–216 (2016). [DOI] [PMC free article] [PubMed] [Google Scholar]
- 15.Mbofung RM et al. HSP90 inhibition enhances cancer immunotherapy by upregulating interferon response genes. Nat Commun 8, 451 (2017). [DOI] [PMC free article] [PubMed] [Google Scholar]
- 16.McKenzie JA et al. The Effect of Topoisomerase I Inhibitors on the Efficacy of T-Cell-Based Cancer Immunotherapy. J Natl Cancer Inst 110, 777–786 (2018). [DOI] [PMC free article] [PubMed] [Google Scholar]
- 17.Huang L. et al. The RNA-binding Protein MEX3B Mediates Resistance to Cancer Immunotherapy by Downregulating HLA-A Expression. Clin Cancer Res 24, 3366–3376 (2018). [DOI] [PMC free article] [PubMed] [Google Scholar]
- 18.Stoeckius M. et al. Simultaneous epitope and transcriptome measurement in single cells. Nat Methods 14, 865–868 (2017). [DOI] [PMC free article] [PubMed] [Google Scholar]
- 19.Veillette A & Chen J. SIRPα–CD47 Immune Checkpoint Blockade in Anticancer Therapy. Trends in Immunology 39, 173–184 (2018). [DOI] [PubMed] [Google Scholar]
- 20.Myers LM et al. A functional subset of CD8 + T cells during chronic exhaustion is defined by SIRPα expression. Nature Communications 10, 794 (2019). [DOI] [PMC free article] [PubMed] [Google Scholar]
- 21.Zhang W. et al. Advances in Anti-Tumor Treatments Targeting the CD47/SIRPα Axis. Front. Immunol. 11, (2020). [DOI] [PMC free article] [PubMed] [Google Scholar]
- 22.Arulanandam AR et al. The CD58 (LFA-3) binding site is a localized and highly charged surface area on the AGFCC’C” face of the human CD2 adhesion domain. Proc Natl Acad Sci U S A 90, 11613–11617 (1993). [DOI] [PMC free article] [PubMed] [Google Scholar]
- 23.Pardoll DM The blockade of immune checkpoints in cancer immunotherapy. Nat Rev Cancer 12, 252–264 (2012). [DOI] [PMC free article] [PubMed] [Google Scholar]
- 24.Restifo NP, Dudley ME & Rosenberg SA Adoptive immunotherapy for cancer: harnessing the T cell response. Nat. Rev. Immunol. 12, 269–281 (2012). [DOI] [PMC free article] [PubMed] [Google Scholar]
- 25.Chen Q, Sun L & Chen ZJ Regulation and function of the cGAS-STING pathway of cytosolic DNA sensing. Nat. Immunol. 17, 1142–1149 (2016). [DOI] [PubMed] [Google Scholar]
- 26.Agrawal S & Kandimalla ER Intratumoural immunotherapy: activation of nucleic acid sensing pattern recognition receptors. Immuno-Oncology Technology 3, 15–23 (2019). [DOI] [PMC free article] [PubMed] [Google Scholar]
- 27.Gao J. et al. Loss of IFNγ- Pathway Genes in Tumor Cells as a Mechanism of Resistance to Anti-CTLA-4 Therapy. Cell 167, 397–404.e9 (2016). [DOI] [PMC free article] [PubMed] [Google Scholar]
- 28.Challa-Malladi M. et al. Combined genetic inactivation of β2-Microglobulin and CD58 reveals frequent escape from immune recognition in diffuse large B cell lymphoma. Cancer Cell 20, 728–740 (2011). [DOI] [PMC free article] [PubMed] [Google Scholar]
- 29.Leitner J, Herndler-Brandstetter D, Zlabinger GJ, Grubeck-Loebenstein B & Steinberger P. CD58/CD2 Is the Primary Costimulatory Pathway in Human CD28−CD8+ T Cells. The Journal of Immunology 195, 477–487 (2015). [DOI] [PubMed] [Google Scholar]
- 30.Strioga M, Pasukoniene V & Characiejus D. CD8+ CD28− and CD8+ CD57+ T cells and their role in health and disease. Immunology 134, 17–32 (2011). [DOI] [PMC free article] [PubMed] [Google Scholar]
- 31.Boyeau P. et al. Deep Generative Models for Detecting Differential Expression in Single Cells. bioRxiv 794289 (2019) doi: 10.1101/794289. [DOI] [Google Scholar]
- 32.Li W. et al. Quality control, modeling, and visualization of CRISPR screens with MAGeCK-VISPR. Genome Biology 16, 281 (2015). [DOI] [PMC free article] [PubMed] [Google Scholar]
- 33.Li B. et al. Cumulus provides cloud-based data analysis for large-scale single-cell and single-nucleus RNA-seq. Nature Methods 17, 793–798 (2020). [DOI] [PMC free article] [PubMed] [Google Scholar]
- 34.Wolf FA, Angerer P & Theis FJ SCANPY: large-scale single-cell gene expression data analysis. Genome Biol. 19, 15 (2018). [DOI] [PMC free article] [PubMed] [Google Scholar]
- 35.Pedregosa F. et al. Scikit-learn: Machine Learning in Python. MACHINE LEARNING IN PYTHON 6. [Google Scholar]
- 36.Loh P-L & Wainwright MJ High-dimensional regression with noisy and missing data: Provable guarantees with nonconvexity. Ann. Statist. 40, 1637–1664 (2012). [Google Scholar]
Associated Data
This section collects any data citations, data availability statements, or supplementary materials included in this article.


