

Abstract
With over 150 heritable mutations identified as disease‐causative, superoxide dismutase 1 (SOD1) has been a main target of amyotrophic lateral sclerosis (ALS) research and therapeutic efforts. However, recent evidence has suggested that neither loss of function nor protein aggregation is responsible for promoting neurotoxicity. Furthermore, there is no clear pattern to the nature or the location of these mutations that could suggest a molecular mechanism behind SOD1‐linked ALS. Here, we utilize reliable and accurate computational techniques to predict the perturbations of 10 such mutations to the free energy changes of SOD1 as it matures from apo monomer to metallated dimer. We find that the free energy perturbations caused by these mutations strongly depend on maturational progress, indicating the need for state‐specific therapeutic targeting. We also find that many mutations exhibit similar patterns of perturbation to native and non‐native maturation, indicating strong thermodynamic coupling between the dynamics at various sites of maturation within SOD1. These results suggest the presence of an allosteric network in SOD1 which is vulnerable to disruption by these mutations. Analysis of these perturbations may contribute to uncovering a unifying molecular mechanism which explains SOD1‐linked ALS and help to guide future therapeutic efforts.
Keywords: amyotrophic lateral sclerosis, free energy calculations, metal binding, protein dynamics, superoxide dismutase 1
1. INTRODUCTION
Amyotrophic Lateral Sclerosis (ALS) is a disease which causes degeneration of upper and lower motor neurons, resulting in paralysis and eventual death, although the mechanism through which this degeneration occurs is largely unknown.1 ALS affects approximately 6 people in 100,000 annually, with an incidence of 1.6 new cases per 100,000 every year.2 Approximately 10% of ALS cases are familial, meaning that disease development is partially or fully heritable, and up to 20% of patients with this form of ALS have mutations in the superoxide dismutase 1 (SOD1) gene.3 Additionally, 5% of ALS cases thought to be sporadic (with no familial inheritance of ALS‐linked mutations) are also reported to carry mutations in this gene.3 Recent evidence has also identified the presence of mis‐folded or aberrantly oligomerized SOD1 proteins in apparently sporadic cases where patients do not have mutations in the SOD1 gene,4 further implicating SOD1 in ALS.
SOD1 typically exists as a ubiquitously expressed homodimer, with each subunit bound to one Cu1+/2+ and one Zn2+ ion.4 Over 150 SOD1 mutations have been identified as potentially ALS‐causative, with no clear pattern to location or chemical group change.5 These variants of the protein, such as A4V (an alanine amino acid at position 4 mutated to a valine) and L38V, are of particular interest because they exhibit few or no obvious changes to the ground‐state structure, metal‐binding, or antioxidant function of the protein despite being linked to disease progression.6 Because of their similarity in structure and function to wild‐type SOD1, these mutations are referred to as ''WT‐like''. Many of these mutations have also been shown to globally destabilize SOD1 in its apo and metallated form, and to destabilize dimerization.7, 8, 9 Most studied mutations significantly impede enzyme function from WT, with activities ranging from 25% to 100% of WT.5 However, a reduction‐of‐function mechanism for the development of ALS is not widely accepted due to a lack of correlation between enzyme function and disease aggressiveness in humans, and the failure of SOD1‐knockout mice to develop ALS.10, 11 Mutations to SOD1 have also been shown to increase the propensity of the protein to aggregate into insoluble inclusion bodies, leading previous studies to predict that protein aggregation was the main cause of ALS.1, 12 However, more recent evidence has suggested that soluble SOD1 trimers or oligomers are responsible for cytotoxicity, and that the formation of inclusion bodies actually serves a cytoprotective role.13, 14 It is therefore proposed that SOD1 contributes to ALS at least partially through a toxic gain‐of‐function, of which there is preliminary evidence.15, 16
Recent NMR experiments have characterized SOD1's maturation pathway (from un‐metallated monomer to fully mature and metal‐bound homodimer), describing a process in which the protein samples many low‐lying conformations, and gradually selects a dominant state for the next step in the pathway.17, 18 One such study has demonstrated that many of these variants have a rougher free‐energy landscape, featuring more low‐lying conformers which are sampled more frequently.19 That study also identified several putative non‐native dimer structures, which are more populated in SOD1 mutants. These proposed low‐lying conformers and nonnative interaction motifs may represent disease‐prone conformations of SOD1, suggesting an alternative mechanism through which WT‐like mutations leave the ground‐state proteins mostly harmless and contribute to the development of ALS by transiently sampling cytotoxic species. These findings suggest that the structure and dynamics of the SOD1 protein, and its many disease‐related mutant variants, may play a significant role in ALS pathology. Further biophysical characterization of SOD1 mutants is needed to help elucidate the molecular mechanism behind cytotoxicity and disease progression, and to guide potential therapeutic attempts to stabilize mutant SOD1.
Molecular dynamics (MD) simulations, and alchemical free‐energy calculations in particular, have proven to be increasingly useful for analyzing subtle structural and energetic effects that are difficult or impossible to detect experimentally.20, 21, 22 Such computational methods have shown to reliably and accurately reproduce experimentally‐determined free energy changes and perturbations in a variety of cases, for example the changes to protein folding stability (ΔΔG) upon amino acid mutation20 and the ΔG of nucleotide mutations in protein‐DNA complexes.23 In this work, we have adapted these techniques to study the effects of WT‐like mutations on the SOD1 maturation pathway with the goal of identifying common structural or energetic effects that they might cause. Analysis of how these mutations commonly affect the structure, dynamics, and energetics of various stages of SOD1 maturation may provide important insight into the molecular mechanisms through which SOD1 aggregates or becomes cytotoxic and may guide further therapeutic attempts to treat ALS at the molecular level.
2. RESULTS AND DISCUSSION
2.1. Free‐energies of SOD1 dimerization depend on post‐translational modifications
It has been proposed that SOD1 aggregation or oligomerization proceeds through dimer dissociation and subsequent aberrant, non‐native dimer association.17 Until recently, SOD1 was thought to mature through a process where disulfide bond formation occurred prior to Zn2+ insertion or dimerization, so past investigations have primarily focused on the dimerization of apo‐SOD1SS protein.24 (Here, SS indicates disulfide bonded and 2SH indicates reduced). However, recent NMR‐based biochemical investigations of the SOD1 maturation pathway17, 18 have indicated that Zn2+ insertion precedes both dimerization and disulfide bond formation, indicating that the dimerization of the Zn2+‐SOD12SH and Cu,Zn‐SOD1SS (sometimes referred to as holo‐SOD1SS) variants of the protein are more biologically relevant than that of apo‐SOD1SS. Further support that Zn2+ insertion precedes dimerization is provided by evidence that the SOD1 Copper Chaperone Protein (Ccs1) binds preferentially to the apo‐SOD12SH monomer and induces conformational changes that promote Zn2+ binding.25 Because the immature Zn2+‐SOD12SH samples a dimerized conformation before subsequent maturation, as has been shown by previous work,26, 27 mutational dimer disruption could cause an increase in aberrant interactions after Zn2+ insertion by disrupting the formation of Zn2+‐SOD12SH homodimers. Likewise, it has been shown that disulfide bond formation and Cu2+ insertion both occur in the SOD1‐Ccs1 heterodimer before final maturation.18 Thus, mutations may disrupt the formation of Cu,Zn‐SOD1SS homodimers as well.
Previous in silico and in vitro studies of SOD1 have demonstrated that SOD1 variants increase the propensity of apo‐SOD1SS dimer dissociation through an increase in the ΔΔGDimerization.8, 28, 29 We investigated the propensity of ten different SOD1 mutations to destabilize dimer formation in the apo‐SS, apo‐SH, Zn‐SH, and Cu,Zn‐SS states to determine how the dimer is destabilized along the native maturation pathway of the protein, and to determine if the degree of free energy perturbation depends on maturational progress. The mutations studied and scheme for simulating free‐energies20 are shown in Figure 1.
FIGURE 1.

Alchemical workflow used to predict free energy changes of SOD1 mutations, (a) Each amino acid residue that was mutated is shown in spheres and colored based on the distance from the dimer interface. (b) Residues are colored based on the distance to residue His63, which forms the double‐deprotonated histidine bridge between the Cu2+ and Zn2+ ions. (c) Mutated residues are colored based on the distance to residue Cys146, which forms the disulfide bond. (d) Example thermodynamic cycle used to estimate ΔΔG values. See Figure S1 for other thermodynamic cycles. (e) 500 ns equilibrium trajectories of both wild‐type (blue) and mutant (red) SOD1 were generated. Every 1 ns in each trajectory, a snapshot structure is extracted and used to start a 50 ps non‐equilibrium ''morphing'' simulation. The work values of all forward and reverse morphing simulations are used to calculate ΔG4 (gold). (f) Hybrid residues, where both wild‐type (blue) and mutant (red) sidechains are included, are built into snapshots from equilibrium trajectories to start non‐equilibrium trajectories
Our calculated values (Figure 2) indicate that disulfide bond formation significantly affects the ΔΔGDimerization for most of the apo variants studied. Only G93S, G41S, I113T, and V148G showed insignificant differences between the disulfide bonded (blue) and reduced apo (yellow) variants. Similarly, all variants studied besides L38V, G41S, and V148G exhibit a significant change in ΔΔGDimerization upon Zn2+ binding to apo‐SOD12SH (gray), and all but A4T and V148G exhibit changes to ΔΔGDimerization upon maturation from Zn2+‐SOD12SH to Cu,Zn‐SOD1SS (orange). Taken together, these results suggest that the degree of perturbation to SOD1 dimerization caused by many of the mutations strongly depends on the maturation state of the protein. This observation is in line with previous studies, which have suggested that Zn2+ insertion plays a significant role in promoting SOD1 dimer association.17 Interestingly, mutations to the distal residue Gly93 (~20 Å from the dimerization site), which exhibit dimerization perturbation values close to zero in the apo‐SH state, cause significantly increased perturbations of around 2.5 kJ mol−1 dimer−1 after binding to Zn2+. Other mutations adjacent to the dimerization site, such as A4S, A4V, and I113T, also show increased dimerization destabilization upon Zn2+ insertion to the apo‐SH state. Only A4T exhibits a significant decrease in dimerization destabilization upon Zn2+ insertion, and V148I an increase in dimerization stabilization. The maturational free energy perturbations of many SOD1 mutations thus appear to be amplified in the Zn2+‐bound and disulfide‐reduced forms of the protein, which are likely more biologically relevant.
FIGURE 2.
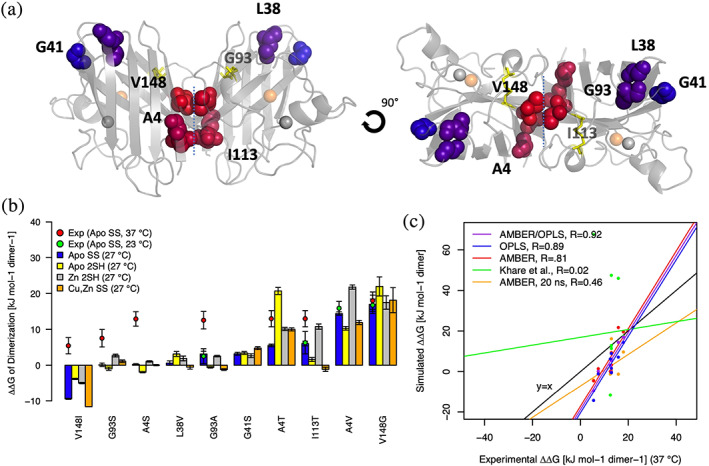
ΔΔGDimerization values agree with experiment and are altered by disulfide formation and metal binding. (a) Mutants included in the analysis are shown in spheres and colored based on the distance from the dimer interface. Zinc and Copper ions are shown as gray and orange spheres, respectively. (b) Calculated ΔΔGDimerization values are plotted for the disulfide‐bonded (SS), disulfide‐reduced apo (2SH), and disulfide‐reduced Zn‐bound species (Zn 2SH). Experimental ΔΔG values8 obtained using isothermal titration calorimetry (ITC) at 37°C are shown as red points, and values obtained using dissociation size exclusion chromatography (SEC) at 23°C are shown as teal points. Error bars represent 95% confidence intervals for experimental data and the standard error of the mean for simulated data. (c) Experimental ΔΔG values of the dimerization of apo‐SOD1SS, obtained using ITC at 37°C, are plotted against corresponding simulated data from OPLSAA/AMBER average values (purple), OPLSAA only values (blue), AMBER only values (red), only the first 20 ns of AMBER data (yellow), and a prior attempt to simulate the data (green).28
2.2. Long molecular dynamics simulations improve reproduction of experimental data
To validate our simulations against experimental data, ΔΔGDimerization values for apo‐SOD1SS calculated using molecular dynamics run at 27°C using the AMBER99SB*‐ILDN (AMBER) and OPLSAA force fields were compared with experimental values obtained using size‐exclusion chromatography (SEC) and isothermal titration calorimetry (ITC) at 23 and 37°C, respectively.8 These ΔΔGDimerization values predict the mutational perturbations to the ΔG of protein dimerization in each of the states outlined in Figure 2(b). These values provide information about how these mutants alter the maturational free energy changes of SOD1, but do not directly predict whether or not these mutants will form stable dimers. ΔΔG values calculated from both AMBER and OPLSAA trajectories at a variety of simulation lengths were evaluated against ITC data, revealing that correlation with experimental data increased with simulation length (Figure 2(c), S2A). When utilizing the full 3 μs of aggregate simulation time for each ΔGmut calculation, the average values from AMBER and OPLSAA trajectories showed a correlation coefficient of 0.92 with ITC data. Individual OPLSAA and AMBER‐only values demonstrated slightly lower correlations, with correlation coefficients of 0.89 and 0.81, respectively. Using only the first 20 ns of data from a single trial in order to match similar levels of sampling to a past study28 worsened the correlation with experimental data (0.81 vs 0.46, Figure 2(c)). (Ordinarily, the first 20 ns of data from each simulation were discarded before calculating our production values to allow for equilibration.) Additionally, certain SOD1 variants including the A4V apo‐SOD12SH dimer exhibited motion on the ns‐μs timescale (Figure S2B) which significantly affected the calculated ΔG value, further indicating the need for increased sampling to predict the free energy perturbations of SOD1 mutations. For those residues with experimental data at both 23 and 37°C, the higher temperature always showed a greater free energy, perhaps explaining the apparent underestimation of calculated values for the V148I, G93S, A4S, and A4T variants, for which only 37°C experimental data was available8 (Figure 2(b)).
While calculated ΔΔG values appear to agree well with experiment, analysis of residue‐level rotational autocorrelation functions for backbone N─H vectors (Figure S3) revealed that several residues in less‐mature forms of the protein fail to achieve dynamical convergence within 250 ns of simulation time. These residues tend to fall in the more flexible dimer (magenta), Zn2+ (blue), and electrostatic (orange) loops. As expected, these residues tend to converge at shorter timescales in more mature forms of the protein, including after metallation, dimerization, and disulfide bond formation.
2.3. A hydrogen bond in A4S and A4T variants explains dimer destabilization
While the simulations approached an accurate ΔΔGDimerization value for the A4T apo‐SOD12SH monomer variant (9.34 predicted vs 13.0 kJ mol−1 dimer−1 from experiment8), they did not for A4S (0.0 vs 13.0 kJ mol−1 dimer−1) despite the mutant residues differing from one another by only one methyl group. Analysis of cumulative work distributions calculated from the trajectories (Figure S4) showed bimodal distributions for the reverse simulations (especially A4T, Figure S4D), where one mode corresponded to a ΔΔGDimerization value around zero, and the other corresponded to a lower ΔG value for the monomer which is more in agreement with the experimental ΔΔG8 showing the mutations destabilizing the dimer.
Further investigation of the AMBER A4T monomer trajectory revealed a hydrogen bond between residue 4 and the backbone of Gly150 which requires reorientation of the β strand (residues 143–153) adjacent to the dimerization site (Figure S4G). The AMBER A4S trajectory exhibited the same hydrogen bond‐induced shift in work distribution, albeit with less sampling of the hydrogen‐bonded conformation (Figure S4A, S4B). This hydrogen bond was mostly absent in the AMBER A4S and A4T dimer trajectories as well as in the OPLSAA A4T monomer and dimer trajectories (Table S1) which gave an OPLSAA ΔΔG value far from experimental (1.6 vs 13.0 kJ mol−1 dimer−1). Only the AMBER A4T trajectories, where the hydrogen bond is present in the monomer but not dimer, approached experimental ΔΔG values.1
Interestingly, the OPLSAA A4S monomer and dimer trajectories both sampled the hydrogen‐bonded conformation, yet also yielded an inaccurate ΔΔG value (0.54 vs 13.0 kJ mol−1 dimer−1). Given that hydrogen bond formation did not appear to depend on dimer status in these trajectories, we hypothesized that the OPLSAA force field was inaccurately modeling part of the dimer interface such that the hydrogen bond was allowed to form in the wrong contexts. The OPLSAA trajectories indeed showed significantly higher RMSDs from crystal structures at a dimerization site‐adjacent β strand than AMBER for both the monomer and dimer forms of WT apo‐SOD1SS (Figure S5). Moreover, we found that that only AMBER trajectories showed a correlation between hydrogen bond formation and reorientation of the same β strand, with this correlation largely absent in the OPLSAA simulations. This suggests that the OPLSAA force field allows the β strand to drift away from the crystallographic conformation, misrepresenting its contribution to dimer stabilization and leading to inaccurate ΔΔG values. Additionally, the AMBER A4T trajectories, with data closer to experimental, also showed a significantly stronger correlation between hydrogen bond formation and β strand reorientation than the AMBER A4S trajectories (R = 0.72 for A4T vs 0.30 for A4S). These findings support a mechanism where A4T and A4S monomers form a hydrogen bond that causes β strand reorientation, making dimerization, which requires breaking the hydrogen bond, more energetically costly.
2.4. Mutations stabilize Zn2+ binding which partially rescues SOD12SH fold destabilization
Proper SOD1 metallation has been shown to contribute to the enzymatic activity and maintenance of SOD1's native, mature fold.30 Kayatekin et al.31 found that physiological concentrations of Zn2+ modulated the folding free energy landscape of SOD1 to drive the equilibrium towards lower‐energy, more properly folded conformers. They speculate that this shift towards proper folding may explain the apparent protective32 effects of Zn2+. Conversely, mis‐metallated SOD1 has been shown to induce misfolding and aggregation of SOD1 in vitro, and potentially cause ALS in mouse models.30, 33 We therefore investigated how the mutations influence SOD1 metallation by analyzing ΔΔG values of Zn2+‐bound SOD1 relative to the apo protein (Figure 3). Surprisingly, Zn2+ insertion into the folded apo‐SOD1SS monomer (Figure 3(b), yellow) was stabilized by many variants (A4V, I113T, G93S, L38V, and A4T). Only G93A, G41S, and V148G displayed a destabilization of Zn2+ insertion into the SOD1SS apo monomer. Similarly, Zn2+ insertion into the more maturationally relevant apo‐SOD12SH (red) was stabilized by A4V, I113T, G93S, G93A, A4S, and G41S, while it was destabilized by only V148I, L38V, V148G, and A4T. For the A4V, I113T, G93S, and A4S variants, Zn2+ insertion was more stabilized in the disulfide‐reduced variants, perhaps suggesting that the stabilizing effects of SOD1 mutations on Zn2+ insertion are enhanced in the initial disulfide‐reduced form of the protein.17, 18 While the results of Kayatekin et al. suggest that aggregate prone SOD1 mutants might bind less tightly to Zn2+ in the pre‐folded or partially‐folded ensembles, our results suggest that these mutations stabilize Zn2+ binding into the already‐folded SOD12SH monomer.
FIGURE 3.

Calculated ΔΔGZn‐insertion and ΔΔGFolding values in the SOD1 monomer and dimer. (a) Mutated residues are represented as spheres and colored by the distance to His63 (black), which forms a histidinate bridge between the Cu2+ and Zn2+ ions of each protomer. Cys57 and Cys146 (yellow) form the intra‐subunit disulfide bond in SOD1SS variants. (b) Calculated ΔΔGZn‐insertion values are plotted for SOD1SS and SOD12SH. Negative values indicate a stabilization of Zn2+ insertion. Experimental ΔΔGZn‐insertion values (purple circles) were obtained from urea (apo) and Guanidinium HCl (Gdn‐HCl) Zn2+‐SOD1SS denaturation experiments.24 (c) ΔΔGFolding values are plotted for each variant for apo‐SOD12SH and Zn‐SOD12SH proteins. Positive values indicate a destabilization of folding. Error bars represent the standard error of the mean
Previous studies have shown that all studied SOD1 variants besides V148I, even those distal from the metal‐binding site, exhibit lower thermal stabilities than WT in the Zn2+ and Cu2+ bound protein in vitro.7, 34 In accordance with these findings, our calculations reveal positive ΔΔGFolding values for all variants besides V148I. Further analysis of these data reveal that Zn2+‐stabilizing mutations cause a negative ΔΔGZn‐insertion value by destabilizing folding in the apo protein more so than in the Zn2+‐bound protein, indicating that Zn2+ binding partially rescues SOD1 from fold destabilization incurred by the mutations. (Figure 3(c)) While SOD1 variants show overall less fold stability than WT, even in the Zn2+‐bound state, they experience a greater increase in stability upon Zn2+ binding than WT and therefore stabilize Zn2+ insertion into the already‐folded apo protein. Our data agree qualitatively with the results of Kayatekin et al.24 who found negative ΔΔGZn‐insertion values for both A4V and L38V in monomeric SOD1.
Chelation assays by Crow et al.15 performed on the Zn2+‐bound SOD1 dimer have reported up to a 30‐fold decrease in the apparent affinity of dimeric SOD1 mutants for Cu2+ or Zn2+ over wild‐type, and concluded that WT‐like mutations cause a reduction in metal affinity. Various in silico studies have attempted to explain the results of these assays by showing thermodynamic coupling between the metal‐binding region and each residue of the protein, describing a mechanism wherein internal SOD1 frustrations, which are typically relieved upon metal binding, are instead relieved by mutations to decrease overall metal affinity.35 Kayatekin et al.24 explain the apparent discrepancy between their negative monomeric ΔΔGZn‐insertion findings and the dimeric chelation assays of Crow et al. by describing a population shift from dimeric to monomeric SOD1 in the mutant variants, leading to an increase in released Zn2+ due to the monomer's lower metal affinity than the dimer.15, 24, 36 However, we found that for all variants besides G93S and G41S, the ΔΔGZn‐Insertion value was higher in the SOD1SS dimer than in the SOD12SH monomer (Figure 3(b), green). The discrepancy between Crow et al. and Kayatekin et al. may therefore be due to the fact that mutational perturbations to Zn2+ insertion depend on oligomeric state, and that a population shift from dimer to monomer is not necessary to resolve the seemingly contradictory results.
In an effort to determine why mutational perturbations to Zn2+ binding may be different in the dimeric protein, we analyzed the ΔRMSF of Zn2+ binding into both the SOD12SH monomer and SOD1SS dimer (Figure S6). Although mutational ΔRMSF values were similar between the two states, mutations generally caused larger decreases in flexibility upon Zn2+ binding than WT in the SOD12SH monomer in the Zn2+ (blue) and electrostatic (orange) loops. The reverse trend was seen in the SOD1SS dimer, where mutations caused approximately the same or smaller decreases in flexibility upon Zn2+ binding in these regions. Based on these findings, we hypothesized that the ΔΔRMSF, or how much mutations changed the ΔRMSF of Zn2+ binding relative to WT, might be related to the different effects on the ΔΔGZn‐Insertion. To investigate this, we analyzed the relationship between mutational ΔΔRMSF and ΔΔG for the Zn2+‐binding process, surprisingly finding many positive correlations between these two values in both the Zn2+ and electrostatic loops. If ΔΔG values were determined by the degree of entropy reduction in those loops upon Zn2+ binding, then a negative correlation would be expected. For example, the greater the ΔΔRMSF, the less entopic penalty there is for Zn2+ binding, which should result in lower ΔΔG values. More work is needed to characterize the enthalpic and entropic contributions to Zn2+‐binding free energy in order to explain why Zn2+ insertion is less stabilized in SOD1 dimers.
Recent evidence has suggested that both Cu2+ and Zn2+ binding are facilitated by Ccs1 in a process where Ccs1 binds to the dimerization site of apo‐SOD12SH, induces conformational changes which promote Cu2+ or Zn2+ insertion, and catalyzes disulfide bond formation.17, 37 WT‐like mutations in SOD1 have also been shown to reduce the ability of Ccs1 to promote Zn2+ insertion.25 Our results suggest that SOD1 mutations thermodynamically stabilize the insertion of Zn2+ into the folded apo‐SOD1SS/2SH but destabilize folding and dimerization of SOD1. Thus, we hypothesize that SOD1 mutations may disrupt Zn2+ metalation kinetics, rather than thermodynamics, by disrupting the interactions between SOD1 and Ccs1. Future analysis of the ΔΔGCcs1‐association caused by these mutations is needed to help evaluate this hypothesis.
2.5. SOD1 mutant free energy perturbation patterns
An overview of the mutational free energy perturbations shows that the mutations exhibited strong perturbations at all stages of native maturation (Figure 4) rather than only showing perturbations in early transitions, such as folding and dimerization, which have been implicated in the promotion of disease‐prone conformers.17 Only the V148I variant demonstrated general global stabilization as indicated by the ΔΔGFolding of each state along the maturation pathway relative to the folded apo monomer, which is in good agreement with experimental differential scanning calorimetry data.34 Interestingly, these mutations tend to stabilize Zn2+ insertion in folded monomeric SOD1, which counterintuitively drives the protein towards native maturation and away from the less stable and potentially disease‐prone apo SOD12SH, only to destabilize further maturation by increasing ΔΔGDimerization values almost ubiquitously. This is in agreement with previous experiments showing that mutant apo SOD12SH variants such as A4V, G85R, and G93A unfold at temperatures below 37°C, but have nearly the same Tm as WT (~60°C) after binding Zn.38 Perhaps by driving the equilibrium toward more frequently folded Zn2+‐bound monomeric forms (Figure 4(b)), these mutations are allowing for aberrant interactions or cytotoxic gains in function which depend on SOD1 to be folded and soluble. This way, WT‐like mutations could paradoxically stabilize the protein's early maturation to a conformation (i.e., Zn2+‐SOD12SH) which is folded frequently enough for a significant toxic gain of function, and simultaneously destabilize subsequent state changes (e.g., dimerization), thus preventing the protein from maturing to a conformation which does not exhibit cytotoxicity.
FIGURE 4.
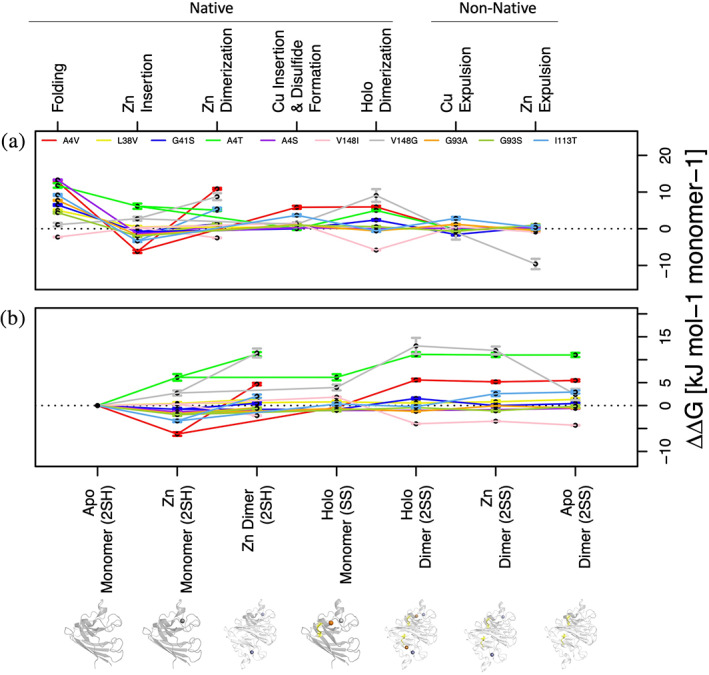
Maturation free‐energy perturbations of each SOD1 variant included in the study. (a) ΔΔGmut values for the transition listed on the upper x‐axis, normalized to units of kJ mol−1 monomer−1 (see methods). Each transition on the upper x‐axis corresponds to the transition between the states in (b) connected by lines to the left and right of that transition. (b) Stability perturbations of each mutant on various states along the SOD1 maturation pathway relative to the folded apo monomer, normalized to units of kJ mol−1 monomer−1 (ΔGMut State X – ΔGMut Apo monomer). Error bars represent the standard error of the mean as calculated by PMX.20 For states that are connected by lines in (b) the points for those transitions in (a) between those two states give the ΔΔGmut for the transition and are equal to the difference between the two adjacent ΔΔG values in (b). Protein images in (b) correspond to the states listed directly above them
2.6. Energetic and dynamic coupling between mutations and maturation steps
To perform an overall assessment of how the mutations affected free energy changes at all stages of maturation, we calculated a correlation matrix where the mutational ΔΔGs were compared between each step of the maturation pathway (Figure 5). Because our earlier analysis suggested that the A4S and A4T variants are inaccurately modeled by both force fields, the data from these variants were excluded from our analysis (for a matrix with complete data, see Figure S7). Surprisingly strong correlations were observed between the different maturational changes of SOD1 indicating that mutational free energy perturbations at various locations on the protein are somehow coupled. For instance, Cu2+ insertion was positively correlated with Zn2+‐SOD12SH dimerization (R = 0.69), suggesting a connection between Cu2+ and dimer‐site destabilization. Interestingly, Zn2+ insertion was anticorrelated with both folding and Cu2+ insertion (R = −0.84, R = −0.78). Following this analysis, hierarchical clustering of SOD1 ΔΔG values using a similar correlation analysis revealed distinct patterns for most mutations (Figure S7A). The Leu38, Gly41, and Gly93 mutations away from the dimerization interface clustered into their own clade, mostly due to having lower magnitude ΔΔG values overall. However, mutations close to the dimerization interface (positions 4, 113, and 148) had mostly unique patterns of ΔΔG values that did not tightly cluster with other mutations, even at the same position (Figure S7A).
FIGURE 5.
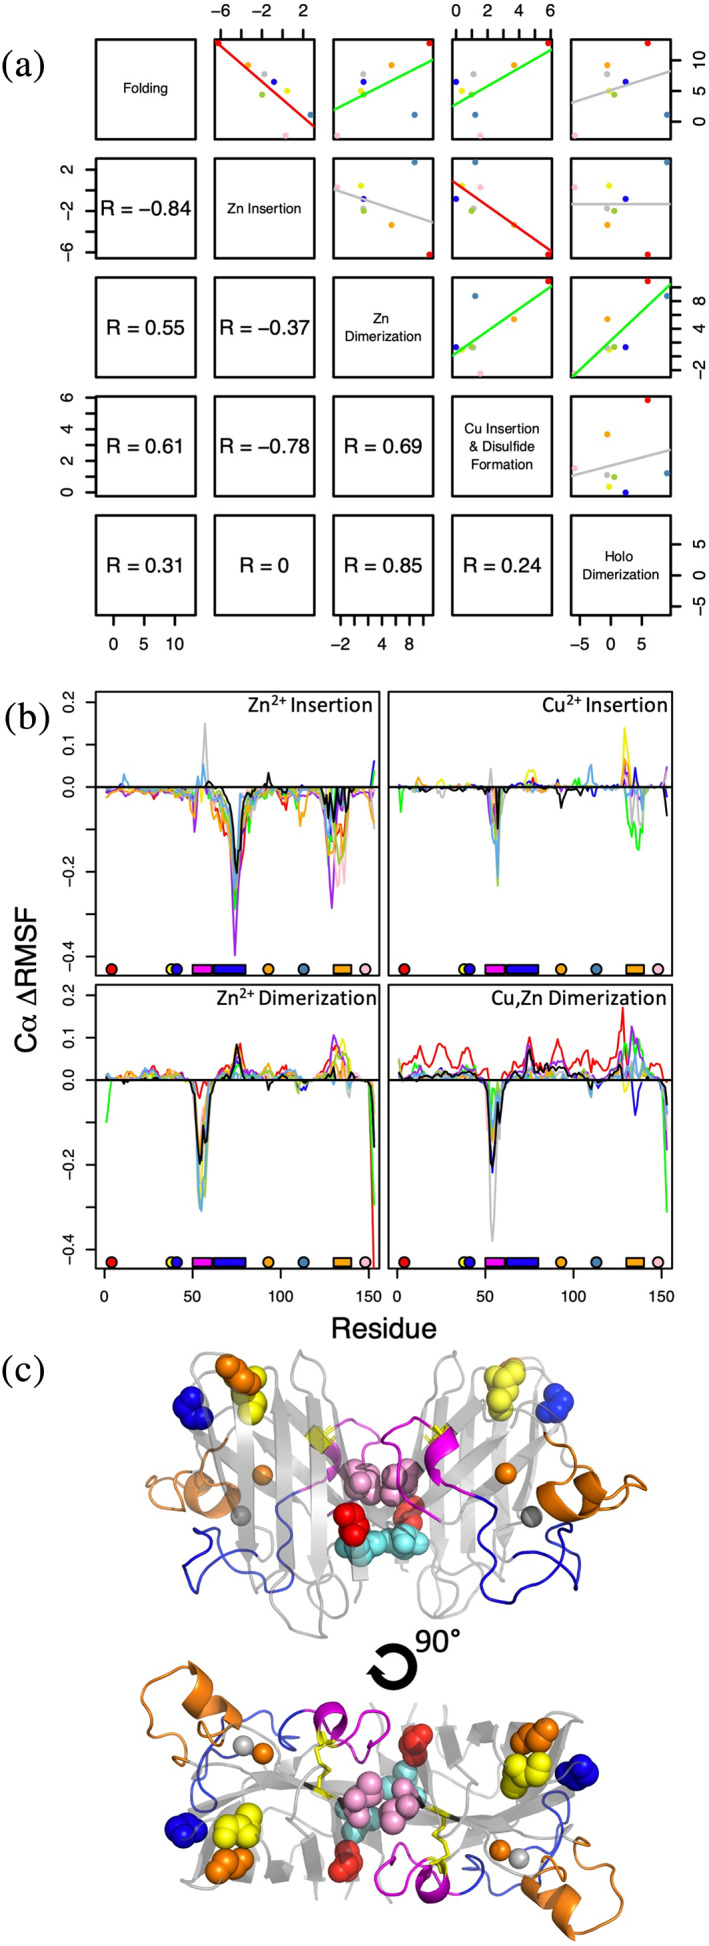
Correlated differences in free energies and dynamics for SOD1 mutants. (a) Correlations between the ΔΔG values of different steps along the native maturational pathway as outlined in Figure 4, excluding data from A4S and A4T variants. Lines of best fit are colored by the Pearson correlation coefficient with R > 0.4 (green), R < 0.4 (red), and −0.4 < R < 0.4 (gray). The correlation coefficients in the lower left panel correspond to the mirroring plot in the upper right panel. (b) ΔRMSF from disulfide‐reduced apo monomer to Zn2+‐bound monomer (''Zn2+ Insertion''), Zn2+‐bound monomer to dimer (''Zn2+ Dimerization''), Zn2+‐SH monomer to Cu,Zn‐SS monomer (''Cu2+ Insertion''), and Cu,Zn‐SS monomer to dimer (''Cu,Zn Dimerization''). Values are calculated using the distance between the standard errors around each mean RMSF, with overlapping errors having ΔRMSF = 0 (see Figure S9A). Positive values indicate an increase in RMSF, while negative values indicate a decrease in RMSF. Bars along the x‐axis indicate locations of the dimerization loop (magenta), Zn2+‐binding loop (blue), and electrostatic loop (orange). (c) Side chains of mutated SOD1 residues, shown in spheres, are colored corresponding to the legend of Figure 4(a). The backbone is colored corresponding to the x‐axis bars in (b)
In order to investigate whether the correlations and anticorrelations between different maturation stages might result from common perturbations to residue‐level flexibility observed along the SOD1 maturational pathway, we compared the maturational change in root mean squared fluctuations (ΔRMSF = RMSFstate 2 – RMSFstate 1) of all studied variants (AMBER: Figure 5(b), comparison with OPLSAA: Figure S8). We found that most mutant variants exhibited similar RMSF changes along native maturation, but some mutants showed larger decreases in flexibility than WT in the Zn2+‐binding loop (blue) upon Zn2+ insertion. Similarly, some mutants also showed larger decreases in electrostatic loop (orange) flexibility upon Zn2+ insertion as well as large increases in flexibility in this same region upon Zn2+‐SOD12SH or Cu,Zn‐SOD1SS dimerization. Unlike WT, a number of mutations showed decreased flexibility across the electrostatic loop and dimerization loop (magenta) upon Cu2+ insertion. Cu,Zn‐SOD1SS dimerization also showed a decrease in dimerization loop flexibility. Taken together, these results support the notion that maturation sites on SOD1 are allosterically coupled, and that mutations may be utilizing these coupling networks to exhibit common effects on the protein's structure and dynamics.
Recent evidence13, 14 has suggested that soluble SOD1 trimers/oligomers are responsible for the development of cytotoxicity, and that insoluble aggregates/inclusion bodies may actually serve a cytoprotective role. In the context of these findings, our data suggest that the perturbations to SOD1 structure and energetics caused by mutations commonly lead the still‐soluble enzyme towards a disease‐prone state and subsequently influence the development of aberrant trimers/oligomers. We hypothesize that allosteric networks within SOD1 may provide a unifying explanation for why these seemingly different mutations all converge to cause the same disease‐prone phenotype to advance the progression of ALS. Further analysis is needed to characterize these networks in order to guide therapeutic efforts which might disrupt the spread of these mutations' effects. Toward that end, we examine one such network in detail below.
2.7. Dimerization loop rigidification is allosterically coupled to an increase in flexibility in the electrostatic loop
A previous crystallographic study39 of WT SOD1 suggested that the disulfide bond in SOD1 reduces the dynamics and therefore conformational entropy of the dimer loop (residues 50–61) in the monomeric protein, thereby reducing the entropic penalty for SOD1 dimerization. In the absence of a disulfide bond, they found that complete metalation of SOD12SH similarly rigidifies the dimerization loop, allowing for Cu,Zn‐SOD12SH dimerization to occur. Our simulations appear to reproduce this reduction in dimer loop flexibility in WT SOD1 after complete metalation, especially for some of the mutants (Figure 5(b)). In addition to the dimer loop, other regions are similarly rigidified upon metal binding. RMSF analysis of equilibrium AMBER trajectories of SOD1 in its early stages of maturation revealed that the WT protein exhibits a decrease in flexibility in the Zn2+ and electrostatic loops upon Zn2+ binding, qualitatively reproducing previous NMR experiments which show Zn2+ binding resulting in the rigidification of the electrostatic loop.17
Interestingly, while the dimer loop was rigidified upon dimerization as expected, the Zn2+ and electrostatic loops both experienced an increase in mean RMSF in the dimerized conformation (Figure 5(b), S9A). Furthermore, between the monomer and dimer simulations, we found significant shifts in the average coordinates of a pair of β strands adjacent to the dimerization site and the dimer loop (Figure S9D). Based on these results, we hypothesized that the rigidification and/or shift in average positions of these regions upon dimerization mediates an allosteric increase in electrostatic/Zn2+ loop flexibility in both WT and mutant Zn2+‐SOD12SH. In order to evaluate this hypothesis, we designed a model WT Zn2+‐SOD12SH monomer system wherein the pair of β strands adjacent to the dimerization site (Figure S9E, yellow) were restrained with a force constant of 1,000 kJ mol−1 nm−2 to their average conformation from the equilibrium Zn2+‐SOD12SH dimer simulations. This had very little effect on the restrained RMSF profile (Figure S9C, yellow) relative to the unrestrained Zn‐bound monomer (Figure S9A, green). However, when the dimer loop of Zn2+‐SOD12SH (Figure S9B, magenta) was also restrained to its dimer conformation (force constant 62.5 kJ mol−1 nm−2), there was a slight but significant increase in the flexibility of the electrostatic loop (orange) as compared to the simulations with β strand restraints only (Figure S9C), making it similar to RMSF profile of the dimerized Zn2+‐SOD12SH equilibrium trajectories (Figure S9A, red).
These results imply that immobilization of the β strands and dimerization loop resulting from interactions with the other protomer in dimerized Zn2+‐SOD12SH increases the flexibility of the electrostatic loop. This suggests a possible mechanism for the Ccs1 protein, where the complex allosterically increases the flexibility of the electrostatic loop, facilitating Cu2+ insertion and subsequent maturation. Notably, while position restraints supported our allosteric hypothesis for the electrostatic loop, they had little influence on the flexibility of the Zn2+ loop. Further simulations are required to identify a putative allosteric mechanism to explain the changes in Zn2+ loop dynamics.
3. CONCLUSIONS
Although the exact molecular mechanism behind ALS remains largely a mystery, it is clear that the maturation of SOD1 plays an important role in disease progression. Previous biophysical studies have focused on the least stable conformations of SOD1, which are also the most prone to unfolding and aggregation. However, the possibility remains of aberrant interactions between soluble and folded ''intermediate‐maturity'' SOD1 conformers which may play a more significant role in cytotoxicity than previously thought. An analysis of the effects of WT‐like mutations on SOD1 maturation reveal that all stages of maturation are significantly perturbed in a fashion strongly dependent on the maturation state of the protein. Further, our simulations suggest that certain maturational transitions are paradoxically stabilized by various mutations, perhaps supporting the notion that such intermediate‐maturity conformers play an important role in disease progression.
In particular, this analysis reveals common structural and energetic signatures among various studied mutations which may contribute to a unifying molecular explanation behind SOD1‐linked ALS. Strong correlations between the influences of several of these mutations on different maturational steps suggests that there is an underlying communication network within SOD1 which is commonly hijacked by these mutations in order to amplify and spread destabilization. The same networks which allow for cooperative stabilization along the WT maturation of the protein also make the protein susceptible to diffuse destabilizations where single mutations can confer widespread effects throughout the protein. In the same manner, such intrinsic communication networks may allow for seemingly disparate mutations to confer similar effects on SOD1, namely that they may all lead to the same cytotoxic gain of function which contributes to the development of ALS.
4. MATERIALS AND METHODS
4.1. In silico preparation of mutant SOD1 variants
Due to the general similarity in backbone conformation between WT and mutant SOD1 crystal structures (RMSD <2 Å), all variants studied were generated in silico using the reference PDB structure 1HL5 (Cu,Zn‐SOD1SS) and modified according to the desired conformation.40 For example, Cu2+ and/or Zn2+ were selectively removed to generate metal‐free variants, and the second protomer was removed to generate monomeric variants. All mutations were performed using the PyMOL software package, and disulfide reduction was accomplished by adjusting the simulation parameters in GROMACS.
4.2. Preparation and parameterization of simulations
Each PDB structure was placed in a dodecahedral box with 1 nm between the protein and box walls and solvated using the TIP3P water model.41 Joung Na+ and Cl− ions were added to the simulation box at physiological concentrations of 150 mM in AMBER simulations, and the same concentration of default ions were used for OPLSAA simulations.42 Each system was allowed to energy‐minimize for 10,000 steps using the Steepest‐Descent algorithm in GROMACS. Energy‐minimized structures were then equilibrated with 20 ps of NVT, and then 20 ps of NPT, simulation using 1,000 kJ mol−1 nm−2 all‐atom position restraints. Each system was then equilibrated with three consecutive 20 ps NPT simulations using all‐atom position restraints of 500, 250, and 125 kJ mol−1 nm−2, respectively. Finally, two successive 20 ps NPT equilibrations were run with force constants of 125 kJ mol−1 nm−2, first on all backbone atoms and finally on Cα atoms only.
Equilibrium simulations were run at constant temperature and pressure. The Berendsen barostat was used to hold pressure at 1 bar, and the V‐rescale thermostat used to hold temperature at 300 K. All system preparations were carried out using GROMACS functions and in‐house scripts. Production simulation trajectories were generated using GROMACS 201843 with a 2 fs timestep, the Verlet neighbor‐searching cutoff‐scheme, and Particle‐Mesh Ewald (PME) for van der Waals and electrostatic interactions. The AMBER99SB*‐ILDN44, 45 and OPLSAA41 force fields were used to generate production trajectories, constraining all bonds using the LINCS algorithm.46
For metalated variants, a bonded plus electrostatics model was used, in which explicit bonds and bond angles are defined between the Cu2+ and/or Zn2+ and their coordinating residues. This method has been used extensively in previous work for parameterizing simulations of both SOD147 and other47, 48 systems. Since explicit bonds are defined in the force field, this method is generally preferred for systems in which coordination number changes or ligand exchange processes are not desired, such as is the case in our current methodology. Because the use of explicit bonds guarantees the metals will be reasonably well coordinated, this method does not lend itself to simulation of mutations that might disturb that coordination, such as G85R. For the Zn‐only variants, charge distributions for Zn2+‐coordinating residues (His63, His71, His80, Asp83) and for the Zn2+ ion were calculated from density functional theory (DFT) using the Gaussian and Metal Center Parameter Builder software packages at the B3LYP/6‐31G* level of theory.49, 50, 51 Charges were allowed to vary on both backbone and sidechain atoms during electrostatics calculations, thus allowing the generated parameters to be implemented in both the AMBER and OPLSAA force fields while maintaining an overall net charge of +2 per Zn2+‐bound monomer (Figure S10, Table S2). For Cu2+,Zn2+ variants, charge distributions and bond/angle parameters for all metal‐coordinating residues (His46, His48, His63, His71, His80, Asp83, His120) as well as for Zn2+ and Cu2+ ions from previous literature were used.47 These parameters included a doubly‐deprotonated Histidinate 63 which forms a bridge between Cu2+ and Zn2+ in SOD1, which has been modelled by previous studies as well.52 For both the Zn2+‐only and Cu,Zn proteins, the same charge distribution was used for the monomer and dimer states. For all metal‐containing simulations, the default van der Waals parameters for those metals in AMBER and OPLSAA were used.
4.3. Non‐equilibrium molecular dynamics simulations
Free‐energy perturbations were estimated by alchemical mutation using the PMX software package.20 The change in free energy upon mutation of a given structure (∆Gmut) was estimated by generating a hybrid residue which contains both wild‐type and mutant sidechain atoms (Figure 1(f)). Over the course of a 50 ps morphing simulation, the WT atom van der Waals (vdW) and Coulombic effects are turned off as the mutant atom interactions are turned on. The presence of the respective atoms in the Hamiltonian is described by a λ parameter, where at λ = 0 all WT interactions are turned on while all mutant interactions are off, and at λ = 1 all WT interactions are off while all mutant interactions are on. The λ parameter is increased from 0 to 1 over the course of the simulation, with incremental changes per timestep of 1•nstep−1. By integrating the ∂H∂λ curve (the derivative of the Hamiltonian with respect to λ), a work value for each morphing simulation can be obtained (Figure 1(d)).
For each ΔGmutation calculation, three WT and three MUT equilibrium trajectories of 500 ns each are run, resulting in a total of 3 μs of equilibrium simulation time per ΔG calculation. ''Snapshot'' structures are recorded from each equilibrium trajectory every 1 ns, totaling 500 snapshots per equilibrium trajectory (Figure 1(e)). For each snapshot, PMX was used to generate the desired hybrid residue and corresponding topology in which the MUT sidechain atoms are built into the structure file as dummy atoms. Following this, an energy minimization of up to 100 steps was run, freezing all non‐dummy atoms in order to relax the newly formed dummy‐atom sidechain. A 20 ps equilibrium simulation was then run with a constant value of λ = 0 to regenerate velocities and to equilibrate the new residue, solvent, and ions. Finally, a 50 ps ''morph'' trajectory was generated during which the λ parameter was incremented from 0 to 1, and the work value of the hybrid residue morph recorded. Since the method employed is ''fast‐growth'' wherein the morphing simulations are non‐equilibrium, work distributions must be analyzed from both WT‐to‐MUT (''Forward'') and MUT‐to‐WT (''Backwards'') transitions. Scripts included in the PMX package were used to calculate the ΔGmutation from the resulting work distributions of the ''forward'' and ''reverse'' trajectories. The effect of an amino acid mutation on the transition of interest (ΔΔGmut transition) is estimated by comparing ΔG values as described in Figure 1(d). For all experimental trials, ΔG and standard error are calculated using the ''analyze_dhdl.py'' script in PMX on work distributions concatenated from all three forward and reverse trajectories, excluding the first 20 ns from each trajectory to allow for the starting structures to equilibrate without restraints.
4.4. Data analysis
All plotted ΔΔG values shown were calculated using AMBER/OPLSAA averaged values. Standard errors for the force field averaged values were calculated by propagating the standard error of each individual force field's value. To estimate how mutation perturbs the free energy of dimerization, units of kJ mol−1 dimer−1 are obtained by multiplying the ΔGmonomer value by two and subtracting the result from the ΔGdimer value. These values are then converted to kJ mol−1 monomer−1 as needed by dividing by two. The supplement has all ΔΔG values for the average over both force fields (Table S3), ABMER individually (Table S4), OPLSAA individually (Table S5).
The experimental ΔΔGDimerization values at 37°C plotted in Figure 2(b),(c) were obtained from Broom et al.,8 Table S1, ''ΔΔGd [kcal (mol dimer)‐1] ITC (37°C)''. Values for 23°C were calculated with the following formula:
where ΔGDimer Dissoc. values were taken from Table S1, ''ΔGd [kcal (mol dimer)‐1] SEC (23°C)''. The calculated ΔΔGDimerization values from Khare et al.28 plotted in Figure 2(c) were taken from Table II, ''ΔΔG(dissoc‐s)'', and converted into ΔΔGDimerization values by taking the negative. All ΔΔGDimerization values were converted from kcal mol−1 to kJ mol−1 dimer‐1 for the purpose of comparison. The experimental ΔΔGZn‐Insertion values plotted in Figure 3(b) were calculated from Kayatekin et al,24 Table S1, ''ΔΔG°Zn''. Values were calculated with following formula:
where ΔΔGZn‐InsertionFold,x refers to the perturbation to folding free energy for state x that occurs as a result of Zn2+ binding. An example calculation follows:
The ΔRMSF values shown in Figure 5(b) and Figure S8 are calculated using the following formula:
where the difference taken is the smallest difference between the two standard errors of the mean of each RMSF value, as is indicated in Figure S9A. RMSD values for Figure S5B were calculated over both subunits of the dimers. Dimer RMSF values were calculated separately for each subunit, and then averaged. The standard error of the mean calculation for these values includes each subunit as a separate trial. RMSF SEM calculations were done using the following formulas:
4.5. Data visualization
Each mutated amino acid in Figure 1(a) (shown in spheres) is colored based on the distance from that residue's Cβ (or Cα for glycine) and the nearest Cα on the opposite chain in order to represent distance to the dimer interface. Residues of Figure 1(b) are colored based on the distance between the Cα of the residue and the Hε of His63, which coordinates both Cu2+ and Zn2+, to represent the distance from each residue and the metallation site. Residues of Figure 1(C) are colored based on the distance between the Cα of the residue and the sulfur atom of Cys57, which forms the intra‐subunit disulfide bond with Cys146, to represent distance to the disulfide bond. Mutants in Figure 2(a) are colored following the coloring scheme of Figure 1(a). Mutants in Figure 3(a) are colored following the coloring scheme of Figure 1(b). Mutants in Figure 5 and Figure S7 are colored according to the legend presented in Figure 4(a).
The work distribution plots shown in Figure S4B, S4D, and S4F were generated using a modified version of the ''analyze_dhdl.py'' function in PMX.20 Protein images in all figures were generated using PyMol.53
AUTHOR CONTRIBUTIONS
Nicholas Wells: Conceptualization; data curation; formal analysis; funding acquisition; investigation; methodology; project administration; resources; visualization; writing‐original draft; writing‐review & editing. Grant Tillinghast: Methodology. Alison O'Neil: Conceptualization; supervision; writing‐review & editing. Colin Smith: Conceptualization; funding acquisition; methodology; project administration; resources; supervision; writing‐original draft; writing‐review & editing.
Supporting information
Appendix S1: Supporting information
ACKNOWLEDGEMENTS
The authors would like to thank Wesleyan University for computer time supported by the NSF under grant number CNS‐0619508 and CNS‐0959856, and the Extreme Science and Engineering Discovery Environment (XSEDE), which is supported by National Science Foundation grant number ACI‐1548562 (under the allocation ID MCB190110), for SDSC Comet CPU & GPU and Data Oasis resources used to produce this work.54 To the best of our knowledge, no authors have any conflict of interest, financial or otherwise.
Wells NGM, Tillinghast GA, O'Neil AL, Smith CA. Free energy calculations of ALS‐causing SOD1 mutants reveal common perturbations to stability and dynamics along the maturation pathway. Protein Science. 2021;30:1804–1817. 10.1002/pro.4132
Funding information National Science Foundation; NSF
REFERENCES
- 1.Hardiman O, Al‐Chalabi A, Chio A, et al. Amyotrophic lateral sclerosis. Nat Rev Dis Primers. 2017;3:17071. [DOI] [PubMed] [Google Scholar]
- 2.Talbott EO, Malek AM, Lacomis D. Chapter 13 ‐ the epidemiology of amyotrophic lateral sclerosis, editors. Handbook of Clinical Neurology. 2016:225–238. https://www.elsevier.com/books/book-series/handbook-of-clinical-neurology [DOI] [PubMed] [Google Scholar]
- 3.Wijesekera LC, Leigh PN. Amyotrophic lateral sclerosis. BioMed Central. 2009;4:3. [DOI] [PMC free article] [PubMed] [Google Scholar]
- 4.Grad LI, Rouleau GA, Ravits J, Cashman NR. Clinical spectrum of amyotrophic lateral sclerosis (ALS). Cold Spring Harb Perspect Med. 2017;7:a024117. [DOI] [PMC free article] [PubMed] [Google Scholar]
- 5.Saccon RA, Bunton‐Stasyshyn RKA, Fisher EMC, Fratta P. Is SOD1 loss of function involved in amyotrophic lateral sclerosis? Brain. 2013;136:2342–2358. [DOI] [PMC free article] [PubMed] [Google Scholar]
- 6.Bakavayev S, Chetrit N, Zvagelsky T, et al. Cu/Zn‐superoxide dismutase and wild‐type like fALS SOD1 mutants produce cytotoxic quantities of H(2)O(2) via cysteine‐dependent redox short‐circuit. Sci Rep. 2019;9:10826–10826. [DOI] [PMC free article] [PubMed] [Google Scholar]
- 7.Rodriguez JA, Valentine JS, Eggers DK, et al. Familial amyotrophic lateral sclerosis‐associated mutations decrease the thermal stability of distinctly metallated species of human copper/zinc superoxide dismutase. J Biol Chem. 2002;277:15932–15937. [DOI] [PubMed] [Google Scholar]
- 8.Broom HR, Rumfeldt JAO, Vassall KA, Meiering EM. Destabilization of the dimer interface is a common consequence of diverse ALS‐associated mutations in metal free SOD1. Protein Sci. 2015;24:2081–2089. [DOI] [PMC free article] [PubMed] [Google Scholar]
- 9.Lindberg MJ, Tibell L, Oliveberg M. Common denominator of Cu/Zn superoxide dismutase mutants associated with amyotrophic lateral sclerosis: Decreased stability of the apo state. Proc Natl Acad Sci. 2002;99:16607–16612. [DOI] [PMC free article] [PubMed] [Google Scholar]
- 10.Reaume AG, Elliott JL, Hoffman EK, et al. Motor neurons in Cu/Zn superoxide dismutase‐deficient mice develop normally but exhibit enhanced cell death after axonal injury. Nat Genet. 1996;13:43–47. [DOI] [PubMed] [Google Scholar]
- 11.Ratovitski T, Corson LB, Strain J, et al. Variation in the biochemical/biophysical properties of mutant superoxide dismutase 1 enzymes and the rate of disease progression in familial amyotrophic lateral sclerosis kindreds. Human Mol Genet. 1999;8:1451–1460. [DOI] [PubMed] [Google Scholar]
- 12.Brasil AA, Magalhães RSS, De Carvalho MDC, et al. Implications of fALS mutations on Sod1 function and oligomerization in cell models. Mol Neurobiol. 2018;55:5269–5281. [DOI] [PMC free article] [PubMed] [Google Scholar]
- 13.Zhu C, Beck MV, Griffith JD, Deshmukh M, Dokholyan NV. Large SOD1 aggregates, unlike trimeric SOD1, do not impact cell viability in a model of amyotrophic lateral sclerosis. Proc Natl Acad Sci U S A. 2018;115:4661–4665. [DOI] [PMC free article] [PubMed] [Google Scholar]
- 14.Gill C, Phelan JP, Hatzipetros T, et al. SOD1‐positive aggregate accumulation in the CNS predicts slower disease progression and increased longevity in a mutant SOD1 mouse model of ALS. Sci Rep. 2019;9:6724. [DOI] [PMC free article] [PubMed] [Google Scholar]
- 15.Crow JP, Sampson JB, Zhuang Y, Thompson JA, Beckman JS. Decreased zinc affinity of amyotrophic lateral sclerosis‐associated superoxide dismutase mutants leads to enhanced catalysis of tyrosine nitration by peroxynitrite. J Neurochem. 1997;69:1936–1944. [DOI] [PubMed] [Google Scholar]
- 16.Huai J, Zhang Z. Structural properties and interaction partners of familial ALS‐associated SOD1 mutants. Front Neurol. 2019;10:527. [DOI] [PMC free article] [PubMed] [Google Scholar]
- 17.Culik RM, Sekhar A, Nagesh J, et al. Effects of maturation on the conformational free‐energy landscape of SOD1. Proc Natl Acad Sci U S A. 2018;115:E2546–e2555. [DOI] [PMC free article] [PubMed] [Google Scholar]
- 18.Luchinat E, Barbieri L, Banci L. A molecular chaperone activity of CCS restores the maturation of SOD1 fALS mutants. Sci Rep. 2017;7:17433. [DOI] [PMC free article] [PubMed] [Google Scholar]
- 19.Sekhar A, Rumfeldt JAO, Broom HR, et al. Probing the free energy landscapes of ALS disease mutants of SOD1 by NMR spectroscopy. Proc Natl Acad Sci U S A. 2016;113:E6939–e6945. [DOI] [PMC free article] [PubMed] [Google Scholar]
- 20.Gapsys V, Michielssens S, Seeliger D, De Groot BL. Pmx: Automated protein structure and topology generation for alchemical perturbations. J Comput Chem. 2015;36:348–354. [DOI] [PMC free article] [PubMed] [Google Scholar]
- 21.Chen J, Wang J, Yin B, Pang L, Wang W, Zhu W. Molecular mechanism of binding selectivity of inhibitors toward BACE1 and BACE2 revealed by multiple short molecular dynamics simulations and free‐energy predictions. ACS Chem Nerosci. 2019;10:4303–4318. [DOI] [PubMed] [Google Scholar]
- 22.Chen J, Pang L, Wang W, Wang L, Zhang JZH, Zhu T. Decoding molecular mechanism of inhibitor bindings to CDK2 using molecular dynamics simulations and binding free energy calculations. J Biomol Struct Dynam. 2020;38:985–996. [DOI] [PubMed] [Google Scholar]
- 23.Gapsys V, De Groot BL. Alchemical free energy calculations for nucleotide mutations in protein–DNA complexes. J Chem Theory Comput. 2017;13:6275–6289. [DOI] [PubMed] [Google Scholar]
- 24.Kayatekin C, Zitzewitz JA, Matthews CR. Disulfide‐reduced ALS variants of Cu, Zn superoxide dismutase exhibit increased populations of unfolded fpecies. J Mol Biol. 2010;398:320–331. [DOI] [PMC free article] [PubMed] [Google Scholar]
- 25.Boyd SD, Ullrich MS, Calvo JS, Behnia F, Meloni G, Winkler DD. Mutations in superoxide dismutase 1 (Sod1) linked to familial amyotrophic lateral sclerosis can disrupt high‐affinity zinc‐binding promoted by the copper chaperone for Sod1 (ccs). Molecules. 2020;25:1086. [DOI] [PMC free article] [PubMed] [Google Scholar]
- 26.Banci L, Bertini I, Cantini F, D'Amelio N, Gaggelli E. Human SOD1 before harboring the catalytic metal: Solution structure of copper‐depleted, disulfide‐reduced form. J Biol Chem. 2006;281:2333–2337. [DOI] [PubMed] [Google Scholar]
- 27.Arnesano F, Banci L, Bertini I, Martinelli M, Furukawa Y, O'Halloran TV. The unusually stable quaternary structure of human Cu,Zn‐superoxide dismutase 1 is controlled by both metal occupancy and disulfide status. J Biol Chem. 2004;279:47998–48003. [DOI] [PubMed] [Google Scholar]
- 28.Khare SD, Caplow M, Dokholyan NV. FALS mutations in cu, Zn superoxide dismutase destabilize the dimer and increase dimer dissociation propensity: A large‐scale thermodynamic analysis. Amyloid. 2006;13:226–235. [DOI] [PubMed] [Google Scholar]
- 29.Das A, Plotkin SS. Mechanical probes of SOD1 predict systematic trends in metal and dimer affinity of ALS‐associated mutants. J Mol Biol. 2013;425:850–874. [DOI] [PubMed] [Google Scholar]
- 30.Sirangelo I, Iannuzzi C. The role of metal binding in the amyotrophic lateral sclerosis‐related aggregation of copper‐zinc superoxide dismutase. Molecules. 2017;22:1429. [DOI] [PMC free article] [PubMed] [Google Scholar]
- 31.Kayatekin C, Zitzewitz JA, Matthews CR. Zinc binding modulates the entire folding free energy surface of human Cu,Zn superoxide dismutase. J Mol Biol. 2008;384:540–555. [DOI] [PMC free article] [PubMed] [Google Scholar]
- 32.Banci L, Bertini I, Durazo A, et al. Metal‐free superoxide dismutase forms soluble oligomers under physiological conditions: A possible general mechanism for familial ALS. Proc Natl Acad Sci U S A. 2007;104:11263. [DOI] [PMC free article] [PubMed] [Google Scholar]
- 33.Wang J, Slunt H, Gonzales V, et al. Copper‐binding‐site‐null SOD1 causes ALS in transgenic mice: Aggregates of non‐native SOD1 delineate a common feature. Human Mol Genet. 2003;12:2753–2764. [DOI] [PubMed] [Google Scholar]
- 34.Doyle CM, Rumfeldt JA, Broom HR, Sekhar A, Kay LW, Meiering EM. Concurrent increases and decreases in local stability and conformational geterogeneity in cu, Zn superoxide dismutase variants revealed by temperature‐dependence of amide chemical shifts. Biochemistry. 2016;55:1346–1361. [DOI] [PubMed] [Google Scholar]
- 35.Das A, Plotkin SS. SOD1 exhibits allosteric frustration to facilitate metal binding affinity. Proc Natl Acad Sci U S A. 2013;110:3871–3876. [DOI] [PMC free article] [PubMed] [Google Scholar]
- 36.Hayward LJ, Rodriguez JA, Kim JW, et al. Decreased metallation and activity in subsets of mutant superoxide dismutases associated with familial amyotrophic lateral sclerosis. J Biol Chem. 2002;277:15923–15931. [DOI] [PubMed] [Google Scholar]
- 37.Boyd SD, Liu L, Bulla L, Winkler DD. Quantifying the interaction between copper‐zinc superoxide dismutase (Sod1) and its copper chaperone (Ccs1). J Proteomics Bioinform. 2018;11:473. [DOI] [PMC free article] [PubMed] [Google Scholar]
- 38.Furukawa Y, O'Halloran TV. Amyotrophic lateral sclerosis mutations have the greatest destabilizing effect on the apo‐ and reduced form of SOD1, leading to unfolding and oxidative aggregation. J Biol Chem. 2005;280:17266–17274. [DOI] [PubMed] [Google Scholar]
- 39.Hörnberg A, Logan DL, Marklund LS, Oliveberg M. The coupling between disulphide status, metallation and dimer interface strength in Cu/Zn superoxide dismutase. J Mol Biol. 2006;365:333–342. [DOI] [PubMed] [Google Scholar]
- 40.Strange RW, Antonyuk S, Hough MA, et al. The structure of holo and metal‐deficient wild‐type human Cu, Zn superoxide dismutase and its relevance to familial amyotrophic lateral sclerosis. J Mol Biol. 2003;328:877–891. [DOI] [PubMed] [Google Scholar]
- 41.Kaminski GA, Friesner RA, Tirado‐Rives J, Jorgensen WL. Evaluation and reparametrization of the OPLS‐AA force field for proteins via comparison with accurate quantum chemical calculations on peptides. J Phys Chem B. 2001;105:6474–6487. [Google Scholar]
- 42.Joung IS, Cheatham TE. Determination of alkali and halide monovalent ion parameters for use in explicitly solvated biomolecular simulations. J Phys Chem B. 2008;112:9020–9041. [DOI] [PMC free article] [PubMed] [Google Scholar]
- 43.Abraham MJ, Murtola T, Schulz R, et al. GROMACS: High performance molecular simulations through multi‐level parallelism from laptops to supercomputers. SoftwareX. 2015;1–2:19–25. [Google Scholar]
- 44.Aliev AE, Kulke M, Khaneja HS, Chudasama V, Sheppard TD, Lanigan RM. Motional timescale predictions by molecular dynamics simulations: Case study using proline and hydroxyproline sidechain dynamics. Proteins. 2014;82:195–215. [DOI] [PMC free article] [PubMed] [Google Scholar]
- 45.Lindorff‐Larsen K, Piana S, Palmo K, et al. Improved side‐chain torsion potentials for the Amber ff99SB protein force field. Proteins. 2010;78:1950–1958. [DOI] [PMC free article] [PubMed] [Google Scholar]
- 46.Hess B, Bekker H, Berendsen HJC, Fraaije JGEM. LINCS: A linear constraint solver for molecular simulations. J Comput Chem. 1997;18:1463–1472. [Google Scholar]
- 47.Branco RJF, Fernandes PA, Ramos MJ. Molecular dynamics simulations of the enzyme Cu, Zn superoxide dismutase. J Phys Chem B. 2006;110:16754–16762. [DOI] [PubMed] [Google Scholar]
- 48.Suárez D, Merz KM. Molecular dynamics simulations of the mononuclear zinc‐β‐lactamase from Bacillus cereus . J Am Chem Soc. 2001;123:3759–3770. [DOI] [PubMed] [Google Scholar]
- 49.Toba S, Damodaran KV, Merz KM. Binding preferences of hydroxamate inhibitors of the matrix metalloproteinase human fibroblast collagenase. J Med Chem. 1999;42:1225–1234. [DOI] [PubMed] [Google Scholar]
- 50.Peters MB, Yang Y, Wang B, Füsti‐Molnár L, Weaver MN, Merz KM. Structural survey of zinc‐containing proteins and development of the zinc AMBER force fField (ZAFF). J Chem Theory Comput. 2010;6:2935–2947. [DOI] [PMC free article] [PubMed] [Google Scholar]
- 51.Frisch MJT, Trucks GW, Schlegel HB, et al. Gaussian 03. Wallingford CT: Gaussian Inc., 2003. [Google Scholar]
- 52.Peng X, Cashman NR, Plotkin SS. Prediction of misfolding‐specific epitopes in SOD1 using collective coordinates. J Phys Chem B. 2018;122:11662–11676. [DOI] [PubMed] [Google Scholar]
- 53.The PyMOL Molecular Graphics System, Schrödinger, LLC.
- 54.Towns J, Cockerill T, Dahan M, et al. XSEDE: Accelerating scientific discovery. Comput Sci Eng. 2014;16:62–74. [Google Scholar]
Associated Data
This section collects any data citations, data availability statements, or supplementary materials included in this article.
Supplementary Materials
Appendix S1: Supporting information