

Abstract
Acanthamoeba polyphaga Mimivirus, a complex virus that infects amoeba, was first reported in 2003. It is now known that its DNA genome encodes for nearly 1,000 proteins including enzymes that are required for the biosynthesis of the unusual sugar 4‐amino‐4,6‐dideoxy‐d‐glucose, also known as d‐viosamine. As observed in some bacteria, the pathway for the production of this sugar initiates with a nucleotide‐linked sugar, which in the Mimivirus is thought to be UDP‐d‐glucose. The enzyme required for the installment of the amino group at the C‐4′ position of the pyranosyl moiety is encoded in the Mimivirus by the L136 gene. Here, we describe a structural and functional analysis of this pyridoxal 5′‐phosphate‐dependent enzyme, referred to as L136. For this analysis, three high‐resolution X‐ray structures were determined: the wildtype enzyme/pyridoxamine 5′‐phosphate/dTDP complex and the site‐directed mutant variant K185A in the presence of either UDP‐4‐amino‐4,6‐dideoxy‐d‐glucose or dTDP‐4‐amino‐4,6‐dideoxy‐d‐glucose. Additionally, the kinetic parameters of the enzyme utilizing either UDP‐d‐glucose or dTDP‐d‐glucose were measured and demonstrated that L136 is efficient with both substrates. This is in sharp contrast to the structurally related DesI from Streptomyces venezuelae, whose three‐dimensional architecture was previously reported by this laboratory. As determined in this investigation,
DesI shows a profound preference in its catalytic efficiency for the dTDP‐linked sugar substrate. This difference can be explained in part by a hydrophobic patch in DesI that is missing in L136. Notably, the structure of L136 reported here represents the first three‐dimensional model for a virally encoded PLP‐dependent enzyme and thus provides new information on sugar aminotransferases in general.
Keywords: 4,6‐dideoxy sugar; 4‐aminoquinovose; Acanthamoeba polyphaga Mimivirus; aminotransferase; d‐viosamine; giant viruses; UDP‐4‐amino‐4,6‐dideoxy‐d‐glucose; viral glycans; X‐ray structure
Short abstract
Abbreviations
- dTDP
thymidine diphosphate
- HEPES
N‐2‐hydroxyethylpiperazie‐N′‐2‐ethanesulfonic acid
- HEPPS
N‐2‐hydroxyethylpiperazine‐N′‐3‐propanesulfonic acid
- HPLC
high‐performance liquid chromatography
- MES
2‐(N‐morpholino)ethanesulfonic acid
- Ni‐NTA
nickel‐nitrilotriacetic acid
- PLP
pyridoxal 5′‐phosphate
- PMP
pyridoxamine 5′‐phosphate
- SAD
single‐wavelength anomalous dispersion
- TEV
tobacco etch virus
- Tris
tris‐(hydroxymethyl)aminomethane
- UDP
uridine diphosphate
1. INTRODUCTION
Whereas there is still debate as to who should be given credit for discovering the first virus, namely Tobacco mosaic virus, it is clear that both Dmitri Ivanosky in 1892 and Martinus Beijerinck in 1898 made substantial contributions to the field of virology.1 By the early 20th century additional viruses had been reported, and it was Thomas Milton Rivers who defined the virus as an obligate parasite. He later became known as the “father of modern virology” for his pioneering efforts during the 1920s through 1950s, the so‐called “golden age of virology.”2 Originally it was assumed that viruses were submicroscopic particles that could not be resolved under a light microscope, and the dogma continued throughout the 20th century. Yet in 2003, that belief was shattered by the report of the Acanthamoeba polyphaga Mimivirus (APMV) which infects amoeba.3 Interestingly, the Mimivirus was actually first isolated in 1992 from a cooling tower in England. Due to its large size and the prevailing wisdom about viruses at the time, it was wrongly classified as a Gram positive bacterium. The Mimivirus has a capsid diameter of ~5,000 Å and, with the inclusion of fibers, this diameter extends to 7,500 Å.4 Remarkably, its linear double‐stranded DNA genome contains ~1.2 million base pairs which encode for nearly 1,000 proteins.5 Since the initial discovery of the Mimivirus, at least ten additional giant viruses have been identified and seven viral clades defined.6
The Mimivirus capsid is icosahedral in shape with protein filaments that extend outwards and that are required for adhesion to the host.4, 7 These filaments are heavily glycosylated with such sugars as d‐glucose, N‐acetyl‐d‐glucosamine, l‐rhamnose, and 4‐amino‐4,6‐dideoxy‐d‐glucose (also referred to in the literature as d‐viosamine or 4‐amino‐d‐quinovose).8, 9, 10, 11 Both l‐rhamnose and d‐viosamine are first synthesized as nucleotide‐linked precursors.
Previous studies have demonstrated that the proteins encoded by the R141 and L136 Mimivirus genes correspond to a 4,6‐dehydratase (R141) and a pyridoxal 5′‐phosphate or PLP‐dependent aminotransferase (L136), respectively.10, 12 Their roles in the biosynthesis of d‐viosamine are indicated in Scheme 1. We recently determined the high resolution X‐ray structure of R141, which represented the first three‐dimensional model of a viral 4,6‐dehydratase.13 We also demonstrated that the enzyme could function on either dTDP‐d‐glucose or UDP‐d‐glucose with nearly identical catalytic efficiency. Here we present a detailed structural and kinetic analysis of L136 which adds to the growing data base of virally encoded enzymes functioning in unusual sugar biosynthesis.
SCHEME 1.

Pathway for the biosynthesis of UDP‐4‐amino‐4,6‐dideoxy‐D‐glucose (UDP‐D‐viosamine)
2. RESULTS
2.1. Kinetic properties
The kinetic properties of L136 were determined via a discontinuous high‐performance liquid chromatography (HPLC) assay as described in Materials and Methods. Shown in Figure 1(a),(b) are the initial velocity curves utilizing either UDP‐4‐keto‐4,6‐dideoxy‐d‐glucose or dTDP‐4‐keto‐4,6‐dideoxy‐d‐glucose, respectively, as the substrate. The kinetic parameters are listed in Table 1 and as can be seen in Figure 1(a),(b), the enzyme displays classical Michaelis–Menten kinetics. Clearly L136 functions well on both the UDP‐ and the dTDP‐linked sugar substrates with catalytic efficiencies of 4,500 ± 200 and 5,800 ± 450 M−1 s−1, respectively. This is in sharp contrast to that previously reported whereby the activity of the enzyme using the dTDP‐linked sugar substrate was about one‐third compared to that observed for the UDP‐linked sugar substrate.10 The catalytic efficiency of L136 is typical to those observed for other sugar aminotransferases such as that from Psychrobacter cryohalolentis.14
FIGURE 1.

Plot of initial velocities versus substrate concentration for L136. Figure 1(a) and (b) are the initial velocity curves utilizing either UDP‐4‐keto‐4,6‐dideoxy‐d‐glucose or dTDP‐4‐keto‐4,6‐dideoxy‐d‐glucose, respectively, as the substrate. Note that measuring velocities over a wide range of substrate concentrations allows us to obtain data that define both k cat and k cat/K M well, which is not accomplished by measuring replicates at fewer different concentrations. The graph shown allows for a qualitative appreciation of the quality of the data; the quantitative goodness‐of‐fit to the Michaelis–Menten equation is given by the standard errors as described in Materials and Methods
TABLE 1.
Kinetic parameters for L136 and DesI
| Protein | Substrate | KM (mM) | kcat (s−1) | kcat/KM (M−1 s−1) |
|---|---|---|---|---|
|
L136 |
UDP‐4‐keto‐6‐deoxy‐d‐glucose | 0.34 ± 0.04 | 1.52 ± 0.21 | 4,500 ± 200 |
| dTDP‐4‐keto‐6‐deoxy‐d‐glucose | 0.21 ± 0.02 | 1.21 ± 0.11 | 5,800 ± 450 | |
|
DesI |
UDP‐4‐keto‐6‐deoxy‐d‐glucose | 0.90 ± 0.13 | 0.31 ± 0.03 | 340 ± 50 |
| dTDP‐4‐keto‐6‐deoxy‐d‐glucose | 0.26 ± 0.03 | 1.04 ± 0.07 | 4,000 ± 250 |
2.2. Structure of the wildtype L136/PMP/dTDP complex
In our previous studies on sugar aminotransferases, we have been able to trap the external aldimine by growing crystals of the proteins in the presence of PLP and the appropriate nucleotide‐linked sugar substrate.15, 16, 17 Surprisingly, when we crystallized L136 in the presence of 1 mM PLP and 5 mM dTDP‐4‐amino‐4,6‐dideoxy‐d‐glucose, the electron density shown in Figure 2(a) was observed. This electron density most likely corresponds to pyridoxamine 5′‐phosphate (PMP) and dTDP. The crystals took nearly 2 months to grow, and during that time we suspect that the back reaction, namely the formation of PMP and dTDP‐4‐keto‐4,6‐dideoxy‐d‐glucose, occurred. Given the fact that in our experience, the 4‐keto sugars are unstable, most like the dTDP‐4‐keto‐4,6‐dideoxy‐d‐glucose broke down to dTDP.
FIGURE 2.
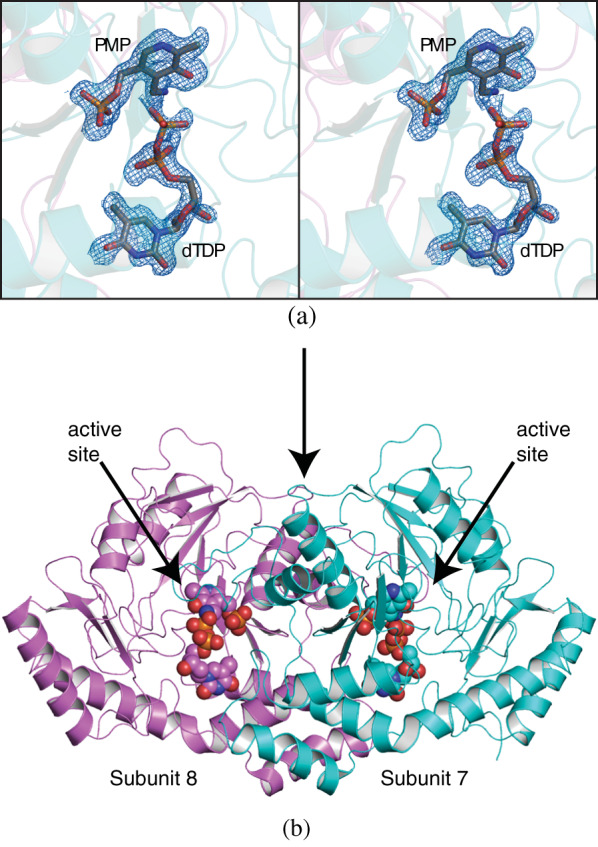
Structure of the wildtype enzyme in complex with PMP and dTDP. Shown in stereo in (a) is the observed electron density corresponding to the bound dTDP and PMP ligands. The map was calculated with (F o‐F c) coefficients and contoured at 3σ. The ligand was not included in the X‐ray coordinate file used to calculate the omit map, and thus there is no model bias. A ribbon representation of the L136 dimer is presented in (b)
Regardless, the crystals, which belonged to the P21 space group, allowed us to determine the first molecular model of L136 which was refined to an overall R‐factor of 18.4% at 1.7 Å resolution. There were 10 subunits in the crystallographic asymmetric unit with the individual polypeptide chains extending continuously from Lys 5 to Asn 352. Depending upon the subunit, there were additional amino acid residues observed at the N‐terminus. Tyr 307 in each subunit adopted the cis‐conformation, and its role in formation of the active site is discussed further below. The α‐carbons for subunit 1 versus the other nine polypeptide chains correspond with root‐mean‐square deviations of 0.21–0.31 Å. For the sake of clarity, the following discussion refers to subunits seven and eight in the asymmetric unit (α‐carbons superimpose with a root‐mean‐square deviation of 0.20 Å).
Shown in Figure 2(b) is a ribbon representation of L136. As expected, the dimeric enzyme adopts the molecular architecture characteristic of members in the Fold Type I superfamily of aminotransferases.18 The total buried surface area is extensive at 4300 Å2. Each subunit is composed of a seven‐stranded mixed β‐sheet, a four‐stranded mixed β‐sheet, and eight α‐helices. The positive end of the helix‐dipole moment formed by the third α‐helix projects towards the phosphoryl moiety of the PMP ligand. As observed in other sugar aminotransferases, the first α‐helix/turn/α‐helix of one subunit (Asp 15–Ser 49) projects towards the second subunit where it provides the necessary interactions to harbor the nucleotide‐linked sugar into the active site.
2.3. Structure of the external aldimine with UDP‐4‐amino‐4,6‐dideoxy‐d‐glucose
In our second attempt to determine the structure of L136 in the presence of the external aldimine, the K185A site‐directed mutant variant was constructed and the protein purified. Lys 185 is the conserved lysine in aminotransferases that forms a Schiff base with the PLP cofactor. This time the protein, in the presence of PLP and UDP‐4‐amino‐4,6‐dideoxy‐d‐glucose, crystallized in the P212121 space group with only two dimers in the asymmetric unit. The α‐carbons for the four subunits superimpose with root‐mean‐square deviations of between 0.18–0.21 Å. The following discussion refers to subunits 1 and 2 in the X‐ray coordinate file.
As can be seen in Figure 3(a), the external aldimine was, indeed, trapped. The model was refined to an overall R‐factor of 17.4% at 1.85 Å resolution. The pyranosyl group adopts a distorted 4C1 chair conformation whereas the ribose assumes the C‐2′ endo pucker. Shown in Figure 3(b) is a close‐up view of the active site. The side chain of Phe 92 forms a parallel stacking interaction with the pyridine ring of the external aldimine and also provides a binding platform for the pyranosyl group. In addition to its interactions with Phe 92, the pyridine ring of the cofactor is anchored into the active site by the side chains of Asp 156 and Tyr 307, which as described above adopts the cis‐peptide conformation. The phosphate moiety of the ligand is surrounded by the side chains of Thr 65, Ser 180, and the backbone amides of Gly 64 and Thr 65 from subunit 1. Additional interactions occur between it and the side chain of Asn 229 (from subunit 2) and two water molecules. The pyrophosphoryl group of the external aldimine lies within hydrogen bonding distance of seven water molecules and the side chains of Tyr 306 (subunit 1) and Asn 34 (subunit 2). The loop defined by Asn 30 to Asn 34 in subunit 2 envelops the uracil group with specific interactions provided by the carbonyl group of Asn 30 and the backbone amide groups of Tyr 32 and Thr 33. Notably, there are no interactions between the protein and the ribosyl group. The models of the L136/PMP/dTDP and the L136/external aldimine complexes superimpose with a root‐mean‐square deviation of 0.37 Å, and the active site architectures are virtually identical within experimental error.
FIGURE 3.

Structure of the K185A variant with the bound external aldimine formed with UDP‐4‐amino‐4,6‐dideoxy‐d‐glucose. The observed electron density, shown in stereo in (a), was calculated with (F o‐F c) coefficients and contoured at 3σ. A close‐up view of the active site is displayed in (b). Those side chains displayed in teal are contributed by subunit 1 whereas those colored in pink are provided by subunit 2. Ordered water molecules are displayed as red spheres, and possible hydrogen bonding interactions within 3.2 Å are indicated by the dashed lines
2.4. Structure of the external aldimine with dTDP‐4‐amino‐4,6‐dideoxy‐d‐glucose
The final structure determined in this investigation was that of L136 in complex with the external aldimine formed between PLP and dTDP‐4‐amino‐4,6‐dideoxy‐d‐glucose. The crystals utilized for this analysis also belonged to the space group P212121 with two dimers in the asymmetric unit. The model was refined at 1.95 Å resolution to an overall R‐factor of 17.5%. As can be seen in Figure 4(a), the observed electron density of the external aldimine in subunit 1 is unambiguous. This was true for all the subunits. The α‐carbons for the two external aldimines (UDP‐4‐amino‐4,6‐dideoxy‐d‐glucose versus dTDP‐4‐amino‐4,6‐dideoxy‐d‐glucose) correspond with a root‐mean‐square deviation of 0.11 Å. A superposition of the two models near the nucleotides is displayed in Figure 4(b). Other than the shift of the ribose C‐2 carbon by ~0.7 Å out of the active site, the two models are nearly identical.
FIGURE 4.

Structure of the K185A variant with the bound external aldimine formed with dTDP‐4‐amino‐4,6‐dideoxy‐d‐glucose. The observed electron density, shown in stereo in (a), was calculated with (F o‐F c) coefficients and contoured at 3σ. A superposition of the external aldimines formed with either UDP‐4‐amino‐4,6‐dideoxy‐d‐glucose (in gray) or dTDP‐4‐amino‐4,6‐dideoxy‐d‐glucose (in green) is displayed in (b). The stereo view focuses near the nucleotidyl groups of the external aldimines
3. DISCUSSION
3.1. Comparison of L136 with DesI from Streptomyces venezuelae
The structure of DesI from S. venezuelae was determined in this laboratory in 2007.19 DesI is a sugar aminotransferase that functions in the pathway for the biosynthesis of desosamine, a 3‐(dimethylamino)‐3,4,6‐trideoxyhexose found on such macrolide antibiotics as erythromycin, azithromycin, and clarithromycin.20 The reported model demonstrated for the first time the manner in which a sugar aminotransferase positions its substrate into the active site for equatorial transfer of the amino group to the C‐4′ position. The reaction product for DesI is shown in Scheme 2, and as can be seen it is the same as the L136 product albeit attached to dTDP rather than UDP. L136 and DesI display 23% and 40% amino acid identities and similarities, respectively.
SCHEME 2.

Reaction products for various sugar aminotransferases to be compared
Given that L136 functions almost equally well on both the UDP‐ and dTDP‐linked sugars we determined the kinetic parameters for DesI with both types of substrate to test its specificity. Shown in Figure 5(a),(b) are the initial velocity curves utilizing either UDP‐4‐keto‐4,6‐dideoxy‐d‐glucose or dTDP‐4‐keto‐4,6‐dideoxy‐d‐glucose, respectively, as the substrate. Unlike that observed for L136, DesI displays a profound preference for the dTDP‐linked sugar by over an order of magnitude in catalytic efficiency (Table 1).
FIGURE 5.

Plot of initial velocities versus substrate concentration for DesI. Figure 1(a) and (b) are the initial velocity curves utilizing either UDP‐4‐keto‐4,6‐dideoxy‐d‐glucose or dTDP‐4‐keto‐4,6‐dideoxy‐d‐glucose, respectively, as the substrate
Shown in Figure 6 is a close‐up stereo view of the region surrounding the nucleotidyl moieties in L136 and DesI. The α‐carbons for these two enzymes correspond with a root‐mean‐square deviation of 2.5 Å. As opposed to L136, there are two side chains, Leu 22 and Trp 46 in DesI that form a hydrophobic patch surrounding the region where the ribosyl 2‐OH group of the UDP group would be expected to bind. In addition, in L136, the side chain of Gln 31 points towards the ribosyl 2‐OH group, and as noted above this is replaced with Trp 46 in DesI. These differences are reflected in an increased in K M and a reduction in k cat when a UDP‐sugar is utilized as the substrate for DesI.
FIGURE 6.

Differences in the binding of the ligands in L136 versus DesI. Shown in stereo is a close‐up view of the protein regions surrounding the nucleotidyl portions of the external aldimines in L136 (white bonds) and DesI (green). Those residue labels with asterisks are contributed by the second subunit of the dimer
In addition to DesI, we have also structurally and biochemically characterized GDP‐perosamine synthase from Caulobacter crescentus, PglE from Campylobacter jejuni, and Pcryo_O638 from Psychrobacter cryohalolentis.14, 16, 21, 22 The reaction products for these aminotransferases are shown in Scheme 2. L136 and GDP‐perosamine synthase display an amino acid sequence identity and similarity of 24% and 41%, respectively; L136 and PglE demonstrate an amino acid sequence identity and similarity of 24% and 45% respectively, and finally L136 and Pcryo_O638 show an amino acid sequence identity and similarity of 22% and 42%, respectively. The α‐carbons of L136 and those of GDP‐perosamine synthase, PlgE, and Pcryo_O638 superimpose with root‐mean‐square deviations of 2.6 Å, 2.7 Å, and 3.1 Å, respectively.
An amino acid sequence alignment, prepared with the software package COBALT, is presented in Figure 7(a).23 As can be seen there are only 16 amino acids that are strictly conserved amongst these enzymes. Whereas such sequence alignments can be informative, they can also be misleading in the absence of structural data. Visual Inspection of the five models for the aminotransferases aligned in Figure 7(a) reveals 11 stretches of secondary structure that are conserved. These are indicated by the red bars in Figure 7(a). The basic core of these sugar aminotransferases, which consists of approximately 189 amino acid residues, is shown in stereo in Figure 7(b). As would be expected, the α‐carbons for the L136 core correspond to those of the other enzymes with much lower root‐mean‐square deviations. Specifically, the α‐carbons of DesI, GDP‐perosamine synthase, PlgE, and Pcryo_O638 superimpose onto those of L136 with root‐mean‐square deviations of 1.7 Å, 1.4 Å, 1.4 Å, and 1.5 Å, respectively. The amino acid sequence alignment presented in 7a is reasonably good except for Fragment 9, which implies there is seven residue deletion in L136. There is no deletion in this region.
FIGURE 7.
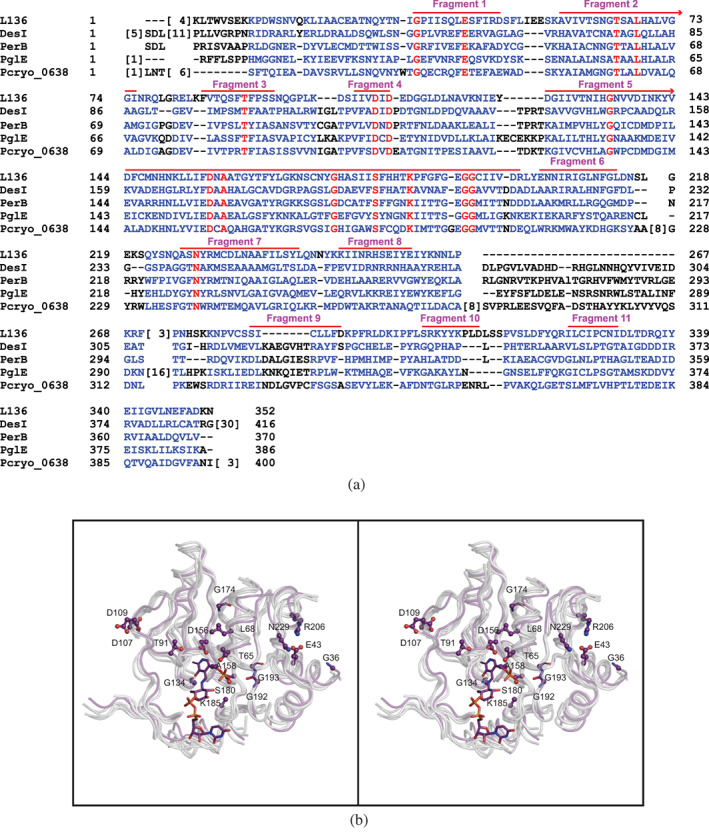
Comparison of L136 with DesI, PerB, PglE, and Pcryo_O638. An amino acid sequence alignment, constructed with the software package COBALT, is provided in (a). There are seven structurally conserved fragment in these enzymes that form the “core” of the aminotransferase structure as presented in stereo in (b). The purple α‐carbon trace corresponds to that of L136 whereas all the other enzymes are highlighted in white. The amino acid side chains shown correspond to those found in L136
The positions of the 16 amino acids that are strictly conserved in these aminotransferases are display in Figure 7(b). From the three‐dimensional models it is not clear why Gly 36, Leu 68, Thr 91, Asp 107, Asp 109, and Asn 299 are conserved. Lys 185 is conserved because it forms the Schiff base with PLP cofactor. With the exception of the Pcryo_O638 protein, Glu 43 participates in a salt bridge with Arg 206 (Figure 7(b)). Strikingly, in the Pcryo_O638 protein, the corresponding residue is a tryptophan. Thr 65 in Fragment 1 and Ser 180 in Fragment 5 are conserved because of their hydrogen bonding interactions with the phosphoryl group of the PLP cofactor. There are two residues in Fragment 5, namely Asp 156 and Ala 158, that are strictly conserved amongst these proteins. The carboxylate group of Asp 156 sits within hydrogen‐bonding distance of the pyridine ring nitrogen, and it is thought to play a key role in the reactivity of the cofactor by maintaining the pyridine nitrogen in a protonated state.24 The side chain of Ala 158 closely abuts the pyridine ring, and this region simply cannot accommodate a larger side chain. Gly 134 in Fragment 5 functions as the third residue in a distorted Type I′ turn that connects β‐strand 4 to α‐helix 4. Located in Fragment 6, Gly 174 is positioned in a tight bend of the random coil region connecting β‐strands 5 and 6. As can be seen in Figure 7(b), Gly 192 and Gly 193 in Fragment 5 are located in the next β‐strand over from where Thr 165 and Ser 180 are located. Given their important role in PLP‐binding, these conserved glycine residues may play a key role in maintaining the proper molecular architecture in this region.
In both L136 and DesI there is an asparagine/histidine couple (Asn 34/His 182 in L136) that provides a hydrogen‐bonding network connecting the pyranosyl C‐2′ hydroxy group with an α‐phosphoryl oxygen. In perosamine synthase whereby the pyranosyl C‐2′ hydroxyl group is in the axial position, this asparagine/histidine couple is replaced with Phe 183. The substrates for PlgE and Pcryo_O638 are identical with an N‐acetyl group attached to the C‐2′ hydroxy group. The manner in which they bind their substrates is remarkably different as noted previously.14 A superposition of the external aldimines for the all the proteins discussed here is provided in Figure 8. One commonality is the occurrence of an aromatic ring abutting the pyranosyl moiety and the pyridine ring of the cofactor (Figure 8). This provides a platform for positioning the external aldimine into the active site cleft, and is in keeping with the fact that carbohydrate/aromatic interactions are a common theme in sugar recognition.25, 26
FIGURE 8.

Binding of the external aldimines in L136, DesI, PerB, PglE, and Pcryo_O638. The positions of the external aldimines in L136, DesI, PerB, PglE, and Pcryo_O638 are shown in stereo and are color‐coded in violet, teal, blue, pink, and wheat, respectively
In summary, the structure of L136 presented here represents the first three‐dimensional structure of a sugar aminotransferase of viral origin. Given the worldwide pandemic brought about by SARS‐CoV‐2 this past year, it is clear that our understanding of the nature of viruses remains incomplete. The existence of the giant Mimivirus with a genome complexity comparable to some bacteria would not have been considered fathomable 20 years ago. Indeed, we are entering into an exciting phase of virology, and it should be expected that new paradigm‐shifting data will ultimately be revealed.
4. MATERIALS AND METHODS
4.1. Protein expression and purification
The gene encoding L136 from A. polyphaga Mimivirus was synthesized by Integrated DNA Technologies and placed into pET28t3g, a modified pET28b vector (Novagen), which yields a protein with an N‐terminal polyhistidine tag as previously described.27 The pET28t3g‐L136 plasmid was utilized to transform Rosetta2(DE3) Escherichia coli cells (Novagen). Cultures were grown in lysogeny broth supplemented with kanamycin and chloramphenicol (both at 50 mg/L concentration) at 37°C with shaking until an optical density of 0.8 was reached at 600 nm. The flasks were cooled in an ice bath, and the cells were induced with 1 mM isopropyl β‐d‐1‐thiogalactopyranoside and allowed to express protein at 21°C for 24 h.
The cells were harvested by centrifugation and frozen as pellets in liquid nitrogen. The pellets were subsequently disrupted by sonication on ice in a lysis buffer composed of 50 mM sodium phosphate, 20 mM imidazole, 10% glycerol, and 300 mM sodium chloride (pH 8.0). The lysate was cleared by centrifugation, and L136 was purified at 4°C utilizing Prometheus™ Ni‐NTA agarose (Prometheus Protein Biology Products) according to the manufacturer's instructions. All buffers were adjusted to pH 8.0 and contained 50 mM sodium phosphate, 300 mM sodium chloride, and imidazole concentrations of 20 mM for the wash buffer and 300 mM for the elution buffer. The polyhistidine tag was removed by digestion with TEV protease. The TEV protease and remaining tagged protein were removed by passage over Ni‐NTA agarose, and the tag‐free protein was dialyzed against 10 mM Tris–HCl (pH 8.0) and 200 mM NaCl. L136 was concentrated to 23 mg/ml based on an extinction coefficient of 1.09 (mg/ml)−1 cm−1. Selenomethionine‐labeled L136 was produced according to previously published methods.28 It was purified and concentrated as described for the wild‐type enzyme.
The K185A variant was constructed using the Stratagene QuikChange method of site‐directed mutagenesis. This protein was expressed and purified in the same manner as described for the wild‐type protein and concentrated to 25 mg/ml after final dialysis.
4.2. Crystallization
Crystals of L136 (wild‐type and selenomethionine‐labeled) were grown by macro seeding into batch experiments at room temperature. These batch trials contained 11%–14% poly(ethylene glycol) 8,000, 200 mM KCl, 1 mM PLP, 5 mM dTDP‐4‐amino‐4,6‐dideoxy‐d‐glucose, and 100 mM HEPES (pH 7.5). They belonged to the monoclinic space group P21 with unit cell dimensions of a = 74.9 Å, b = 126.9 Å, c = 206.4 Å and β = 90.9°. The asymmetric unit contained five dimers. For X‐ray data collection, the crystals were transferred to a cryo‐protectant solution composed of 22% poly(ethylene glycol) 8,000, 250 mM KCl, 250 mM NaCl, 15% ethylene glycol, 1 mM PLP, 5 mM dTDP‐4‐amino‐4,6‐dideoxy‐d‐glucose, and 100 mM HEPES (pH 7.5).
The mutant protein was crystallized in the presence of 1 mM PLP and 5 mM of either UDP‐4‐amino‐4,6‐dideoxy‐d‐glucose or dTDP‐4‐amino‐4,6‐dideoxy‐d‐glucose. Crystals were grown from 18–22% poly(ethylene glycol) 3,350, 2% 2‐methyl‐2,4‐pentanediol, and 100 mM MES (pH 6.0). They belonged to the orthorhombic space group P212121 with unit cell dimensions of a = 91.0 Å, b = 108.5 Å, and c = 146.0 Å and two dimers in the asymmetric unit. For X‐ray data collection the crystals were transferred to a cryo‐protectant solution composed of 26% poly(ethylene glycol) 3,350, 300 mM NaCl, 2% 2‐methyl‐2,4‐pentanediol, 18% ethylene glycol, 1 mM PLP, 5 mM UDP‐4‐amino‐4,6‐dideoxy‐d‐glucose (or dTDP‐4‐amino‐4,6‐dideoxy‐d‐glucose), and 100 mM MES (pH 6.0).
4.3. X‐ray data collection and processing
X‐ray data sets for the wild‐type and selenomethionine‐labeled protein were collected at the Advanced Photon Source, Structural Biology Center (Beamline 19‐BM) and were processed with HKL3000.29 X‐ray data sets for the K185A protein crystals were collected using a BRUKER D8‐VENTURE sealed tube system equipped with Helios optics and a PHOTON II detector. These X‐ray data sets were processed with SAINT and scaled with SADABS (Bruker AXS). Relevant X‐ray data collection statistics are listed in Table 2.
TABLE 2.
X‐ray data collection statistics and model refinement statistics
| Wild‐type PMP | K185A UDP‐4‐amino‐4,6‐dideoxy‐d‐glucose | K185A dTDP‐4‐amino‐4,6‐dideoxy‐d‐glucose | |
|---|---|---|---|
| Resolution limits (Å) |
50.0–1.7 (1.73–1.7)a |
50.0–1.85 (1.90 – 1.85)a |
50.0–1.95 (2.05 – 1.95)a |
| Number of independent reflections |
397,722 (18360) |
123,055 (9180) |
105,900 (14581) |
| Completeness (%) |
94.3 (87.4) |
99.8 (99.3) |
99.8 (99.7) |
| Redundancy |
4.1 (2.9) |
8.0 (3.0) |
10.7 (5.1) |
| Avg I/avg σ(I) |
36.2 (5.0) |
15.4 (4.0) |
16.2 (3.5) |
| Rsym (%)b |
5.5 (19.4) |
8.4 (44.3) |
9.0 (41.1) |
| R‐factor (overall)%/no. reflectionsc | 18.4/397722 | 17.4/123059 | 17.5/105900 |
| R‐factor (working)%/no. reflections | 18.2/377894 | 17.2/116878 | 17.3/100577 |
| R‐factor (free)%/no. reflections | 22.2/19828 | 21.9/6181 | 22.2/5323 |
| Number of protein atoms | 28,055 | 11,230 | 11,195 |
| Number of heteroatoms | 3,361 | 1,580 | 1,462 |
| Average B values | |||
| Protein atoms (Å2) | 25.5 | 13.2 | 15.3 |
| Ligand (Å2) | 34.9 | 8.0 | 19.6 |
| Solvent (Å2) | 31.2 | 21.1 | 22.5 |
| Weighted RMS deviations from ideality | |||
| Bond lengths (Å) | 0.010 | 0.010 | 0.008 |
| Bond angles (°) | 1.62 | 1.61 | 1.50 |
| Planar groups (Å) | 0.009 | 0.008 | 0.007 |
| Ramachandran regions (%)d | |||
| Most favored | 96.9 | 96.8 | 96.7 |
| Additionally allowed | 3.1 | 3.2 | 3.3 |
| Generously allowed | 0.0 | 0.0 | 0.0 |
Statistics for the highest resolution bin.
Rsym = (∑|I ‐ |/ ∑ I) × 100.
R‐factor = (∑|Fo−Fc| / ∑|Fo|) × 100, where Fo is the observed structure‐factor amplitude and Fc . is the calculated structure‐factor amplitude.
Distribution of Ramachandran angles according to PROCHECK.35
4.4. Structure solution and refinement
An initial polyalanine model for L136 was generated from a selenium SAD data set using the program CRANK2.30 This polyalanine model was then used as a search model for molecular replacement with PHASER against the wild‐type data.31 Iterative cycles of model‐building with COOT and refinement with REFMAC led to a final X‐ray model with an overall R‐factor of 18.4%.32, 33, 34 Refinement statistics are provided in Table 1. The K185A structures were solved using PHASER and the refined model of the wild‐type enzyme as the search probe.
4.5. Determination of kinetic parameters
Kinetic constants were determined via a discontinuous assay using an ÄKTA HPLC system. Reaction rates were determined by calculating the amount of aminated product (UDP‐4‐amino‐4,6‐dideoxy‐d‐glucose/dTDP‐4‐amino‐4,6‐dideoxy‐d‐glucose) formed based on the peak area of the HPLC trace measured at 262 nm for the UDP‐sugar product and 267 nm for the dTDP‐sugar product. The area was correlated to concentration via a calibration curve created with standard samples that had been treated in the same manner as the reaction aliquots. Kinetic parameters for L136 with UDP‐4‐keto‐4,6‐dideoxy‐d‐glucose as a substrate were determined using 2 ml reactions containing 50 mM HEPPS (pH 8), 0.5 mM PLP, 50 mM sodium glutamate, and 1.0 micromolar L136. The UDP‐4‐keto‐4,6‐dideoxy‐d‐glucose concentrations were varied from 0.05–4.0 millimolar. Nine 200 μl aliquots were taken over a 5 min time period, and the reaction aliquots quenched by the addition of 6 μl of 6 M HCl. 200 μl of carbon tetrachloride were then added, the samples were vortexed and then spun at 14000xg for 2 minutes, and 150 μl of the aqueous phase taken for analysis via HPLC. The samples were diluted with 2 ml of water and loaded onto a 1 ml ResQ column. The amino sugar product was quantified after elution with a 10 column volume gradient from 0 to 750 mM ammonium acetate (pH 4.0). For determination of the kinetic parameters using dTDP‐4‐keto‐4,6‐dideoxy‐d‐glucose as a substrate, the concentration was varied from 0.05 to 5 mM, again using L136 at a concentration of 1.0 micromolar.
Kinetic parameters for S. venezuelae DesI were measured in the same manner as for L136. The dTDP‐4‐keto‐4,6‐dideoxy‐d‐glucose concentration was varied from 0.05–5.0 mM using 1.0 micromolar DesI, whereas the UDP‐4‐keto‐4,6‐dideoxy‐d‐glucose concentrations ranged from 0.1–10 mM using 4.0 micromolar DesI. The DesI protein was purified as previously described.19
The data were fitted to the equation: v 0 = (V max[S])/(K M + [S]). The k cat values were calculated according to the equation: k cat = V max/[ET]. Kinetic parameters are provided in Table 1.
4.6. Synthesis of UDP‐ and dTDP‐4‐keto‐4,6‐dideoxy‐d‐glucose
50 mM solutions of UDP‐ or dTDP‐d‐glucose were prepared in 50 mM HEPPS (pH 8.0) containing 20 mg/ml R141 (Scheme 1). Following overnight incubation at room temperature, the enzyme was removed by filtration through a 30 kDa membrane, and the conversion to the 4‐keto products verified by HPLC. The required R141 was purified as previously described.13
4.7. Synthesis of UDP‐ and dTDP‐4‐amino‐4,6‐dideoxy‐d‐glucose
A 100 ml solution containing 5 mM UDP‐glucose, 0.5 mM PLP, 50 mM sodium glutamate, and 50 mM HEPPS was adjusted to pH 8.0. R141 was added to a final concentration of 0.5 mg/ml followed by addition of L136 to a final concentration of 1.5 mg/ml. This reaction was allowed to incubate overnight at room temperature. The enzymes were removed by filtration through a 30 kDa filtration membrane. The solution was then diluted 10x with water and loaded onto a 50 ml HiLoad™ 26/10 Q Sepharose HP column (GE Healthcare). Purification was accomplished with a 12 column volume gradient from 0 to 0.9 M ammonium acetate at pH 4.0 with the UDP‐4‐amino‐4,6‐dideoxy‐d‐glucose eluting at an ammonium acetate concentration of about 300 mM. The solvent was removed by lyophilization and the resulting solids dissolved in 250 ml water. This solution was then loaded onto the same column, but this time eluted with a 12 column volume gradient from 0 to 0.8 M ammonium bicarbonate at pH 8.5. The UDP‐4‐amino‐4,6‐dideoxy‐d‐glucose eluted at an ammonium bicarbonate concentration of about 325 mM. Water and ammonium bicarbonate were removed via lyophilization, followed by several more rounds of lyophilization to ensure removal of as much bicarbonate as possible.
The required dTDP‐4‐amino‐4,6‐dideoxy‐d‐glucose was synthesized and purified in the same manner with the replacement of dTDP‐d‐glucose for UDP‐d‐glucose.
CONFLICT OF INTEREST
The authors have no competing financial interests.
AUTHOR CONTRIBUTIONS
Chase A. Seltzner: Data curation; investigation. Justin Ferek: Data curation; formal analysis; investigation. James Thoden: Conceptualization; data curation; formal analysis; investigation; methodology. Hazel Holden: Formal analysis; project administration; validation; visualization; writing‐original draft; writing‐review & editing.
ACKNOWLEDGMENT
This work is supported by NIH R35 GM134643 to Hazel M. Holden.
Seltzner CA, Ferek JD, Thoden JB, Holden HM. Characterization of an aminotransferase from Acanthamoeba polyphaga Mimivirus . Protein Science. 2021;30:1882–1894. 10.1002/pro.4139
REFERENCES
- 1.Bos L. The embryonic beginning of virology: Unbiased thinking and dogmatic stagnation. Arch Virol. 1995;140:613–619. [DOI] [PubMed] [Google Scholar]
- 2.Shope RE. Thomas Milton RIVERS, 1888‐1962. J Bacteriol. 1962;84:385–388. [DOI] [PMC free article] [PubMed] [Google Scholar]
- 3.La Scola B, Audic S, Robert C, et al. A giant virus in amoebae. Science. 2003;299:2033. [DOI] [PubMed] [Google Scholar]
- 4.Xiao C, Chipman PR, Battisti AJ, et al. Cryo‐electron microscopy of the giant Mimivirus . J Mol Biol. 2005;353:493–496. [DOI] [PubMed] [Google Scholar]
- 5.Raoult D, Audic S, Robert C, et al. The 1.2‐megabase genome sequence of Mimivirus . Science. 2004;306:1344–1350. [DOI] [PubMed] [Google Scholar]
- 6.Sun TW, Yang CL, Kao TT, Wang TH, Lai MW, Ku C. Host range and coding potential of eukaryotic giant viruses. Viruses. 2020;12:1337. [DOI] [PMC free article] [PubMed] [Google Scholar]
- 7.Rodrigues RA, dos Santos Silva LK, Dornas FP, et al. Mimivirus fibrils are important for viral attachment to the microbial world by a diverse glycoside interaction repertoire. J Virol. 2015;89:11812–11819. [DOI] [PMC free article] [PubMed] [Google Scholar]
- 8.Kuznetsov YG, Xiao C, Sun S, Raoult D, Rossmann M, McPherson A. Atomic force microscopy investigation of the giant Mimivirus . Virology. 2010;404:127–137. [DOI] [PubMed] [Google Scholar]
- 9.Klose T, Kuznetsov YG, Xiao C, Sun S, McPherson A, Rossmann MG. The three‐dimensional structure of Mimivirus . Intervirology. 2010;53:268–273. [DOI] [PMC free article] [PubMed] [Google Scholar]
- 10.Piacente F, Marin M, Molinaro A, et al. Giant DNA virus Mimivirus encodes pathway for biosynthesis of unusual sugar 4‐amino‐4,6‐dideoxy‐d‐glucose (viosamine). J Biol Chem. 2012;287:3009–3018. [DOI] [PMC free article] [PubMed] [Google Scholar]
- 11.Piacente F, Gaglianone M, Laugieri ME, Tonetti MG. The autonomous glycosylation of large DNA viruses. Int J Mol Sci. 2015;16:29315–29328. [DOI] [PMC free article] [PubMed] [Google Scholar]
- 12.Parakkottil Chothi M, Duncan GA, Armirotti A, et al. Identification of an l‐rhamnose synthetic pathway in two nucleocytoplasmic large DNA viruses. J Virol. 2010;84:8829–8838. [DOI] [PMC free article] [PubMed] [Google Scholar]
- 13.Ferek JD, Thoden JB, Holden HM. Biochemical analysis of a sugar 4,6‐dehydratase from Acanthamoeba polyphaga Mimivirus . Protein Sci. 2020;29:1148–1159. [DOI] [PMC free article] [PubMed] [Google Scholar]
- 14.Linehan MP, Thoden JB, Holden HM. Characterization of two enzymes from Psychrobacter cryohalolentis that are required for the biosynthesis of an unusual diacetamido‐d‐sugar. J Biol Chem. 2021;296:100463. [DOI] [PMC free article] [PubMed] [Google Scholar]
- 15.Burgie ES, Holden HM. Three‐dimensional structure of DesVI from Streptomyces venezuelae: a sugar N,N‐dimethyltransferase required for dTDP‐desosamine biosynthesis. Biochemistry. 2008;47:3982–3988. [DOI] [PubMed] [Google Scholar]
- 16.Riegert AS, Young NM, Watson DC, Thoden JB, Holden HM. Structure of the external aldimine form of PglE, an aminotransferase required for N,N'‐diacetylbacillosamine biosynthesis. Protein Sci. 2015;24:1609–1616. [DOI] [PMC free article] [PubMed] [Google Scholar]
- 17.Dow GT, Gilbert M, Thoden JB, Holden HM. Structural investigation on WlaRG from Campylobacter jejuni: A sugar aminotransferase. Protein Sci. 2017;26:586–599. [DOI] [PMC free article] [PubMed] [Google Scholar]
- 18.Jansonius JN. Structure, evolution and action of vitamin B6‐dependent enzymes. Curr Opin Struct Biol. 1998;8:759–769. [DOI] [PubMed] [Google Scholar]
- 19.Burgie ES, Holden HM. Molecular architecture of DesI: A key enzyme in the biosynthesis of desosamine. Biochemistry. 2007;46:8999–9006. [DOI] [PMC free article] [PubMed] [Google Scholar]
- 20.Nedal A, Zotchev SB. Biosynthesis of deoxyaminosugars in antibiotic‐producing bacteria. Appl Microbiol Biotechnol. 2004;64:7–15. [DOI] [PubMed] [Google Scholar]
- 21.Cook PD, Carney AE, Holden HM. Accommodation of GDP‐linked sugars in the active site of GDP‐perosamine synthase. Biochemistry. 2008;47:10685–10693. [DOI] [PMC free article] [PubMed] [Google Scholar]
- 22.Cook PD, Holden HM. GDP‐perosamine synthase: Structural analysis and production of a novel trideoxysugar. Biochemistry. 2008;47:2833–2840. [DOI] [PubMed] [Google Scholar]
- 23.Papadopoulos JS, Agarwala R. COBALT: Constraint‐based alignment tool for multiple protein sequences. Bioinformatics. 2007;23:1073–1079. [DOI] [PubMed] [Google Scholar]
- 24.Toney MD. Aspartate aminotransferase: An old dog teaches new tricks. Arch Biochem Biophys. 2014;544:119–127. [DOI] [PMC free article] [PubMed] [Google Scholar]
- 25.Muraki M. The importance of CH/pi interactions to the function of carbohydrate binding proteins. Protein Pept Lett. 2002;9:195–209. [DOI] [PubMed] [Google Scholar]
- 26.Asensio JL, Arda A, Canada FJ, Jimenez‐Barbero J. Carbohydrate‐aromatic interactions. Acc Chem Res. 2013;46:946–954. [DOI] [PubMed] [Google Scholar]
- 27.Thoden JB, Holden HM. The molecular architecture of human N‐acetylgalactosamine kinase. J Biol Chem. 2005;280:32784–32791. [DOI] [PubMed] [Google Scholar]
- 28.Thoden JB, Timson DJ, Reece RJ, Holden HM. Molecular structure of human galactokinase: Implications for type II galactosemia. J Biol Chem. 2005;280:9662–9670. [DOI] [PubMed] [Google Scholar]
- 29.Minor W, Cymborowski M, Otwinowski Z, Chruszcz M. HKL‐3000: The integration of data reduction and structure solution–from diffraction images to an initial model in minutes. Acta Crystallogr. 2006;D62:859–866. [DOI] [PubMed] [Google Scholar]
- 30.Ness SR, de Graaff RA, Abrahams JP, Pannu NS. CRANK: New methods for automated macromolecular crystal structure solution. Structure. 2004;12:1753–1761. [DOI] [PubMed] [Google Scholar]
- 31.McCoy AJ, Grosse‐Kunstleve RW, Adams PD, Winn MD, Storoni LC, Read RJ. Phaser crystallographic software. J Appl Cryst. 2007;40:658–674. [DOI] [PMC free article] [PubMed] [Google Scholar]
- 32.Emsley P, Cowtan K. Coot: Model‐building tools for molecular graphics. Acta Crystallogr. 2004;D60:2126–2132. [DOI] [PubMed] [Google Scholar]
- 33.Emsley P, Lohkamp B, Scott WG, Cowtan K. Features and development of Coot. Acta Crystallogr. 2010;D66:486–501. [DOI] [PMC free article] [PubMed] [Google Scholar]
- 34.Murshudov GN, Vagin AA, Dodson EJ. Refinement of macromolecular structures by the maximum‐likelihood method. Acta Crystallogr. 1997;D53:240–255. [DOI] [PubMed] [Google Scholar]
- 35.Laskowski RA, MacArthur MW, Moss DS, Thornton JM. PROCHECK: A program to check the stereochemical quality of protein structures. J Appl Cryst. 1993;26:283–291. [Google Scholar]