

Abstract
When amino acids vary during evolution, the outcome can be functionally neutral or biologically‐important. We previously found that substituting a subset of nonconserved positions, “rheostat” positions, can have surprising effects on protein function. Since changes at rheostat positions can facilitate functional evolution or cause disease, more examples are needed to understand their unique biophysical characteristics. Here, we explored whether “phylogenetic” patterns of change in multiple sequence alignments (such as positions with subfamily specific conservation) predict the locations of functional rheostat positions. To that end, we experimentally tested eight phylogenetic positions in human liver pyruvate kinase (hLPYK), using 10–15 substitutions per position and biochemical assays that yielded five functional parameters. Five positions were strongly rheostatic and three were non‐neutral. To test the corollary that positions with low phylogenetic scores were not rheostat positions, we combined these phylogenetic positions with previously‐identified hLPYK rheostat, “toggle” (most substitution abolished function), and “neutral” (all substitutions were like wild‐type) positions. Despite representing 428 variants, this set of 33 positions was poorly statistically powered. Thus, we turned to the in vivo phenotypic dataset for E. coli lactose repressor protein (LacI), which comprised 12–13 substitutions at 329 positions and could be used to identify rheostat, toggle, and neutral positions. Combined hLPYK and LacI results show that positions with strong phylogenetic patterns of change are more likely to exhibit rheostat substitution outcomes than neutral or toggle outcomes. Furthermore, phylogenetic patterns were more successful at identifying rheostat positions than were co‐evolutionary or eigenvector centrality measures of evolutionary change.
Keywords: evolution, lactose repressor protein, phylogeny, pyruvate kinase, rheostat positions
1. INTRODUCTION
Advances in personalized medicine and bioengineering require more accurate predictions of the functional outcomes of amino acid substitutions. Although decades of work have been directed to this effort, the majority of prior substitution studies were biased toward positions that are conserved during evolution.1 This in turn inadvertently biased the development of many computer algorithms, which rely upon the general principles derived from substitutions at conserved positions.2 However, we previously showed that these general substitution principles do not apply to a subset of evolutionarily nonconserved positions3, 4, 5 and that, likely as a direct consequence, their substitution predictions fail.2
We have thus turned our attention to better describing this special subset of nonconserved positions. One of their defining features is that, when individually substituted with a range of amino acids, various functional parameters (e.g., binding affinity, allosteric regulation) are modulated. Indeed, the functional range for each position can span several orders of magnitude.3, 4, 5, 6, 7 As such, substitutions at these “rheostat” positions provide ready opportunities for fine‐tuning function during evolution and protein engineering. The rheostat substitution behavior is strikingly different from (i) positions for which most substitutions abolish function (a “toggle” substitution outcome; e.g., 2) and (ii) positions that can accommodate a range of substitutions without any change in protein function (a “neutral” substitution outcome; e.g., 8). Both toggle and neutral positions are often associated with their own evolutionary signatures: conserved positions are expected to exhibit toggle substitution behavior, whereas highly nonconserved positions may be expected to exhibit neutral substitution behavior.
The fact that both rheostat and neutral positions have been associated with nonconservation is a conundrum. A resolution could be realized by considering that “nonconservation” can be divided into several categories, based on the absence or presence of change patterns in multiple sequence alignments. Random amino acid changes (no pattern) are expected for positions that lack structural or functional evolutionary constraints. In contrast, changes at other positions are the means by which homologs accrue biologically significant change. For example, both paralogs and isozymes use sequence change to evolve functional differences important to organismal success.
Several analyses have been developed to detect patterns of change that might be associated with functional importance. These patterns can be grouped into three major classes: (i) positions with pairwise co‐evolution, (ii) positions constrained by “interactions” with multiple positions (“eigenvector centrality”; note that “interactions” are not necessarily direct structural contacts, as discussed in9, 10), and (iii) positions for which amino acid changes are related to branching in the protein family's phylogenetic tree. Another way to think of this third class of “phylogenetic” positions is that they are nonconserved in the whole family but conserved within subfamilies.
Indeed, comparisons of phylogenetic positions in the linker region of 15 engineered LacI/GalR homologs led to the first discovery of rheostat positions.5 The association between rheostat and phylogenetic positions was subsequently one of the parameters tested in the machine learning “fuNTRp” predictor, which included the phylogenetic algorithm ConSurf11 in endeavors to discriminate rheostat, neutral, and toggle phenotypes for individual positions.12 Although ConSurf scores contributed ~34% to the fuNTRp signal, this tool was not trained on biochemical functional data. Instead, fuNTRp was trained on complex phenotypic data derived from deep mutational scanning experiments, which used allele frequency to infer changes in cellular phenotype that, in turn, arose from altered protein function(s) and/or stability. Thus, the goals of the current study were (i) to directly evaluate the correlation between phylogenetic signatures and rheostat positions that modulate functional parameters measured in biochemical assays and (ii) to determine whether other patterns of evolutionary change (not included in fuNTRp) could help to discriminate rheostat, toggle, and neutral positions.
As a model system, we first assessed whether phylogenetic positions in human liver pyruvate kinase (hLPYK; Figure 1) exhibited rheostatic substitution outcomes in any of five biochemical parameters associated with its catalytic function and allosteric regulation. Next, we retrospectively compared substitutions for a larger set of hLPYK rheostat, neutral, and toggle positions to a wide range of pattern scores deduced from sequence alignments. However, even though this data set comprised 428 hLPYK variants, they described overall substitution outcomes for only 33 positions, which was insufficient power for statistical analyses.
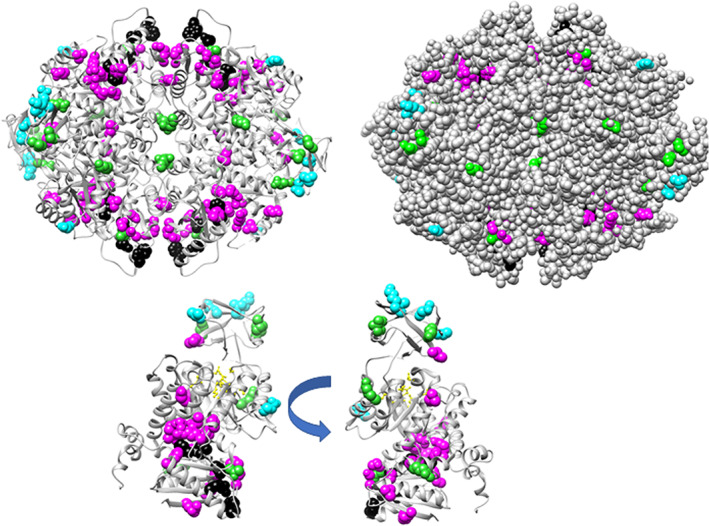
FIGURE 1.
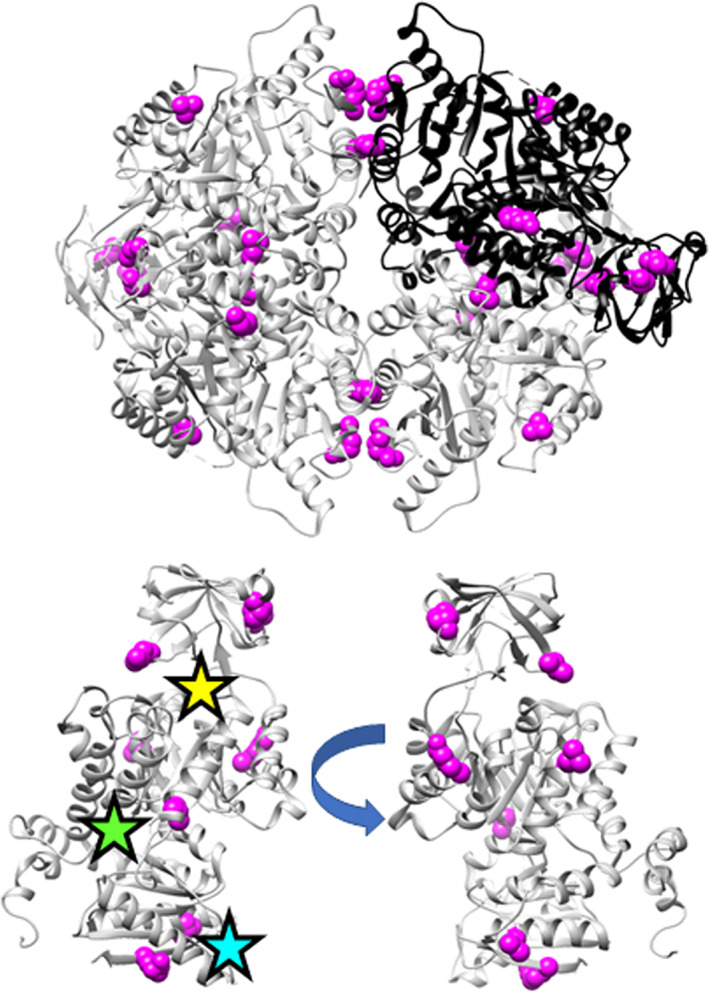
Locations of the phylogeny positions on the hLPYK structure (PDB: 4IMA 87). The top structure shows the homotetramer, for which three subunits have gray ribbons and one has a black ribbon. The lower structures show two views of the structure of a single monomer, with stars approximating the locations of the active (yellow), allosteric inhibitor (green), and allosteric activator (cyan) sites. Magenta spheres identify positions with strong phylogeny scores tested in this study: 107, 177, 192, 259, 107, 423, and 538
Thus, we tested bioinformatic correlations in a second protein, utilizing the whole protein dataset available for the Escherichia coli lactose repressor protein (LacI). The latter comprised in vivo repression and induction phenotypes for 12–13 substitutions at 329 LacI positions (summarized in13, 14; hereafter referred to as the “Miller data”) and thus provided the statistical power needed to assess correlations of rheostat positions with various types of nonconserved scores. Results from both hLPYK and LacI show that phylogenetic positions are more likely to show rheostat substitution outcomes than neutral or toggle outcomes. Furthermore, algorithms that detected phylogenetic patterns were more successful at identifying rheostat positions than were co‐evolutionary or eigenvector centrality measures.
2. RESULTS
2.1. Biochemical testing of substitution outcomes for phylogenetic positions in hLPYK positions
hLPYK is a homotetramer responsible for converting phosphoenolpyruvate (PEP) and adenosine diphosphate (ADP) into pyruvate and adenosine triphosphate (ATP) as the last step in glycolysis. hLPYK is allosterically activated by fructose‐1,6‐bisphosphate (abbreviated as Fru‐1,6‐BP in the text and as FBP in parameter names) and allosterically inhibited by alanine (Ala).15 These two effectors bind to distinct sites on hLPYK, and thus five functional parameters—reflecting binding and allosteric response—were determined for each substituted protein: K a‐PEP, K ix‐Ala, K ix‐FBP, Q ax‐Ala, Q ax‐FBP. K a‐PEP is an apparent affinity value for PEP in the absence of effector. K ix‐Ala and K ix‐FBP are binding constants for the respective allosteric effectors, in the absence of PEP. Q ax‐Ala and Q ax‐FBP are the allosteric coupling constants between PEP binding and the respective allosteric effector binding and are equal to the ratio of PEP affinity in the absence of effector over the PEP affinity in the presence of saturating effector. These relationships of these parameters to the functional data are shown in Figure S1, and values determined for positions in the current study are in Table S1.
To select hLPYK positions for this study, we first used a variety of algorithms to analyze a previously curated sequence alignment comprising 241 PYK sequences that ranged from <20% to 99% sequence identity, in organisms from bacteria to mammals.16 The resulting bioinformatic scores for experimentally assessed hLPYK positions are presented in Table S2. Current experiments focused on positions with high phylogenetic scores and were chosen by their TEAO‐specificity scores.17 These scores were convenient for guiding experiments because TEAO ranks subfamily‐conserved (i.e., putative rheostat) positions at the top of its specificity list, whereas the other two phylogenetic algorithms rank these positions in the middle of the list. Further, since an individual position could have high scores in both phylogenetic and co‐evolutionary analyses (Figure S2), we performed a two‐tier selection of hLPYK positions, first identifying those within the top 15% of TEA‐O specificity scores and then de‐selecting any within the top 20% of co‐evolving scores. This allowed us to focus on positions that only showed a strong phylogenetic pattern.
hLPYK positions 107, 156, 177, 192, 259, 320, 423, and 538 met these criteria and were subjected to mutation and biochemical characterization (Figure 1). Each position was randomly substituted with ~10 to 15 amino acids. The resulting functional changes for each variant were quantified via five functional parameters (Figure 2, Table S1), each of which were then individually analyzed with the RheoScale calculator4 to quantitatively assign substitution outcomes for each position (Figure 3, Figure S3, Table S2). (Note that an individual position can exhibit a rheostat, toggle, or neutral substitution outcome for each of the five functional parameters; at neutral positions, most substitutions have function similar to wild‐type; at toggle positions, most substitutions abolish function.) Previous studies determined thresholds for the rheostat, toggle, and neutral scores that were used to assign an overall substitution behavior to each position2, 4, 8; those thresholds are indicated in Figure 3 by dashed horizontal lines.
FIGURE 2.
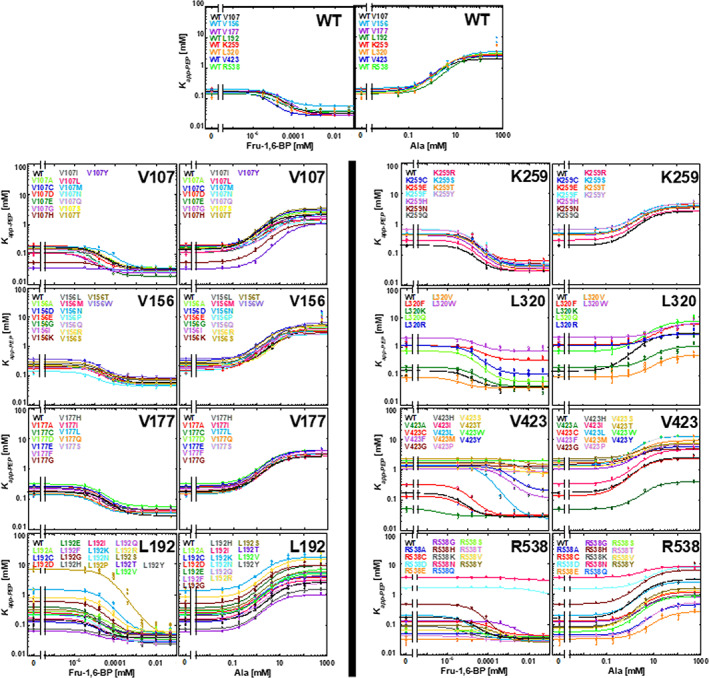
Functionality of hLPYK variants in response to allosteric effectors. At each indicated position, data are shown for all variants with measurable activity. For each pair of plots, activation in the presence of Fru‐1,6‐BP is shown on the left and inhibition in the presence of alanine is shown on the right. For all variants of one position, assays were conducted at the same time along with a wild‐type sample. The full set of wild‐type assays is shown in the top two panels to demonstrate reproducibility. Each value of K app‐PEP (y‐axis) was determined from samples with varied PEP concentrations; K app‐PEP corresponds to the concentration of PEP that yielded half‐maximal velocity. Varied concentrations of the allosteric activator and inhibitor, Fru‐1,6‐BP and Ala respectively (x‐axis) were used to determine values for K a‐PEP (y intercept). Error bars on each data point (some are smaller than actual data point) represent fit errors in K app‐PEP. See Figure S1 for more explanation of these plots and data fitting
FIGURE 3.
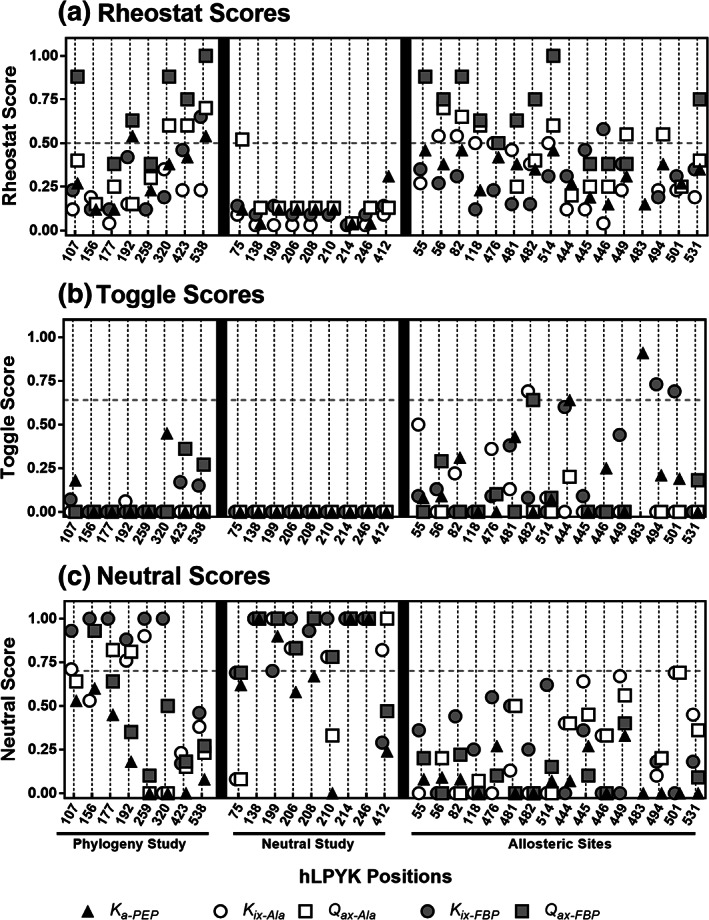
RheoScale scores for hLPYK positions indicate their rheostatic (a), toggle (b), and neutral (c) substitution outcomes. The hLPYK positions from the current (“Phylogeny Study”) and prior studies4, 6, 8 are listed on the x‐axis. Positions in the prior “Neutral Study” were chosen by their having an absence of a detectable evolutionary pattern in the pYK sequence alignment. Positions in the prior “Allostery Study” were located in or near the two hLPYK allosteric binding sites. The RheoScale calculator was used to determine the overall effect a variant on the protein with respect to affinity to PEP (K a‐PEP), allosteric inhibition (K ix‐Ala), coupling of PEP and Ala (Q ax‐Ala), allosteric activation (K ix‐FBP), and coupling of the allosteric activator to PEP (Q ax‐FBP). Vertical dashed lines are to aid visual inspection of 5 symbols plotted for each position. Horizontal dashed lines represent the empirical significance thresholds determined for the three types of substitution outcomes2, 4, 6, 8
Of the eight phylogenetic positions evaluated, positions 107, 192, 320, 423, and 538 had strong rheostatic behavior in at least one parameter. Furthermore, four of these positions exhibited rheostatic outcomes for multiple functional parameters; similar “multiplex” behavior has been previously noted for positions near the hLPYK allosteric sites.4, 6 In contrast, the four multiplex positions in this study were located far from the allosteric or catalytic sites (Figure 1); three are located in PYK subunit and domain interfaces, which are known to play significant roles in PYK allosteric communication.18, 19, 20, 21, 22, 23, 24, 25, 26 Other notable features for each position are included in Supplementary Material.
The other three phylogenetic positions—156, 177, and 259—did not exhibit strong rheostatic substitution behavior in any single parameter, but they also failed to meet the criteria previously defined for neutral positions.8 To better evaluate the non‐neutrality of these positions, we combined all available measurements for each position (all variants, each with up to 5 functional parameters) to generate a “composite neutral” score (Figure 4). Overall, the phylogenetic positions of this study had fewer neutral outcomes (lower composite neutral scores) than those in a prior study that searched for neutral positions.8 Notably, for phylogenetic position 259, >60% of the variants' parameters were not neutral, which indicates significant functional perturbation even though this position did not meet the threshold established for a strong rheostat position.
FIGURE 4.
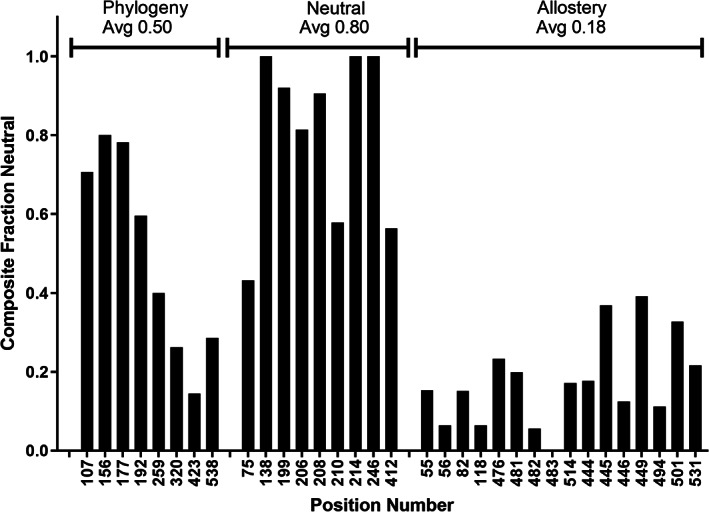
Composite neutral scores for hLPYK positions. The combined scores were calculated using all available values for the five functional parameters, as described in Section 4. A score of one means that, at the indicated position, all functional parameters for all variants were equivalent to wild‐type. A score of zero means that no functional parameter for any variant at that position was like wild‐type. The three hLPYK studies are denoted at the top of the plot, along with the average composite neutral score for that study. The “phylogeny” positions in this work were chosen by their high TEA‐O specificity scores. The “neutral” positions were chosen by their lack of change pattern in the sequence alignment.8 The “allostery” positions were chosen by their proximities to allosteric binding sites.4, 6, 8 The composite neutral calculation shows that the functional parameters of the phylogeny positions were more susceptible to change than then those in the neutral study
2.2. Retrospective comparison with PYK bioinformatic signatures
The results above support the hypothesis that rheostat positions can be identified by high phylogenetic scores. However, they do not test the corollary that positions with low phylogenetic scores are not rheostat positions. Thus, we next performed a retrospective study of all the PYK positions for which we have multi‐variant substitution sets (e.g., Figure 3). These 33 positions included (i) positions in and near the allosteric binding sites, which contained both rheostat and toggle positions (“Allostery Study”4, 6) and (ii) positions identified by their lack of identifiable change patterns, which comprised mostly neutral and near‐neutral positions (“Neutral Study”8). For the retrospective analysis, these sets of positions were regrouped based on their substitution outcomes (neutral, rheostat, or toggle). Six positions did not fall in any of these categories: Their substitutions differed too much from wild‐type to be classified as neutral positions, but their substitutions did not sample enough of the accessible functional ranges to be classified as rheostat positions. Thus, we treated them as a fourth type of substitution outcome (“Moderate”) (Figure 5).
FIGURE 5.
Locations of the rheostat, toggle, neutral, and moderate positions on the hLPYK structure (PDB: 4IMA 87). The top left structure shows the homotetramer as a ribbon. The top right shows the structure in spacefilling to highlight the solvent exposed positions. The lower structures show two views of a single monomer. Positions with rheostat outcomes (magenta) comprised 55, 56, 75, 82, 107, 118, 192, 320, 423, 446, 449, 476, 481, 514, 531, and 538. Toggle substitution outcomes (black) were observed for positions 444, 501, 482, 483, and 494. Neutral substitution outcomes (cyan) were observed for positions 138,199, 206, 208, 214, and 246. Moderate substitution outcomes (lime green) were observed at positions 156, 177, 210, 412, 259, and 445. For structural reference the catalytic sites are shown in yellow (positions 85, 87, 89, 125, 126, 284, 308, and 340)
These four substitution types were plotted to show their distributions of various scores derived from the PYK multiple sequence alignment (Figure 6). Kruskal–Wallis ANOVA was used to test the null hypothesis that all four groups derived from the same distribution of scores. This hypothesis was refuted for all score sets except sequence entropy, which showed little ability to discriminate the four types of substitution outcomes (p values are listed in Figure 6 legend). Although the four distributions appear to be distinct, their overlap hinders reliable predictions about individual positions. Instead (and as used in the current study), these methods would at best be suited for identifying a group of positions with greater chance of containing rheostat positions. However, as detailed in the next paragraph, several caveats prevented our reaching this conclusion from this dataset alone.
FIGURE 6.
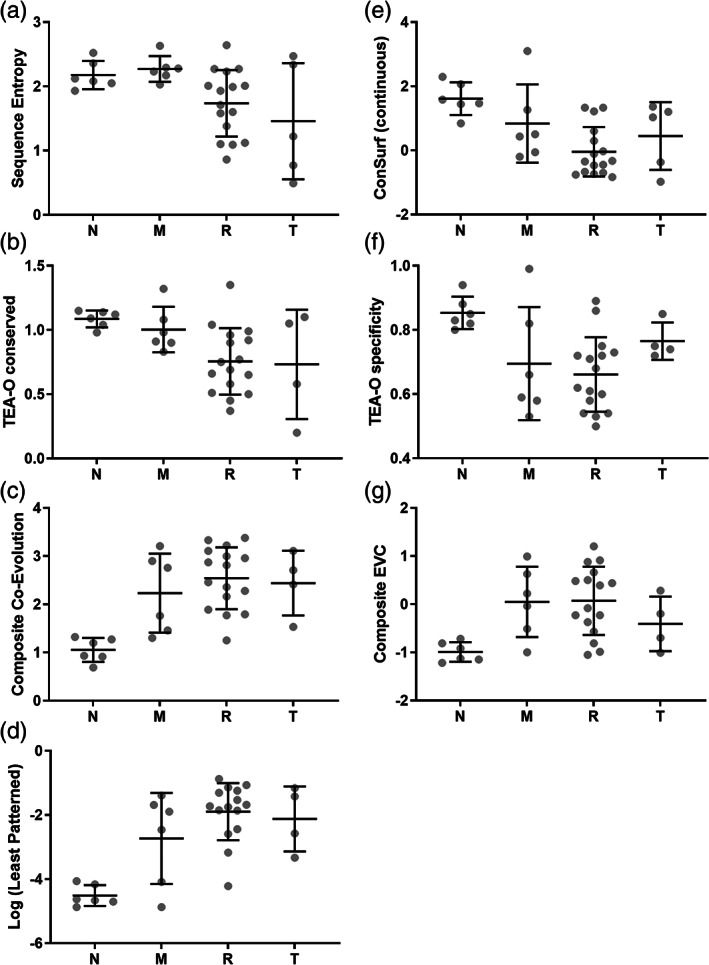
Various bioinformatic scores for four classes of hLPYK positions. The distributions of (a) sequence entropy, (b,e,f) phylogenetic, (c) co‐evolutionary, (d) least patterned, and (g) composite eigenvector centrality scores for hLPYK neutral (“N”), moderate (“M”), rheostat (“R”), and toggle (“T”) positions are shown. Black lines within each distribution represent the mean and standard deviation. For the TEA‐O specificity plot (f), the fact that many of these hLPYK positions were chosen via this parameter may bias the distribution. In (e), note that ConSurf calculations derive analog (continuous) scores for each position (shown here) and then discretize these scores into nine categories; we preferred the continuous score because it avoids the use of predetermined thresholds. p values from Kruskal–Wallis ANOVA, which tests the hypothesis that the four sets of scores are derived from the same distribution, are as follows: Sequence entropy, 0.631; ConSurf, 0.0048; TEA‐O conserved, 0.017; TEA‐O specificity, 0.0183; composite co‐evolution, 0.0032; composite EVC, 0.011; least patterned, 0.0015
First, although it reflects biochemical analyses of 428 protein variants, the comparison was poorly powered with only 33 positions. This was especially true for the toggle group, which comprised only five positions. Second, the means of selecting these 33 positions biased the distributions shown in Figure 6: For example, although TEA‐O specificity appeared to be among the best at discriminating rheostat positions, the dataset was skewed because 8/33 positions were chosen to have high TEA‐O specificity scores. Likewise, the performance of the “least patterned” score (previously used to identify functionally neutral positions8) was biased because 9/33 positions were chosen by this score. Third, if a large percent of all PYK positions are rheostat positions, correlations between scores and rheostat outcomes could arise from random chance. Fortunately, a large dataset is available for LacI that allowed a more comprehensive assessment of the relationship between rheostat positions and bioinformatic signatures.
2.3. Retrospective comparison of LacI rheostat, toggle, and neutral positions with bioinformatic scores
LacI is a member of the LacI/GalR transcription repressor family, which comprises orthologs and paralogs that regulate many aspects of bacterial metabolism. To regulate transcription, LacI binds to DNA operator sequences and small molecule allosteric sugars (reviewed in27). In vivo, LacI‐DNA binding inhibits RNA polymerase transcription of downstream genes (“repression”). When sugars bind at the LacI allosteric site, the affinity of LacI for DNA operator is modified. The well‐known effect of the allosteric inducers allolactose and isopropyl β‐D‐1‐thiogalactopyranoside (IPTG) is to weaken affinity for the DNA operator and thereby alleviate repression; this process is called “induction”.28, 29
In vivo repression and induction phenotypes were measured by the Miller lab for 12–13 substitutions at nearly every position in LacI.13, 14 As further discussed in the Supplemental Text, numerous studies with purified LacI variants (summarized in30) are available that relate these phenotypes to specific biochemical parameters (Figure S4). In the current study, the repression and induction phenotype data were separately analyzed with the RheoScale calculator to determine the overall substitution behavior for each position in LacI (Table S3). Example calculations are shown in Figure S5; individual position assignments are in the Supplemental List; the numbers of positions exhibiting rheostat, neutral, or toggle outcomes for the separate repression and induction phenotypes are in Table 1; and the fractions of LacI positions showing the “aggregate” neutral, rheostat, or toggle substitution behaviors are in Table 2.
TABLE 1.
Numbers of LacI positions assigned to each substitution category for repression and induction phenotypes
| Category | Repression | Induction |
|---|---|---|
| Neutral | 108 | 171 |
| Rheostat | 109 | 49 |
| Toggle | 30 | 12 |
| Unclassified | 81 | 60 |
| Positions assessed | 328a | 292b |
Induction cannot be measured for many of the variants in repression category 4 (“I‐”in the original Miller reports). If too few substitutions were available for a position, RheoScale does not calculate scores. For that reason, many repression toggle positions were excluded from analyses of induction phenotypes.
TABLE 2.
Numbers of LacI positions with each aggregate substitution behaviora
| Category | Counts | Fraction |
|---|---|---|
| Neutralb | 76 | 0.23 |
| Rheostat | 131 | 0.40 |
| Toggle | 42 | 0.11 |
| Unclassified | 83 | 0.25 |
| LacI monomerc | 329 |
The neutral, rheostat, and toggle designations for the repression and induction phenotypes of each position (summarized in Table 1 and detailed in Table S3) were combined to assign an aggregate neutral, rheostat, and toggle substitution behavior to each LacI position. More details of this classification are in Methods.
Neutral positions were neutral in both repression and induction phenotypes.
Not counting the C‐terminal tetramerization domain; position 1 was used to determine the fraction of each type of position even though it was not substituted in the Miller study.
Forty percent (40%) of the LacI positions rheostatically altered either repression and/or induction (Table 2), which exceeds the fractions of either toggle (11%) or neutral (23%) positions. A dominant substitution outcome could not be assigned to the remaining positions (“unclassified). Some unclassified positions likely exhibited substitution outcomes similar to the 6 “moderate” PYK positions. Other unclassified positions may be rheostat positions: For example, neither the low‐resolution repression nor induction assays measured enhanced function, which has been observed in high‐resolution data sets for LacI (e.g., 5, 31); as a consequence, some of the “wild‐type” substitutions may in fact have a significant functional effect.
We next compared the LacI substitution outcomes to a variety of bioinformatic scores, using a curated alignment previously generated for the LacI/GalR family. This alignment sampled 34 major subfamilies of orthologs and paralogs, with sequences identities that ranges from ~15% to 99%.9, 10, 32 All LacI/GalR homologs are from bacteria. The original rheostat positions identified in the LacI linker were nonconserved, with strong phylogenetic patterns and poor co‐evolution scores.5, 32 We here compared, contrasted, and combined the 17 different score types for the set of protein‐wide LacI rheostat, toggle, and neutral positions (Figure 7 and Figure S6). Our goals were to assess whether any patterns of evolutionary change showed a significant ability to identify rheostat positions and to determine whether separation thresholds could be identified for any of the three substitution categories (Table 3 and Tables S4 and S5).
FIGURE 7.
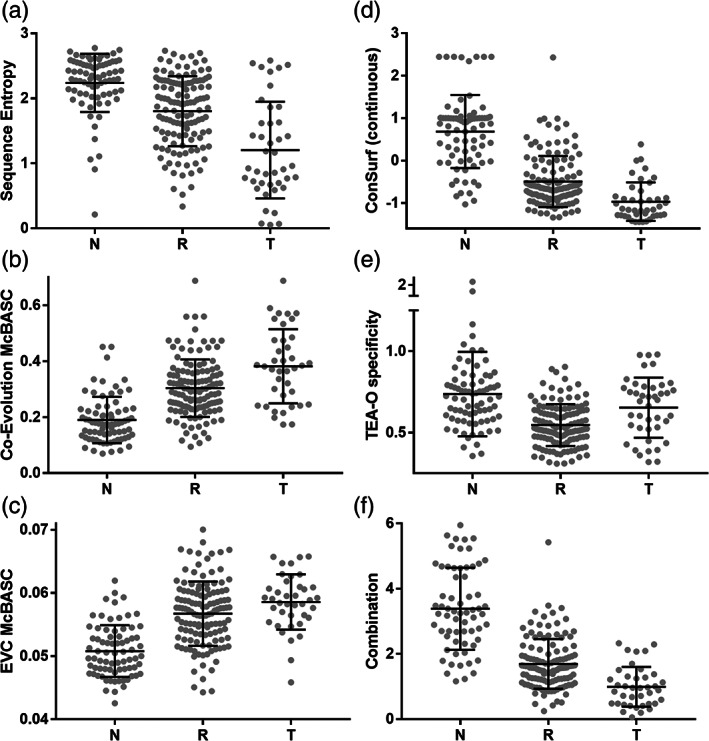
Various bioinformatic scores for three classes of LacI positions. The distributions of (a) sequence entropies and representative (b) co‐evolutionary (c) eigenvector centrality, (d,e) phylogenetic and (f) combined scores for LacI neutral (“N”), rheostat (“R”), and toggle (“T”) positions. Black lines show the mean and standard deviation for each distribution of scores. The distributions from additional co‐evolutionary and eigenvector centrality algorithms are in Figure S6; statistical measures of these three groups are in Tables S4 and S5. In (d), note that ConSurf calculations derive analog (continuous) scores for each position (shown here) and then discretize these scores into nine categories for its final presentation (not shown); the distributions of both continuous and discrete scores for the LacI positions were examined in statistical analyses (Table 3). The distribution of discrete scores better identified neutral positions, whereas the distributions of continuous scores better separated toggle and rheostat positions. (f) Combination scores were calculated for each LacI position from the analyses listed in Section 4 (Equation (2))
TABLE 3.
Statistical analyses of various algorithms' abilities to discriminate Neutral (N), Rheostat (R), and Toggle (T) positions
| Analysis | TC (N) | TC (R) | TC (T)a | FC T|N | FC R|N | FC R|Tb | FC N|T | FC T|R | FC N|R | Thresholds:C1, C2 |
|---|---|---|---|---|---|---|---|---|---|---|
| LacIc | ||||||||||
| ConSurf (continuous) | 0.8276 | 0.5566 | 0.6323 | 0.0299 | 0.1425 | 0.2794 | 0.0882 | 0.2082 | 0.2351 | −1.008, 0.1661 |
| ConSurf (discrete)d | 0.6964 | 0.5421 | 0.7985 | 0.0619 | 0.2417 | 0.1657 | 0.0357 | 0.2157 | 0.2421 | 4.6407, 7.8375 |
| Combination | 0.7981 | 0.5518 | 0.6351 | 0.1672 | 0.0348 | 0.3024 | 0.0625 | 0.2316 | 0.2166 | 1.1381, 2.1954 |
| fuNTRp | 0.6842 | 0.3307 | 0.7381 | 0.0789 | 0.2368 | 0.1667 | 0.0952 | 0.4016 | 0.2677 | N/A |
| hLPYK | ||||||||||
| fuNTRp | 0.667 | 0.375 | 0.400 | 0 | 0.3333 | 0.400 | 0.200 | 0.3125 | 0.3125 | N/A |
TC (i): Given that the truth was i, what was the probability that a position was correctly classified as i, with i corresponding to N, R, and T, as indicated. The threshold values used to carry out these calculations are in the last column.
FC (i|j): Given that the truth was j, what was the probability that a position was misclassified as i, with i and j corresponding to N, R, and T, as indicated. The threshold values used to carry out these calculations are in the last column.
Results for other bioinformatic analyses of LacI scores are in Tables S4 and S5.
The threshold values shown for discrete ConSurf scores were determined after applying kernel estimates. In practice, since the nature of these ConSurf scores is discrete, thresholds are rounded to 4.5 and 7.5.
For rheostat positions, the true class (“TC”) predictions showed that the phylogenetic methods out‐performed other types of analyses (Table S5). Indeed, by this measure, TEA‐O specificity had the best predictions for rheostat positions (TC 0.81). For example, of the top 15% of TEA‐O specificity scores (the selection criteria used for hLPYK position), 52% were LacI rheostat positions, which is greater than the 40% expected from random selection. (This performance would be better if any of the unclassified positions, which comprised 24% of the top TEA‐O specificity scores, were rheostat positions.) These results are consistent with our prior observations for rheostat positions in the LacI linker5 and with the experimentally verified positions in hLPYK (above). However, TEA‐O specificity also had high false class (“FC”) rates for neutral and toggle positions (Table S5). For example, of the top 15% of TEA‐O specificity scores, 16% were toggle positions and 8% were neutral positions. Thus, TEA‐O specificity scores are a useful filter when choosing potential rheostat positions for experimental testing, but the score does not facilitate robust prediction of individual rheostat positions.
Another assessment of the algorithms' abilities to separate the three categories uses the statistical criterion “volume under the ROC surface” (VUS, Table S4, see Section 4). Again, the phylogenetic analyses showed better overall separations for the three classes of rheostat, toggle, and neutral positions than did other types of analyses (Figure 7, Figure S6, Table S4). Of the phylogenetic analyses, ConSurf had the best overall performance by this measure (VUS 0.65).
Since sequence entropy is the baseline metric for “nonconservation”, it is interesting to look more closely at this analysis. Sequence entropy scores showed that most LacI rheostat positions were indeed nonconserved; however, they exhibited a broad range of scores (Figure 7). In agreement with textbook expectations, toggle positions generally exhibited lower sequence entropies (more conservation) and neutral positions generally exhibited higher sequence entropies (less conservation). However, as with hLPYK, no clear thresholds in the sequence entropy scores separated the different types of LacI positions (Tables S4 and S5). Indeed, a surprisingly large number of toggle positions exhibited high sequence entropy scores and a few neutral positions exhibited low scores (Figure 7).
Since we are frequently queried about the relationship between the popular co‐evolution analyses and rheostat positions, we also explicitly compared the maximum pairwise co‐evolution scores for several algorithms for the three classes of LacI positions. The algorithm with the best discrimination is shown in Figure 7; results from other analyses are in Figure S6. None of the co‐evolution scoring methods showed significant differences among the score distributions for rheostat or toggle positions. However, the distributions of co‐evolutionary scores for neutral positions were often lower than the other two groups. Likewise, several of the “eigenvector centrality” measures of multiple constraints (which identifies the most‐highly connected nodes of a co‐evolutionary network10), exhibited a lower distribution of scores for a subset of neutral positions.
We next tested whether multivariable combinations could provide better discrimination of the LacI rheostat, toggle, and neutral positions. First, to mirror the hLPYK selection criteria, we performed a two tier selection of LacI positions using the top 15% of the TEA‐O specificity positions and excluding the top 20% of co‐evolution positions. However, the percentages of rheostat, toggle, and neutral postions were almost unchanged (and thus the actual utility of the co‐evolution exclusion for hLPYK remains unknown). Next, we used a union set of different analyses to generate a “combination” score. In determining which analyses to include (see Section 4), we did not require the combination to sample all types of analyses; nevertheless, the best set comprised two co‐evolutionary scores, two eigenvector centrality scores, and all three phylogeny scores. The combination score showed reasonable separation for the three categories (Figure 7). However, given the additional information in the combination, we were surprised that it was no better at separating the three position classifications than ConSurf alone, which is a phylogenetic algorithm (Table 3 and Figure S7).
Finally, we explored whether this or other combination scores could better separate the LacI neutral positions from the combined rheostat and toggle (“non‐neutral”, non‐N) positions (Figure S8). This was motivated by the observation that several analyses appeared to separate the N from the R and T classes (Figure 7). Since many analyses also had uncorrelated scores (Figures S9 and S10), they could contain different information that could enhance discrimination of the neutral positions. Indeed, we previously generated a simple combination score that successfully identified neutral positions in hLPYK.8 The current LacI study provided opportunity to test an exhaustive set of linear and nonlinear combinations of analysis scores with statistical rigor. Surprisingly, no combination better separated the neutral/non‐neutral positions than did ConSurf alone (Figures S8 and S11). Since the lowest scoring ConSurf positions appear to reliably be neutral positions, this analysis appears to be a facile way to generate a control set of neutral positions for studies in other proteins.
2.4. PYK and LacI position predictions with fuNTRp
Given that evolutionary patterns could not predict the locations of rheostat positions with 100% accuracy, knowledge of protein structure and dynamics may be required for better predictions. As a first attempt at this, we turned to the “fuNTRp” algorithm, which combines structural and sequence alignment features and uses machine learning trained on data from deep mutational scanning studies.12 fuNTRp uses 10 input features: seven structural, one genetic, and two derived from sequence analyses, including the phylogenetic analysis ConSurf that performed well for LacI. In fact, ConSurf was a top contributor to the fuNTRp algorithm.12
We submitted the hLPYK and LacI sequences to the fuNTRp webserver and compared predictions to the experimentally determined rheostat, toggle and neutral behaviors (Table 3). For the 33 positions in hLPYK, only 33% of the experimentally strong rheostat positions were correctly predicted (essentially the same as random for a 3‐class classifier); and only 40% of the experimental toggle positions were predicted. Since these hLPYK toggle positions manifest primarily in allosteric parameters, their effects may be harder to predict than those that abolish the conserved catalytic function. However, 66% of neutral positions were correctly predicted (Table 3). Likewise, for LacI, fuNTRp was not better than sequence analyses alone at predicting rheostat or toggle positions, and it was comparable to ConSurf and the combined method for predicting neutral positions.
3. DISCUSSION
Because substitutions at rheostat positions provide a means to tune protein functional parameters, they may provide a means (and a selective advantage) for species to adapt to new environmental niches. Thus, we reasoned that substitutions at rheostat positions may evince an identifiable evolutionary signature. Indeed, the current results show that phylogenetic analyses of hLPYK and LacI performed reasonably well for discriminating between rheostat, toggle, and neutral substitution outcomes. As such, these methods can be used to identify sets of positions that are enriched for rheostat positions for further experimental consideration. However, the extensive overlap among their score distributions prevented them from being highly predictive for individual rheostat positions. Some positions with high phylogenetic scores were not strong rheostat positions, and some rheostat positions did not have high phylogenetic scores.
For hLPYK, the possibility remains that non‐rheostat positions with high phylogenetic scores have some untested role in function or protein stability. This is an inherent limitation of sequence data: any pattern associated with one particular functional change can be confounded by signals arising from the multiple pressures that influence protein evolution.33 However, the LacI in vivo phenotype data aggregate multiple structural and functional steps (Figure S4), so these analyses should reflect more of the constraints that contribute to evolution.
At least two factors might hamper the success of sequence alignments for predicting substitution outcomes. First, most extant homologs differ at multiple positions, and non‐additivity among some subsets of substitutions (“epistasis”) can confound detection of signals associated with single amino acid changes (e.g., 34, 35, 36, 37, 38, 39, 40, 41). Second, the rheostat/toggle/neutral character of a position could change during evolution (i.e., differ among homologs). This would decouple any correlations between sequence patterns and substitution outcomes. Indeed, we previously observed that evolutionarily‐constrained positions are in different locations on the otherwise common architecture of the LacI/GalR subfamilies.9 Similarly, when we compared rheostat/toggle/neutral substitution outcomes in 10 engineered LacI/GalR homologs, the outcomes for analogous positions sometimes varied. For example, position 60 acted as a repression rheostat in four homologs, a neutral position in another, and had varying moderate effects in all others.4, 5 Although some positions changed their substitution outcomes, it is possible that a subset of positions could exhibit rheostat behavior for the whole family. Since hLPYK is one of four human isozymes, it will be interesting to see whether the behaviors of established rheostat positions are conserved in the mammalian subfamily or among bacterial homologs.
If analyses of sequence alignments have inherent limitations, other input is likely needed to predict substitution outcomes. One computational predictor, fuNTRp, incorporates a variety of structural features along with a phylogeny score and other features for each position. Given that the phylogenetic signal (ConSurf) was a key contributor to analyzing the fuNTRp test sets,12 it is puzzling that fuNTRp was not more successful at identifying rheostat positions in hLPYK and LacI. One difference could arise from our use of curated sequence alignments, as opposed to the automated sequence alignments used in fuNTRp. Another difference could arise from the fuNTRp training set, which included several intrinsically‐disordered proteins. Indeed, seven of the ten parameters assessed in the machine learning were structural, and the predicted propensities for solvent accessibility, secondary structure, residue flexibility, and intrinsic disorder were significant features of fuNTRp predictions. All of these features differ significantly between intrinsically disordered proteins and globular‐soluble proteins, to which hLPYK and LacI belong. If globular‐soluble, intrinsically‐disordered, and integral‐membrane proteins have different proportions or structural features for their rheostat, neutral, and toggle positions, this might affect machine learning algorithms.
Finally, although not the motivating focus of this study, the LacI results provided another opportunity to assess the success of various methods in identifying positions that are neutral for overall function. In hLPYK, we previously showed that the “common” attributes of neutral positions (high sequence entropy, surface exposure, and insensitivity to alanine substitutions) were not sufficient to identify neutral positions with high confidence.8 However, a combination score derived from several types of sequence analyses did successfully identify both neutral and near‐neutral positions,8 which were used as a comparison set in this study. The current work with LacI shows that combinations can predict neutral positions but, surprisingly, none of the combinations outscored ConSurf alone (Figures S8 and S11). Likewise, of the three substitution classes, the neutral class was well predicted by fuNTRp for both proteins; perhaps the biggest contribution of ConSurf to fuNTRp was in the identification of neutral positions.
It is interesting to note that the most extreme combination/ConSurf scores almost entirely comprised neutral positions, even though other neutral positions did not have extreme scores. The practical outcome of this observation is that these analyses should provide a reliable way to identify neutral positions for control studies. An intriguing hypothesis that arises from this observation is that the extreme scores might identify neutral positions that are common to all members of the protein family, whereas the other neutral positions may be subfamily‐ or homolog‐specific (i.e., neutral in some homologs and rheostat or toggle in other homologs, as observed in4, 5).
3.1. Conclusion
Up to 10,000 differences can be identified in the exomes of any two unrelated individuals42, 43 and many mutations at nonconserved positions cause disease (e.g., 16, 44, 45). Thus, the value of understanding the “rules” that dictate functional outcomes of substitutions at nonconserved positions cannot be underestimated. For hLPYK, the use of phylogenetic patterning identified five out of eight positions with rheostatic behavior and a sixth position with low overall neutrality. Retrospective analyses of other hLPYK positions and the whole protein analysis of LacI supports the conclusion that the phylogenetic pattern of amino acid change can be useful for predicting potential rheostat positions. To improve the reliable identification of rheostat positions, the current work suggests that additional methods—beyond analyses of sequence alignments—are needed. One possibility will be to consider various aspects of protein structure and/or dynamics. One recent computational model found that rheostat positions in the LacI linker region showed a distinct pattern of dynamic coupling to the DNA binding domain.46 It will be very interesting to determine the generality of this approach for identifying the locations of and predicting the substitution outcomes at rheostat positions.
4. MATERIALS AND METHODS
4.1. Bioinformatic score calculations
A brief summary of the various types of analyses used with multiple sequence alignments is as follows:
Sequence entropy calculations are the simplest parameter that can be extracted from a multiple sequence alignment. These calculations estimate conservation using an information theoretic approach (Shannon entropy) to quantify the distribution of observed amino acids at each position.47 In addition to quantifying the overall amino acid variability observed at each position, this calculation discriminates between the following two scenarios, each with all 20 amino acids observed at a given position in an alignment with 100 sequences: (i) each amino acid could be equally represented (5 occurrences each, perfectly nonconserved) or (ii) one amino acid could occur 81 times, with the other amino acids represented once each (highly—although not perfectly—conserved). Sequence entropy scores differ for these two and other intermediate conditions.
Several methods incorporate phylogenetic trees in their analyses of multiple sequence alignments. “Consurf”48, 49 uses a phylogenetic tree to estimate the conservation of a position based on its evolutionary rate. “Evolutionary trace analysis” (ETA) also uses a phylogenetic tree to identify positions that diverge earlier in evolutionary history.50, 51 “Two entropies analysis—Objective” (TEA‐O) is a third phylogenetic tree‐based method that calculates sequence entropy at multiple phylogenetic levels to identify positions that are globally conserved (TEA‐O “conserved”) along with those that are nonconserved globally but conserved within subsets of the tree (TEA‐O “specificity”).17 Given the potential usefulness of the TEA‐O specificity score, we note here that this program is no longer compatible with the upgrades to computer operating systems that occurred during the course of this work; it should be re‐coded for future projects.
-
Co‐evolutionary analyses estimate the extent to which two positions vary together during evolution. For example, if a specific mutation at position A is always correlated with a specific mutation at position B, then positions A and B “co‐evolve”. Numerous mathematical frameworks have been developed to quantify co‐evolutionary behaviors. As previously reported (and as occurs in other protein families), the scores assigned to individual pairs of positions do not agree well among different co‐evolution algorithms,9, 52 even when additional procedures are used to subtract evolutionary “noise” from the calculations.9
Since no co‐evolutionary method has been shown to find more “important” positions than any other, we previously used five, mathematically‐divergent co‐evolution algorithms for LacI studies9, 10 and four methods for hLPYK studies,8 including: (i) Observed Minus Expected Squared (OMES53, 54), which is based on Chi‐squared‐like goodness of fit); (ii) Explicit Likelihood of Subset Covariation (ELSC55) and (iii) Statistical Coupling Analysis (LacI only; SCA56), which are based on a subset perturbation approach; (iv) McLachlan‐based Substitution Correlation (McBASC57, 58, 59), which is based on coordinated changes within physiochemical classes; and (v) Z‐Normalized Mutual Information (ZNMI52), which uses an information theoretic approach. Although several newer co‐evolutionary analyses have been developed, the focus of the field has been on improving amino acid contact prediction (reviewed in60). We decided not to use these versions: since many rheostat positions do not contact each other, we reasoned that these algorithms would impose unsuitable constraints.
Since co‐evolution scores are assigned to pairs of positions, each individual position has n‐1 co‐evolution scores, where n is the number of positions (columns) in the sequence alignment being analyzed. Since this is difficult to map on a structure or to compare to functional outcomes, we assigned each position its maximal co‐evolution score (maximal edge weight, “MEW”9). We also used MEW scores to generate a composite coevolution score from the set of co‐evolutionary methods for each family.8, 9, 10 For simplicity, the composite co‐evolution MEW was used for hLPYK position selection; for detailed statistical analyses of LacI, we separately evaluated all five MEW scores associated with the five different co‐evolutionary methods; no benefit was observed for the LacI composite MEW score.
Another type of sequence analysis is derived from co‐evolutionary methods: “Eigenvector centrality” (EVC) uses a network‐based approach to identify “central” positions that have the greatest degree of connectivity within a weighted co‐evolutionary network.10 These positions can be thought of as being the most constrained overall—by evolutionary “interactions” (not necessarily structural) with several other positions—as opposed to having the highest single constraint from a partner position. Since eigenvector centrality scores were derived from co‐evolutionary scores (above), we again generated multiple sets of EVC scores for each family, along with a composite score generated from all EVC analyses.10
We previously used scores from (i) co‐evolutionary and TEAO algorithms and (ii) prediction information from the SNAP machine learning program to that predicts neutral substitutions61, 62 to identify positions with the least evidence of any pattern of evolutionary change (“least patterned”).8 For the nine least patterned positions in hLPYK, three were perfectly neutral in all five parameters and five showed only moderate functional change. Thus, using this limited dataset, the least pattern score appeared to identify a dataset that was enriched for neutral and near‐neutral positions. As described below, these calculations were repeated with more types of sequence analysis scores and statistical rigor for the LacI dataset.
4.2. Evolutionary patterns and selection of positions to be tested in hLPYK
For hLPYK, sequence evaluations, protein expression/purification, and enzymatic assays are the same as previously reported8 and are briefly outlined here. A previously curated sequence alignment of 241 different PYK sequences16 was analyzed with the phylogenetic algorithms TEA‐O17 and ConSurf,11, 48, 49 co‐evolutionary algorithms, and eigenvector centrality algorithms. For the latter two approaches, we used four different algorithms to detect co‐evolving positions and to calculate eigenvector centrality and then combined those scores into composite scores for each approach via determining the Z‐normalized mean. Bioinformatic scores for experimentally assessed positions are presented in Table S2; correlations among different algorithms, derived using all positions in the PYK sequence alignment, are shown in Figure S2.
Next, nonconserved hLPYK positions were ranked based on how well each position tracked with phylogeny and showed co‐evolution with another position. For phylogeny, we used the TEA‐O algorithm because it reports two separate scores: a score that ranks a position's overall conservation, and a score that ranks a position's conservation within alternative phylogenetic lineages (i.e., subfamilies). This latter score was particularly useful because the branching positions (i.e., potential rheostat positions) were at the top of the list. In contrast, branching positions could fall into the middle of the list for ConSurf or Evolutionary Trace Analysis scores, and a selection threshold for these rankings was unknown. Finally, since it is possible for an individual position to have high scores in both phylogenetic and co‐evolutionary analyses, we selected twenty hLPYK positions that were within the top 15% of positions that trace phylogeny and outside of the top 20% of co‐evolving positions. Based on these criteria, positions 107, 156, 177,192, 259, 320, 321, 347, 348, 379, 422, 423, 431, 452, 467, 472, 476, 498, 538, and 540 were hypothesized to be rheostats based on these criteria. Of these, eight positions (107, 156, 177, 192, 259, 320, 423, and 538) were randomly selected for experimental analysis.
4.3. Experimental analyses of hLPYK phylogenetic positions
Within the pLC11 plasmid (a gift from Dr. Andrea Mattevi63), codons of positions that were selected for testing in hLPYK were subjected to mutagenesis using the QuikChange protocol (Agilent, Santa Clara, CA) and primers (Integrated DNA Technologies, Coralville, IA) that were degenerate in all three positions of the codon. Mutant plasmids were transformed and expressed into FF50 E. coli which lack the two E. coli pyk genes.64 Mutated plasmids were subsequently purified from isolated bacterial colonies and changes in the hLPYK coding regions were identified by DNA sequencing. For protein expression, 100 μg/mL ampicillin was included for plasmid selection. Cell pellets were harvested via centrifugation and stored at −20°C until use. Once cell pellets were sonicated, the hLPYK protein was partially purified by using ammonium sulfate fractionation and subsequent dialysis. After dialysis, proteins were spun in a microcentrifuge at 18,000 RPM for 2 hours in a cold room prior to data collection to remove a protein precipitant.
Enzymatic activity was determined with a lactate dehydrogenase/NADH coupled assay to monitor a change in absorbance at 340 nm (e.g., 65, 66). Assays were performed in a 96‐well plate, with each row being a titration of activity with various concentrations of phosphoenolpyruvate (PEP) at one concentration of effector. For each variant or wild‐type, two plates were assayed, one for each allosteric effector. For the majority of variants that exhibited activity, K app‐PEP values were determined as the concentration of PEP that results in one half of V max, and the K app‐PEP value was determined at each concentration of allosteric effector. The responses of K app‐PEP to both varying concentrations of allosteric activator fructose‐1,6‐bisphoshate (abbreviated as “Fru‐1,6‐BP” in the text and as “FBP” when used in parameter nomenclature) and allosteric inhibitor alanine were fit to:
| (1) |
where K a‐PEP is the protein's affinity for PEP in the absence of effector X and K ix is effector binding in the absence of PEP. Q ax is the allosteric coupling constant that is equal to the ratio of PEP affinity in the absence of effector over the PEP affinity in the presence of saturating effector. These parameters are further described in Figure S1.
For each variant, the fit parameters are reported in Table S1 along with errors of the fit. A general problem in generating large datasets is that it is not tractable to reproduce each measurement. (A total of 108 variants were generated for this study and were characterized with >20,000 enzymatic assays.) Thus, as controls for reproducibility, a wild‐type hLPYK was included in the assay experiments for the set of substitutions made at each position. The average error obtained from all wild‐type samples, which were gathered over many different days and by separate lab members, is shown in the top panel of Figure 2 and serves as a proxy for the whole dataset. Finally, we note that each position's assignment is determined by the results of 10–15 substitutions; thus, the conclusion should be robust to errors in individual substitutions.
Positions 107 and 320 were unusual among the positions tested in that each had multiple variants that lacked activity. Since this could artefactually arise from problems during protein purification, these assays were repeated at least three times for each “dead” variant to confirm these results. These variants are indicated in Table S1 and are incorporated into rheostat analyses of K app‐PEP. Note that “no activity” can be a result of abolished PEP binding, abolished catalysis, and/or unfolded/unstable protein. The current experiments cannot differentiate among these three options.
4.4. Classifying mutational outcomes at hLPYK positions
Instead of thinking about the role of individual amino acid side chains (i.e., “residues”), we here consider the overall role of each position within a protein. Such an assessment requires characterizing multiple amino acid variants at each position. Although it would be ideal to have all 20 amino acids at each position, our prior experiences suggest that the overall substitution role of a position can be generally assessed from 10–12 substitutions per position.4 Thus, after the five functional parameters (K a‐PEP, K ix‐Ala, K ix‐FBP, Q ax‐Ala, Q ax‐FBP) were determined for each hLPYK substitution, the aggregate data for each position were evaluated with the RheoScale calculator.4 This calculator uses histogram analyses to assess the toggle‐like, rheostatic, and neutral character of each position. “Neutral” scores reflect the fraction of substitutions that are equivalent to wild‐type function. “Rheostat” scores reflect the fraction of the total, accessible functional range that was accessed by at least one substitution. “Toggle” scores reflect the fraction of substitutions that are greatly damaging to function.
Detailed information on how these scores are formulated for four hLPYK parameters—K ix‐Ala, K ix‐FBP, Q ax‐Ala, Q ax‐FBP—including the bin number and the functional ranges, were previously determined using a variety of datasets.4, 6, 8, 66 Specific details of the histograms are shown in Figure S3. As noted above, a replicate of wild‐type was performed the same day that each position's data were collected, and wild‐type data from all days were averaged for each parameter. These values established the baseline against which variants' data were compared in RheoScale analyses. For the fifth parameter, K a‐PEP, we had not yet performed in‐depth analyses of RheoScale parameters, since previous studies focused on allosteric regulation6 and neutrality.8 Therefore, further analysis of K a‐PEP was warranted and is described in the next section.
4.5. RheoScale analyses of the hLPYK parameter Ka‐PEP
All histogram analyses require empirical assessments of the parameters chosen. For RheoScale analyses, good estimations of the “best” and “dead” activities are critical. For the allosteric parameters, we previously set dead values to 10‐fold greater than the maximal ligand concentration used.4, 6 For K a‐PEP, the highest concentration of PEP was 10 mM and thus “dead” was previously assigned as 100 mM. However, when inspecting histogram analyses of the K a‐PEP parameter, we noticed that the range had multiple unfilled bins between 10 mM and 100 mM. Since K a‐PEP is fit by a different mechanism than K ix‐Ala, K ix‐FBP, Q ax‐Ala, Q ax‐FBP, we realized that the 10‐fold criterion for K a‐PEP resulted in a range that was too wide and thus artificially deflated rheostat scores. Therefore, the range from 10 mM to 100 mM was grouped into one bin, thereby grouping variants with small responses to 10 mM PEP (and which could not be measured with a high degree of certainty) into a single bin that was distinct from the “dead” bin, which was set to 100 mM. (Note that RhoeScale analyses are carried out with log scale for variant parameter sets that span many orders of magnitude, like those observed for K a‐PEP.) This approach was validated using the set of 427 substitutions generated in a whole protein alanine scan of hLPYK,66 which we reasoned should sample the full, accessible range of K a‐PEP values; based on the resulting histogram for these data (Figure S12) we concluded that this was the most appropriate range for RheoScale analyses of the K a‐PEP parameter.
4.6. Composite neutral score for hLPYK functional parameters
Both the toggle and rheostat natures of a position are associated with a given protein function (e.g., position X shows high rheostat nature in the substrate binding parameter), and rheostatic changes in a single parameter are sufficient to classify a rheostat or toggle position. In contrast, for a position to be neutral, it must be neutral in all functions that can be evaluated. Therefore, our ongoing efforts to assign functions to positions would be improved by having a composite neutral score that encompasses all functions monitored. To that end, for each position, we first counted the number of times any of the five possible parameters was neutral, across all variants. We then normalized that to the total number of measured parameters (e.g., 5 times the number of variants) to determine a composite neutral score for each position. On this scale, a value of zero indicates that all parameters for all variants were significantly different than their corresponding wild‐type parameters; a value of one indicates that all parameters for all variants were equivalent to wild‐type.
4.7. Assigning LacI rheostat, toggle, and neutral substitution behaviors
To quantify the aggregate substitution behaviors of individual LacI positions, we adapted the RheoScale calculator4 for use with the qualitative phenotypic data reported in the Miller13, 14 study. For each LacI variant, repression phenotypes were assigned to one of four qualitative categories. One category encompassed the tight repressors (including wild‐type LacI); two categories of intermediate repression were designated; a fourth category was used for weak or dead repressors. Inducibility phenotypes were likewise assigned to one of four categories, with wild‐type again falling in the strongest inducibility category. Thus, following a prior example,46 we assigned these four categories numerical values (1, 2, 3, and 4) and used RheoScale to calculate rheostat, toggle, and neutral scores for each position for each of the two phenotypes. Examples of transformed data and histograms are shown in Figure S5. Rheostat scores were calculated using the method that gives more weight to bins with intermediate values.4 Calculated rheostat, toggle, and neutral scores for each position's repression and induction are reported in Table S3.
Next, we considered significance thresholds for these three scores. Since the use of low‐resolution experimental data limited histogram analyses to four bins, the thresholds previously established for high‐resolution data were inappropriate. Furthermore, and again because of the low‐resolution experimental data, we had the most confidence in classifying each position with its dominant substitution outcome rather than trying to assess any intermediate behaviors along the neutral‐rheostat‐toggle spectrum. Classification results are summarized in Tables 1 and 2 and listed in the Supplemental List. Assignments were made using the following criteria:
First, we identified positions for which all substitutions were in the wild‐type‐like “strong repression” or “strong induction” categories. This identified which positions were neutral for each of the two phenotypes (Table 1). Note that this is likely an overestimation of truly neutral positions, since the “strong” phenotype categories spanned a wide range of experimental outcomes.13, 14 For example, the strong repression bin spans a range that is at least 50‐fold, if not larger. Nevertheless, positions for which all substitutions fall in the “strong” bin should not be classified as “rheostat” positions: Their variants could not sample half of the available functional range, which is the minimum criterion previously used to designate rheostat positions.4, 6
Second, we identified positions for which more than 75% of the non‐wild‐type substitutions were in the weak/nonfunctional classification and no more than two substitutions were in the strong category (Table 1). This threshold was slightly more stringent than one used in ref.2 because it is in better agreement with results from the high‐resolution in vivo repression study.5, 46 Positions that satisfied this criterion were designated as “toggle” for either repression or induction phenotypes.
For the remaining positions, we designated those with rheostat scores greater than 0.6 as having rheostat substitution outcomes (Table 1). This rheostat score threshold is higher than in previous studies (including hLPYK), which used a threshold of 0.54: For high resolution data, two of the ways a rheostat score of 0.5 could be achieved was by (i) half of the substitutions causing intermediate functional outcomes spanning the entire possible range, or (ii) the range of outcomes spanning at least half the possible functional range. However, for the low‐resolution phenotype data used herein, a rheostat score of 0.5 might not span half the available range. Thus, we decided to use a more stringent threshold of 0.6. Even with this stringent threshold, 40% of LacI positions were classified as rheostat positions for at least one of the two phenotypes (Table 2, Supplemental List).
Finally, we compared the substitution outcomes for the two phenotypes to assign a composite substitution behavior to each position (Table 2, Supplemental List): Neutral positions must be neutral for both phenotypes.8 Thirty‐eight positions exhibited toggle outcomes for one phenotype; if the toggle phenotype was assigned to induction, then repression was neutral (or unclassified); if the toggle phenotype occurred for repression, then effects on induction could not be measured and are thus unknown. Four positions acted as rheostats for repression and as toggles for induction; we reasoned that the toggle outcome would dominate any signal in a sequence alignment and these positions were treated in the current work as toggle positions (analogous to hLPYK positions that were toggle in one of their five functional parameters). LacI positions with toggle repression/rheostat induction likely exist but could not be detected in these experiments. Eighty‐three positions could not be assigned to a substitution category for either phenotype and thus are not further considered in this work. All other positions were assigned to the rheostat category.
4.8. Statistical comparisons of LacI bioinformatic scores with experimental outcomes
The sequence alignment for the LacI/GalR family was previously reported and used to generate various evolutionary bioinformatics scores for each amino acid position in the alignment.9, 10, 32 This alignment contained 351 representative sequences of LacI/GalR paralogs from 34 subfamilies; sequence identities ranged from 99% to ~15%. For this work, we used the “whole family” sequence alignment. Since we previously found that “nested” analyses with subsets of sequences can provide additional information about evolutionary changes,9 we also explored an alternative LacI/GalR sequence alignment comprising sequences containing the “YPAL” linker motif that is related to the type of DNA bound32; however preliminary analyses did not exhibit noticeable differences from whole family analyses. Analyses could not be performed on the subfamily of LacI orthologs (sequence identities from 99% to ~40%) because it contains too few sequences.10 Results from the various types of sequence analyses described above were previously used to generate 17 different sets of scores for each of the amino acid positions in LacI.9, 10, 32 To demonstrate that different types of analyses highlight different positions, all possible pairs of score sets were plotted against each other (e.g., Figure S9) and Pearson correlation coefficients were determined (Figure S10). As previously noted, the eigenvector centrality analyses showed the best within‐class agreement.10
Next, we divided each of the 17 bioinformatic score sets into subsets corresponding to the scores of rheostat, toggle, and neutral positions. The distributions of the scores for the three subsets were then compared to determine how well they discriminated the experimental rheostat, toggle, and neutral substitution outcomes using three‐dimensional ROC analyses (i.e., ROC surfaces). Three‐dimensional analyses of ROC surfaces are analogous to two‐dimensional analyses of ROC curves. In the three‐dimensional analyses, the volume under the ROC surface (VUS) can yield values within the interval [1/6, 1]. The value of 1/6 corresponds to an uninformative predictor, whereas the value of 1 corresponds to a perfect predictor.67 VUS were determined for all 17 score sets. Confidence intervals for the VUS were derived through the percentile bootstrap resampling method using 1,000 bootstrap samples.
Next, we explored whether a combination of bioinformatic score sets could be identified that had better separation of the classes than any single score set. Since exploring all possible combinations of 17 scores was intractable for separating three classes, we narrowed down the number of score sets by the following steps: We selected representatives from the different scores using a forward, backward, and a likelihood ratio based approach to identify a union set of seven bioinformatic score sets. This analysis was performed with SPSS software platform. The union set was then used to create a “combination” score for each LacI position. To generate this score from the component bioinformatic scores, we determined which coefficients of a linear combination maximized the VUS of the ROC surface. The final equation obtained was.
| (2) |
The confidence interval of the VUS corresponding to the combination score was derived through the percentile bootstrap with 1,000 bootstrap samples. Note that this combinatorial analysis was derived solely to determine the potential value of combining different types of bioinformatic analyses for predicting the locations of rheostat, toggle, and neutral positions. This combinatorial score was not subjected to external validation, nor do we expect this empirical equation to extrapolate to scores sets for other protein families.
For all analyses, we determined the generalized Youden index,68, 69 all three class rates at the Youden based optimal threshold pair of points, and all six false classification rates. For the optimization of the Youden index, we considered kernel‐based estimates of the densities of each group that are based on Gaussian kernels. The analysis was performed using MATLAB 2019b. In addition, for ConSurf and the combinatorial score, we determined pairwise ROC curves that refer to all possible pairs of neutral, rheostat, and toggle comparisons (Figure S7).
Finally, we further considered the ability of Equation (2) combination to discriminate the LacI N and non‐N (combined R and T) classes (Figure S8). Since this seven‐component combination was again equivalent to ConSurf, we further considered a comprehensive set of linear and nonlinear combinations of the analyses. Further details and an ROC curve for an example calculation are in Figure S11. Surprisingly, even though the different analyses contained different information (i.e., did not have strongly correlated scores; Figures S9 and S10), no combination outperformed ConSurf for separating N versus Non‐N, although several combinations were comparable.
4.9. fuNTRp predictions for hLPYK and LacI
fuNTRp is a machine learning algorithm that uses structural and bioinformatic information to predict the rheostat, toggle, and neutral substitution outcomes for each position in a protein.12 The seven structural features used by the algorithm include (i) the observed amino acid side chain chemistry, size, and charge and (ii) predictions about each position's solvent accessibility, secondary structure, residue flexibility, and disorder. One included genetic feature was based on the “number of possible nsSNPs (all codons)”.12 The two features derived from sequence analyses included an automatic implementation of ConSurf (which does not use a curated multiple sequence alignment) and the “MSA ratio” (which was defined as the “fractions of residue amino acid per MSA column”12). Thus, information from pairwise co‐evolution and eigenvector centrality scores were not included in fuNTRp analyses. As reported by Miller et al.,12 each of the ten chosen features contributed different amounts to the final algorithm output. The hLPYK and LacI sequences were submitted to the fuNTRp website (https://services.bromberglab.org/funtrp/) to generate predictions about the locations of rheostat, toggle, and neutral positions.
4.10. Additional methods
The expanded methods described in the Supplementary material includecitations.70, 71, 72, 73, 74, 75, 76, 77, 78, 79, 80, 81, 82, 83, 84, 85, 86, 87
AUTHOR CONTRIBUTIONS
Liskin Swint‐Kruse: Conceptualization; data curation; formal analysis; funding acquisition; investigation; methodology; project administration; resources; supervision; validation; visualization; writing‐original draft; writing‐review & editing. Tyler A. Martin: Investigation; methodology; validation; visualization; writing‐original draft; writing‐review & editing. Braelyn M. Page: Data curation; investigation; methodology; validation; writing‐original draft; writing‐review & editing. Tiffany Wu: Data curation; investigation; methodology; validation; writing‐review & editing. Paige M. Gerhart: Investigation; methodology; validation; visualization. Larissa L. Doughtery: Investigation; methodology; writing‐review & editing. Qingling Tang: Investigation; methodology. Daniel J. Parente: Conceptualization; software; writing‐original draft; writing‐review & editing. Brian R. Mosier: Formal analysis. Leonidas E. Bantis: Formal analysis; validation; visualization; writing‐original draft; writing‐review & editing. Aron W. Fenton: Conceptualization; data curation; formal analysis; funding acquisition; investigation; methodology; project administration; resources; supervision; validation; visualization; writing‐original draft; writing‐review & editing.
Supporting information
Appendix S1: Supporting Information
ACKNOWLEDGMENTS
This work was supported by the National Institute of General Medicine at the National Institutes of Health (grant numbers GM115340 to AWF, GM118589 to LSK and AWF, and P20GM130423 to LB and LSK as part of the Kansas Institute for Precision Medicine) and by the W. M. Keck Foundation (LSK and AWF).
Swint‐Kruse L, Martin TA, Page BM, et al. Rheostat functional outcomes occur when substitutions are introduced at nonconserved positions that diverge with speciation. Protein Science. 2021;30:1833–1853. 10.1002/pro.4136
Funding information National Institutes of Health, Grant/Award Numbers: GM115340, GM118589, P20GM13042; W. M. Keck Foundation
Contributor Information
Liskin Swint‐Kruse, Email: lswint-kruse@kumc.edu.
Aron W. Fenton, Email: afenton@kumc.edu.
REFERENCES
- 1.Gray VE, Kukurba KR, Kumar S. Performance of computational tools in evaluating the functional impact of laboratory‐induced amino acid mutations. Bioinformatics. 2012;28:2093–2096. [DOI] [PMC free article] [PubMed] [Google Scholar]
- 2.Miller M, Bromberg Y, Swint‐Kruse L. Computational predictors fail to identify amino acid substitution effects at rheostat positions. Sci Rep. 2017;7:41329. [DOI] [PMC free article] [PubMed] [Google Scholar]
- 3.Fenton AW, Page BM, Spellman‐Kruse A, Hagenbuch B, Swint‐Kruse L. Rheostat positions: A new classification of protein positions relevant to pharmacogenomics. Med Chem Res. 2020;29:1133–1146. [DOI] [PMC free article] [PubMed] [Google Scholar]
- 4.Hodges AM, Fenton AW, Dougherty LL, Overholt AC, Swint‐Kruse L. RheoScale: A tool to aggregate and quantify experimentally determined substitution outcomes for multiple variants at individual protein positions. Hum Mutat. 2018;39:1814–1826. [DOI] [PMC free article] [PubMed] [Google Scholar]
- 5.Meinhardt S, Manley MW Jr, Parente DJ, Swint‐Kruse L. Rheostats and toggle switches for modulating protein function. PLoS One. 2013;8:e83502. [DOI] [PMC free article] [PubMed] [Google Scholar]
- 6.Wu T, Swint‐Kruse L, Fenton AW. Functional tunability from a distance: Rheostat positions influence allosteric coupling between two distant binding sites. Sci Rep. 2019;9:16957. [DOI] [PMC free article] [PubMed] [Google Scholar]
- 7.Ruggiero M, Malhotra S, Fenton A, Swint‐Kruse L, Karanicolas J, Hagenbuch B. A clinically‐relevant polymorphism in the Na+/taurocholate cotransporting polypeptide (NTCP) occurs at a rheostat position. J Biol Chem. 2020;296:100047. 10.1074/jbc.RA120.014889. [DOI] [PMC free article] [PubMed] [Google Scholar]
- 8.Martin TA, Wu T, Tang Q, et al. Identification of biochemically neutral positions in liver pyruvate kinase. Proteins. 2020;88:1340–1350. [DOI] [PMC free article] [PubMed] [Google Scholar]
- 9.Parente DJ, Swint‐Kruse L. Multiple co‐evolutionary networks are supported by the common tertiary scaffold of the LacI/GalR proteins. PLoS One. 2013;8:e84398. [DOI] [PMC free article] [PubMed] [Google Scholar]
- 10.Parente DJ, Ray JC, Swint‐Kruse L. Amino acid positions subject to multiple coevolutionary constraints can be robustly identified by their eigenvector network centrality scores. Proteins. 2015;83:2293–2306. [DOI] [PMC free article] [PubMed] [Google Scholar]
- 11.Ashkenazy H, Abadi S, Martz E, et al. ConSurf 2016: An improved methodology to estimate and visualize evolutionary conservation in macromolecules. Nucleic Acids Res. 2016;44:W344–W350. [DOI] [PMC free article] [PubMed] [Google Scholar]
- 12.Miller M, Vitale D, Kahn PC, Rost B, Bromberg Y. funtrp: Identifying protein positions for variation driven functional tuning. Nucleic Acids Res. 2019;47:e142. [DOI] [PMC free article] [PubMed] [Google Scholar]
- 13.Suckow J, Markiewicz P, Kleina LG, Miller J, Kisters‐Woike B, Müller‐Hill B. Genetic studies of the Lac repressor. XV: 4000 single amino acid substitutions and analysis of the resulting phenotypes on the basis of the protein structure. J Mol Biol. 1996;261:509–523. [DOI] [PubMed] [Google Scholar]
- 14.Markiewicz P, Kleina LG, Cruz C, Ehret S, Miller JH. Genetic studies of the lac repressor. XIV. Analysis of 4000 altered Escherichia coli lac repressors reveals essential and non‐essential residues, as well as "spacers" which do not require a specific sequence. J Mol Biol. 1994;240:421–433. [DOI] [PubMed] [Google Scholar]
- 15.Blair JB. Regulatory properties of hepatic pyruvate kinase. In: Veneziale CM, editor. The regulation of carbohydrate formation and utilization in mammals. Baltimore: University Park Press, 1980; p. 121–151. [Google Scholar]
- 16.Pendergrass DC, Williams R, Blair JB, Fenton AW. Mining for allosteric information: Natural mutations and positional sequence conservation in pyruvate kinase. IUBMB Life. 2006;58:31–38. [DOI] [PubMed] [Google Scholar]
- 17.Ye K, Vriend G, IJzerman AP. Tracing evolutionary pressure. Bioinformatics. 2008;24:908–915. [DOI] [PubMed] [Google Scholar]
- 18.Ikeda Y, Tanaka T, Noguchi T. Conversion of non‐allosteric pyruvate kinase isozyme into an allosteric enzyme by a single amino acid substitution. J Biol Chem. 1997;272:20495–20501. [DOI] [PubMed] [Google Scholar]
- 19.Ikeda Y, Noguchi T. Allosteric regulation of pyruvate kinase M2 isozyme involves a cysteine residue in the intersubunit contact. J Biol Chem. 1998;273:12227–12233. [DOI] [PubMed] [Google Scholar]
- 20.Ikeda Y, Taniguchi N, Noguchi T. Dominant negative role of the glutamic acid residue conserved in the pyruvate kinase M(1) isozyme in the heterotropic allosteric effect involving fructose‐1,6‐bisphosphate. J Biol Chem. 2000;275:9150–9156. [DOI] [PubMed] [Google Scholar]
- 21.Wooll JO, Friesen RH, White MA, et al. Structural and functional linkages between subunit interfaces in mammalian pyruvate kinase. J Mol Biol. 2001;312:525–540. [DOI] [PubMed] [Google Scholar]
- 22.Friesen RH, Lee JC. The negative dominant effects of T340M mutation on mammalian pyruvate kinase. J Biol Chem. 1998;273:14772–14779. [DOI] [PubMed] [Google Scholar]
- 23.Friesen RH, Chin AJ, Ledman DW, Lee JC. Interfacial communications in recombinant rabbit kidney pyruvate kinase. Biochemistry. 1998;37:2949–2960. [DOI] [PubMed] [Google Scholar]
- 24.Friesen RH, Castellani RJ, Lee JC, Braun W. Allostery in rabbit pyruvate kinase: Development of a strategy to elucidate the mechanism. Biochemistry. 1998;37:15266–15276. [DOI] [PubMed] [Google Scholar]
- 25.Cheng X, Friesen RH, Lee JC. Effects of conserved residues on the regulation of rabbit muscle pyruvate kinase. J Biol Chem. 1996;271:6313–6321. [DOI] [PubMed] [Google Scholar]
- 26.Fenton AW, Blair JB. Kinetic and allosteric consequences of mutations in the subunit and domain interfaces and the allosteric site of yeast pyruvate kinase. Arch Biochem Biophys. 2002;397:28–39. [DOI] [PubMed] [Google Scholar]
- 27.Wilson CJ, Zhan H, Swint‐Kruse L, Matthews KS. The lactose repressor system: Paradigms for regulation, allosteric behavior and protein folding. Cell Mol Life Sci. 2007;64:3–16. [DOI] [PMC free article] [PubMed] [Google Scholar]
- 28.Barkley MD, Riggs AD, Jobe A, Burgeois S. Interaction of effecting ligands with lac repressor and repressor‐operator complex. Biochemistry. 1975;14:1700–1712. [DOI] [PubMed] [Google Scholar]
- 29.Riggs AD, Newby RF, Bourgeois S. Lac repressor‐operator interaction. II. Effect of galactosides and other ligands. J Mol Biol. 1970;51:303–314. [DOI] [PubMed] [Google Scholar]
- 30.Sousa FL, Parente DJ, Shis DL, et al. AlloRep: A repository of sequence, structural and mutagenesis data for the LacI/GalR transcription regulators. J Mol Biol. 2016;428:671–678. [DOI] [PMC free article] [PubMed] [Google Scholar]
- 31.Zhan H, Swint‐Kruse L, Matthews KS. Extrinsic interactions dominate helical propensity in coupled binding and folding of the lactose repressor protein hinge helix. Biochemistry. 2006;45:5896–5906. [DOI] [PMC free article] [PubMed] [Google Scholar]
- 32.Tungtur S, Parente DJ, Swint‐Kruse L. Functionally important positions can comprise the majority of a protein's architecture. Proteins. 2011;79:1589–1608. [DOI] [PMC free article] [PubMed] [Google Scholar]
- 33.Chi PB, Liberles DA. Selection on protein structure, interaction, and sequence. Protein Sci. 2016;25:1168–1178. [DOI] [PMC free article] [PubMed] [Google Scholar]
- 34.Sailer ZR, Harms MJ. High‐order epistasis shapes evolutionary trajectories. PLoS Comput Biol. 2017;13:e1005541. [DOI] [PMC free article] [PubMed] [Google Scholar]
- 35.Faber MS, Wrenbeck EE, Azouz LR, Steiner PJ, Whitehead TA. Impact of in vivo protein folding probability on local fitness landscapes. Mol Biol Evol. 2019;36:2764–2777. [DOI] [PubMed] [Google Scholar]
- 36.Liberles DA, Teufel AI. Evolution and structure of proteins and proteomes. Genes. 2018;9:583. [DOI] [PMC free article] [PubMed] [Google Scholar]
- 37.Starr TN, Thornton JW. Epistasis in protein evolution. Protein Sci. 2016;25:1204–1218. [DOI] [PMC free article] [PubMed] [Google Scholar]
- 38.Ben‐David M, Soskine M, Dubovetskyi A, et al. Enzyme evolution: An epistatic ratchet versus a smooth reversible transition. Mol Biol Evol. 2020;37:1133–1147. [DOI] [PubMed] [Google Scholar]
- 39.de Vos MG, Dawid A, Sunderlikova V, Tans SJ. Breaking evolutionary constraint with a tradeoff ratchet. Proc Natl Acad Sci U S A. 2015;112:14906–14911. [DOI] [PMC free article] [PubMed] [Google Scholar]
- 40.de Vos MGJ, Poelwijk FJ, Battich N, Ndika JDT, Tans SJ. Environmental dependence of genetic constraint. PLoS Genet. 2013;9:e1003580. [DOI] [PMC free article] [PubMed] [Google Scholar]
- 41.Tufts DM, Natarajan C, Revsbech IG, et al. Epistasis constrains mutational pathways of hemoglobin adaptation in high‐altitude pikas. Mol Biol Evol. 2015;32:287–298. [DOI] [PMC free article] [PubMed] [Google Scholar]
- 42.Ng PC, Levy S, Huang J, et al. Genetic variation in an individual human exome. PLoS Genet. 2008;4:e1000160. [DOI] [PMC free article] [PubMed] [Google Scholar]
- 43.Lek M, Karczewski KJ, Minikel EV, et al. Analysis of protein‐coding genetic variation in 60,706 humans. Nature. 2016;536:285–291. [DOI] [PMC free article] [PubMed] [Google Scholar]
- 44.Secrest MH, Storm M, Carrington C, et al. Prevalence of pyruvate kinase deficiency: A systematic literature review. Eur J Haematol. 2020;105:173–184. [DOI] [PMC free article] [PubMed] [Google Scholar]
- 45.Canu G, De Bonis M, Minucci A, Capoluongo E. Red blood cell PK deficiency: An update of PK‐LR gene mutation database. Blood Cells Mol Dis. 2016;57:100–109. [DOI] [PubMed] [Google Scholar]
- 46.Campitell P, Swint‐Kruse L, Ozkan S. Substitutions at non‐conserved rheostat positions modulate function by re‐wiring long‐range, dynamic interactions. Mol Biol Evol. 2020;38:201–214. [DOI] [PMC free article] [PubMed] [Google Scholar]
- 47.Shannon C. The mathematical theory of communication. Bell Syst Tech J. 1948;27(379–423):623–656. [Google Scholar]
- 48.Armon A, Graur D, Ben‐Tal N. ConSurf: An algorithmic tool for the identification of functional regions in proteins by surface mapping of phylogenetic information. J Mol Biol. 2001;307:447–463. [DOI] [PubMed] [Google Scholar]
- 49.Ashkenazy H, Erez E, Martz E, Pupko T, Ben‐Tal N. ConSurf 2010: Calculating evolutionary conservation in sequence and structure of proteins and nucleic acids. Nucleic Acids Res. 2010;38:W529–W533. [DOI] [PMC free article] [PubMed] [Google Scholar]
- 50.Mihalek I, Res I, Lichtarge O. Evolutionary trace report_maker: A new type of service for comparative analysis of proteins. Bioinformatics. 2006;22:1656–1657. [DOI] [PubMed] [Google Scholar]
- 51.Lichtarge O, Bourne HR, Cohen FE. An evolutionary trace method defines binding surfaces common to protein families. J Mol Biol. 1996;257:342–358. [DOI] [PubMed] [Google Scholar]
- 52.Brown CA, Brown KS. Validation of coevolving residue algorithms via pipeline sensitivity analysis: ELSC and OMES and ZNMI, oh my! PLoS One. 2010;5:e10779. [DOI] [PMC free article] [PubMed] [Google Scholar]
- 53.Fodor AA, Aldrich RW. Influence of conservation on calculations of amino acid covariance in multiple sequence alignments. Proteins. 2004;56:211–221. [DOI] [PubMed] [Google Scholar]
- 54.Kass I, Horovitz A. Mapping pathways of allosteric communication in GroEL by analysis of correlated mutations. Proteins. 2002;48:611–617. [DOI] [PubMed] [Google Scholar]
- 55.Dekker JP, Fodor A, Aldrich RW, Yellen G. A perturbation‐based method for calculating explicit likelihood of evolutionary co‐variance in multiple sequence alignments. Bioinformatics. 2004;20:1565–1572. [DOI] [PubMed] [Google Scholar]
- 56.Lockless SW, Ranganathan R. Evolutionarily conserved pathways of energetic connectivity in protein families. Science. 1999;286:295–299. [DOI] [PubMed] [Google Scholar]
- 57.Gobel U, Sander C, Schneider R, Valencia A. Correlated mutations and residue contacts in proteins. Proteins. 1994;18:309–317. [DOI] [PubMed] [Google Scholar]
- 58.Olmea O, Rost B, Valencia A. Effective use of sequence correlation and conservation in fold recognition. J Mol Biol. 1999;293:1221–1239. [DOI] [PubMed] [Google Scholar]
- 59.Olmea O, Valencia A. Improving contact predictions by the combination of correlated mutations and other sources of sequence information. Fold Des. 1997;2:S25–S32. [DOI] [PubMed] [Google Scholar]
- 60.Chonofsky M, de Oliveira SHP, Krawczyk K, Deane CM. The evolution of contact prediction: Evidence that contact selection in statistical contact prediction is changing. Bioinformatics. 2020;36:1750–1756. [DOI] [PubMed] [Google Scholar]
- 61.Bromberg Y, Yachdav G, Rost B. SNAP predicts effect of mutations on protein function. Bioinformatics. 2008;24:2397–2398. [DOI] [PMC free article] [PubMed] [Google Scholar]
- 62.Hecht M, Bromberg Y, Rost B. Better prediction of functional effects for sequence variants. BMC Genomics. 2015;16(Suppl. 8):S1. [DOI] [PMC free article] [PubMed] [Google Scholar]
- 63.Valentini G, Chiarelli LR, Fortin R, et al. Structure and function of human erythrocyte pyruvate kinase. Molecular basis of nonspherocytic hemolytic anemia. J Biol Chem. 2002;277:23807–23814. [DOI] [PubMed] [Google Scholar]
- 64.Fenton AW, Hutchinson M. The pH dependence of the allosteric response of human liver pyruvate kinase to fructose‐1,6‐bisphosphate, ATP, and alanine. Arch Biochem Biophys. 2009;484:16–23. [DOI] [PMC free article] [PubMed] [Google Scholar]
- 65.Ishwar A, Tang Q, Fenton AW. Distinguishing the interactions in the fructose 1,6‐bisphosphate binding site of human liver pyruvate kinase that contribute to allostery. Biochemistry. 2015;54:1516–1524. [DOI] [PMC free article] [PubMed] [Google Scholar]
- 66.Tang Q, Fenton AW. Whole‐protein alanine‐scanning mutagenesis of allostery: A large percentage of a protein can contribute to mechanism. Hum Mutat. 2017;38:1132–1143. [DOI] [PMC free article] [PubMed] [Google Scholar]
- 67.Nakas CT, Yiannoutsos CT. Ordered multiple‐class ROC analysis with continuous measurements. Stat Med. 2004;23:3437–3449. [DOI] [PubMed] [Google Scholar]
- 68.Nakas CT, Alonzo TA, Yiannoutsos CT. Accuracy and cut‐off point selection in three‐class classification problems using a generalization of the Youden index. Stat Med. 2010;29:2946–2955. [DOI] [PMC free article] [PubMed] [Google Scholar]
- 69.Bantis L, Nakas C, Reiser B. Construction of joint confidence regions for the optimal true class fractions of receiver operating characteristic (ROC) surfaces and manifolds. Stat Meth Med Res. 2017;26:1429–1442. [DOI] [PubMed] [Google Scholar]
- 70.Swint‐Kruse L, Zhan H, Matthews KS. Integrated insights from simulation, experiment, and mutational analysis yield new details of LacI function. Biochemistry. 2005;44:11201–11213. [DOI] [PubMed] [Google Scholar]
- 71.Swint‐Kruse L, Zhan H, Fairbanks BM, Maheshwari A, Matthews KS. Perturbation from a distance: Mutations that alter LacI function through long‐range effects. Biochemistry. 2003;42:14004–14016. [DOI] [PubMed] [Google Scholar]
- 72.Zhan H, Camargo M, Matthews KS. Positions 94−98 of the lactose repressor N‐subdomain monomer−monomer interface are critical for allosteric communication. Biochemistry. 2010;49:8636–8645. [DOI] [PMC free article] [PubMed] [Google Scholar]
- 73.Zhan H, Sun Z, Matthews KS. Functional impact of polar and acidic substitutions in the lactose repressor hydrophobic monomer–monomer interface with a buried lysine. Biochemistry. 2009;48:1305–1314. [DOI] [PubMed] [Google Scholar]
- 74.Chang WI, Matthews KS. Role of Asp274 in lac repressor: Diminished sugar binding and altered conformational effects in mutants. Biochemistry. 1995;34:9227–9234. [DOI] [PubMed] [Google Scholar]
- 75.Chakerian AE, Matthews KS. Characterization of mutations in oligomerization domain of Lac repressor protein. J Biol Chem. 1991;266:22206–22214. [PubMed] [Google Scholar]
- 76.Xu J, Matthews KS. Flexibility in the inducer binding region is crucial for allostery in the Escherichia coli lactose repressor. Biochemistry. 2009;48:4988–4998. [DOI] [PMC free article] [PubMed] [Google Scholar]
- 77.Tungtur S, Schwingen KM, Riepe JJ, Weeramange CJ, Swint‐Kruse L. Homolog comparisons further reconcile in vitro and in vivo correlations of protein activities by revealing over‐looked physiological factors. Protein Sci. 2019;28:1806–1818. [DOI] [PMC free article] [PubMed] [Google Scholar]
- 78.Chen J, Matthews KS. T41 mutation in lac repressor is Tyr282—Asp. Gene. 1992;111:145–146. [DOI] [PubMed] [Google Scholar]
- 79.Elf J, Li GW, Xie XS. Probing transcription factor dynamics at the single‐molecule level in a living cell. Science. 2007;316:1191–1194. [DOI] [PMC free article] [PubMed] [Google Scholar]
- 80.Bell CE, Barry J, Matthews KS, Lewis M. Structure of a variant of lac repressor with increased thermostability and decreased affinity for operator. J Mol Biol. 2001;313:99–109. [DOI] [PubMed] [Google Scholar]
- 81.Nichols JC, Matthews KS. Combinatorial mutations of lac repressor. Stability of monomer‐monomer interface is increased by apolar substitution at position 84. J Biol Chem. 1997;272:18550–18557. [DOI] [PubMed] [Google Scholar]
- 82.Lin S, Riggs AD. The general affinity of lac repressor for E. coli DNA: Implications for gene regulation in procaryotes and eucaryotes. Cell. 1975;4:107–111. [DOI] [PubMed] [Google Scholar]
- 83.Lin SY, Riggs AD. Lac repressor binding to non‐operator DNA: Detailed studies and a comparison of equilibrium and rate competition methods. J Mol Biol. 1972;72:671–690. [DOI] [PubMed] [Google Scholar]
- 84.von Hippel PH, Revzin A, Gross CA, Wang AC. Interaction of lac repressor with non specific DNA binding sites. Protein Ligand Interact Symp. 1974;0:270–280. [Google Scholar]
- 85.Barry JK, Matthews KS. Thermodynamic analysis of unfolding and dissociation in lactose repressor protein. Biochemistry. 1999;38:6520–6528. [DOI] [PubMed] [Google Scholar]
- 86.Lin SY, Riggs AD. Lac repressor binding to DNA not containing the lac operator and to synthetic poly dAT. Nature. 1970;228:1184–1186. [DOI] [PubMed] [Google Scholar]
- 87.Holyoak T, Zhang B, Deng J, Tang Q, Prasannan CB, Fenton AW. Energetic coupling between an oxidizable cysteine and the phosphorylatable N‐terminus of human liver pyruvate kinase. Biochemistry. 2013;52:466–476. [DOI] [PMC free article] [PubMed] [Google Scholar]
Associated Data
This section collects any data citations, data availability statements, or supplementary materials included in this article.
Supplementary Materials
Appendix S1: Supporting Information