Abstract
Microbial biodegradation of rubber relies on extracellular rubber oxygenases that catalyze the oxidative cleavage of the double bond of the polyisoprene backbone into oligo-isoprenoids. This protocol describes the determination of rubber oxygenase activities by an online measurement of molecular oxygen consumption via a non-invasive fluorescence-based assay. The produced oligo-isoprenoid cleavage products with terminal keto- and aldehyde-groups are identified qualitatively and quantitatively by HPLC. Our method allows for the characterization of homologue rubber oxygenases, and can likely be adapted to assay other oxygenases consuming dioxygen. Here we describe the determination of rubber oxygenase activities at the examples of the so far two known types of rubber oxygenases, namely rubber oxygenase A (RoxA) and latex clearing protein (Lcp).
Keywords: Latex clearing protein (Lcp), Rubber oxygenase, Dioxygenase, Polyisoprene, Rubber, Oxygen monitoring
Background
Oxygen is a key element in aerobic metabolism and is essential for the catabolism of hydrocarbons. Therefore the quick and accurate measurement of oxygen concentrations in solutions is of interest to monitor oxygen-dependent processes in biotechnology or reactions in biochemistry. Usually a Clark electrode is employed for these purposes. In many cases, however, the use of a Clark electrode is limited due to the necessity of a direct contact of the electrode with the analyte. Some examples comprise turbid solutions in monitoring fermentation processes or complex matrices like colloid latex emulsions as investigated by our research group. Another important aspect distinguishing this protocol from other oxygen detection assays is the very small amount of only 500 µl sample volume required for the in vitro assay. This protocol allows for the rapid and reproducible determination of the oxygen concentration of latex emulsions but likely is transferable to many other applications. In this non-invasive assay, a small sensor spot with a diameter of only ~4 mm is placed in the reaction vessel (cuvette) and comes into contact with the analyte. The sensor spot is excited by light that is emitted by the transmitter unit and guided to the sensor spot via a light conducting cable. The emitted fluorescence light is quenched by dioxygen and the signal intensity is proportional to the concentration of dioxygen. Since oxygen is the co-substrate of polyisoprene cleavage by rubber oxygenases, the activity of the enzymes can be calculated by determination of the oxygen consumption. The second assay describes the extraction of enzyme-produced oligo-isoprenoids with ethyl acetate and their qualitative and quantitative determination by high pressure liquid chromatography (HPLC). For information on the biochemical and molecular biological properties of rubber oxygenases we refer to the following references for RoxA enzymes ( Braaz et al., 2004 and 2005; Schmitt et al., 2010 ; Birke et al., 2012 and 2013; Seidel et al., 2013 ) and for Lcp ( Hiessl et al., 2014 ; Birke and Jendrossek, 2014; Birke et al., 2015 ; Watcharakul et al., 2016 ; Röther et al., 2016 ).
Materials and Reagents
Duct tape (e.g., Tesa, extra Power universal)
50 ml Falcon tubes (e.g., SARSTEDT, catalog number: 62.559.001)
15 ml Falcon tubes (e.g., SARSTEDT, catalog number: 62.554.502)
2 ml reaction tubes (e.g., SARSTEDT, catalog number: 72.695.500)
0.3 ml limited volume inserts (e.g., Brown, catalog number: 155650)
Hot glue
Silicone Compound (e.g., RS Components, catalog number: 692-542)
1.5 ml tubes (e.g., SARSTEDT, catalog number: 72.690.001)
Protein determination assay (e.g., Pierce BCA Kit, Thermo Fisher Scientific, Thermo ScientificTM, catalog number: 23225)
Latex milk, 60%, low ammonia (e.g., Weber&Schaer, Hamburg, catalog number: RSS LA)
Purified rubber oxygenases, Lcp or RoxA of known concentration
Methanol for HPLC (e.g., VWR, catalog number: 20864.320)
Ethyl acetate (e.g., Carl Roth, catalog number: 7338)
Nitrogen gas
Monopotassium phosphate (KH2PO4) (e.g., Carl Roth, catalog number: 3904)
Dipotassium phosphate (K2HPO4) (e.g., Carl Roth, catalog number: 6875)
Nonidet P-40 (e.g., Sigma-Aldrich, catalog number: 74385)
Sodium phosphate buffer (KP), e.g., 100 mM, pH 7 (see Recipes)
Nonidet P-40 solution (see Recipes)
Natural rubber latex (see Recipes)
Diluted colloidal latex buffer (see Recipes)
Equipment
Oxy-4-mini transmitter (PreSens, catalog number: 200000767)
Sharp scissors
Absorption cells (cuvettes), semi-micro, light path 10 mm, volume 1,400 µl, optical special glass, 4 pieces (e.g., Hellma analytics, catalog number: 114-10-20)
Cuvette rack 16 x 1 cm (e.g., Carl Roth, catalog number: CNP5.1)
Oxygen Sensor Spots, SP-PSt3-NAU-D5-YOP (PreSens, catalog number: 200000023)
3 mm power drill
Light conducting cable (2.5 m, 4 pieces, POF-L2.5-1SMA) (PreSens, catalog number: 200000241; designated in the manual as ‘polymer optical fiber’)
Cryo storage box (e.g., Greiner Bio one International, catalog number: 802 202)
Magnetic micro stirrer 5 x 2 mm, 4 pieces (e.g., Carl Roth, catalog number: 0955.2)
Centrifuge (e.g., Eppendorf, model: 5417 C)
Autoclave
Heat-stable container
Pipette
Beaker
HPLC (e.g., Agilent Technologies, model: Agilent 1100 series; DAAD detector at 210 nm)
LiChrospher 100 RP-8 5 µm endcapped HPLC column (e.g., Trentec, catalog number: 124LP-85ER used in this assay; or alternatively EMD Millipore, catalog number: 150827)
HPLC glass vial (e.g., Brown, catalog number: 155710)
Fume cabinet
Laboratory thermometer (e.g., VOLTCRAFT, model: DET1R)
Software
Oxy4 V2 (Presens, Regensburg, Germany)
Excel (Microsoft, Redmont, USA)
Chem Station for LC 3D systems (Agilent Technologies, Waldbronn, Germany)
Procedure
Note: Ensure that all safety instructions for the handling of hazardous compounds and for waste management are properly considered; since these may vary in different countries the following protocol does not provide any instruction on these issues.
Part I. Oxygen consumption assay
In solutions, the oxygen concentration can be monitored in real time and allows for the biochemical characterization of oxygenases. Here, we describe an assay to analyze the oxidative cleavage of rubber (polyisoprene) by rubber oxygenases such as rubber oxygenase RoxA or latex clearing protein (Lcp).
-
Preparations
Prepare the oxygen monitoring instrument according to the instructions supplied by the respective manufacturer.(e.g., PreSensOxy-4-mini, https://www.presens.de/products/o2/meters.html)
The sensor spots are excited by light and therefore should be kept in a dark environment for long time storage when not in use, otherwise their reactivity and sensitivity will decrease.
Cut the sensor spot in shape using sharp scissors. Don’t cut away too much to ensure a surface as big as possible but still fitting into the cuvette, here ~4 x 5 mm. Use long, slender tongs to reach into the cuvette.
Pay attention to the orientation of the sensor spot, in case of PreSens spots, the red side comes in contact with the silicon compound and the glass wall of the cuvette whereas the black side represents the inside and comes in contact with the reaction mix later. Be careful not to put silicone compound on the black, reactive side of the sensor spot.
Glue one sensor spot to the inner surface of each cuvette 5 mm above the bottom. Use the specified silicone compound as instructed by the manufacturer. For a video see: http://www.presens.de/support/presens-tv/how-to/o2-spot-integration-part1-glassvials.html. Dry overnight at room temperature in the dark. Prepare four cuvettes, compare Figure 1.
-
To align the light cable with the sensor spots in the cuvettes, a self-made, modified cuvette rack is employed that is not commercially available. Instruction for assembly:
Cut the 16 slot cuvette rack in the middle (to give two equal sized halves).
Seal the bottoms of the four front slots with duct tape.
Fill the cavity completely with hot glue, wait until the glue is solid.
Cut away the bottoms of the four remaining slots (see Figure 2) so that the cuvettes fit in completely.
-
Use a 3 mm power drill to drill a hole from the front of the cuvette rack to the back.
Note: Be very careful not to bend the light conducting cable, otherwise it might break and become dysfunctional.
Insert the light conducting cable so that the interface of the cable is correctly aligned with the sensor spot in the cuvette, compare Figure 2.
Secure the light conducting cable against mechanical stress with a drop of hot glue to the cuvette rack.
Repeat this procedure to prepare four slots.
To finish the apparatus, glue the prepared block on the lid of a cryo storage box as a strain relief for the light conducting cable.
Now your device should look comparable to the one pictured in Figure 2.
Upon completion, position the device on a magnetic stirring unit and set it to ~750 rpm to mix the reagent solutions with a magnetic micro stirrer (5 x 2 mm) in each cuvette.
This simple and cheap measuring station has been set up because, to our knowledge, no small scale measuring vessels are available; furthermore, in protein assays often only a very small amount of sample is available and our set up saves reagents and enzymes. Alternatively, one might employ a poly-carbonate block and mill the cavities into the block or to use a 3D-printer to assemble a cuvette holder. The assembly can easily be adjusted for another number of cuvettes. Other variants and sizes of cuvettes can be employed for the assay as well.
-
Measurement of oxygen consumption
-
Measurement of protein concentration
-
Determine the protein concentration of the oxygenase to be characterized in this assay exactly by a suitable method, e.g., using the Bradford assay, the BCA assay, or, as in our case, spectroscopically via the known specific extinction coefficient of the heme containing rubber oxygenases. For example: spectroscopic determination of a LcpK30 protein concentration c
E412 = ε412 x c x d or c = E412 x ε412-1 x d-1
Where,
ε412: extinction coefficient of LcpK30, 80,000 M-1 x cm-1 [L mol-1 cm-1] at 412 nm
E412: absorbance measured spectroscopically at 412 nm [no unit]
d: path length of the cuvette, usually 1 cm
LcpK30 molecular weight ~43,300 Da = 43,300 g x mol-1
Experimental data: measure the extinction of your protein of interest with a photometer in a cuvette with a path length of 1 cm in a suitable dilution; in the following example a value for the extinction at 412 nm of 0.5 was recorded for a 1:10 dilution of a purified LcpK30 solution.E412 = 0.5; dilution = 1:10, path length = 1 cm.
-
Calculation:
c = 0.5/80,000 x 1 [M x cm/cm] = [M]
c = 0.5/80 [mM] = 500/80 [µM] = 6.25 µM
1 M LcpK30 = 43,300 g/L
1 µM LcpK30 = 0.0433 g/L = 43.3 mg/L
6.25 µM LcpK30 = 271.6 mg/L, since the protein was 1:10 diluted the concentration of the undiluted protein solution is 2716 mg/L or ~2.7 mg/ml
-
-
Washing of latex milk
Stock latex milk containing approximately 60% polyisoprene latex is usually stabilized with ammonia that has to be removed by washing.
Prepare 200 ml 0.1% wt/vol Nonidet P-40 by solving the detergent in deionized water.
Pour 25 ml stock latex milk into a 50 ml Falcon tube and add 25 ml Nonidet solution.
Invert the tube 10 times. Do not vortex or shake to prevent coagulation of the polymer.
Centrifuge the tube at 11,000 × g at 4 °C for 1 h to separate the latex from the solution.
Remove the white latex on top with a spatula into a new 50 ml tube.
Discard the washing solution.
Add Nonidet solution to the latex up to 50 ml.
Resuspend the latex by inverting the tube several times.
Repeat the washing procedure three times.
After the last centrifugation step, weigh the remaining latex and dilute it to a concentration of 60% wt/vol with Nonidet solution.
The washed natural rubber latex can be autoclaved (liquid cycle 121 °C for 20 min) in a heat-stable container and stored at ~5 °C for approximately 6 months.
-
Preparation of diluted colloidal latex buffer
-
For use in the oxygen consumption assay, dilute the washed natural rubber latex to 0.2% wt/vol with air-saturated potassium phosphate buffer (KP, see Recipes) at the desired pH, usually pH 7.
For example, pipette 6 ml KP buffer into a 15 ml Falcon tube and add 20 µl of the washed natural rubber latex in Nonidet solution, invert the tube 5 times.
Incubate the buffer-diluted latex emulsion until the desired temperature (e.g., room temperature, 23 °C) is constantly reached; alternatively the whole system can be placed in a room with an elevated temperature, e.g., 30 °C). This is important since oxygen saturation depends on the temperature.
-
-
Prearrangements for measuring oxygen saturation.
Pipette 500 µl freshly prepared diluted colloidal latex buffer into each cuvette.
Add a magnetic stirring rod to mix the emulsion at 750 rpm.
Equilibrate for 2 min.
-
Operation of the software
Start the program for monitoring, in our case we use ‘oxy4v2’ for the measurement of the dissolved oxygen concentration in the cuvettes via the transmitter oxy4-mini.
-
Calibration
Select the tab labeled ‘Calibration’.
-
Press the button labeled ‘All Channels’.
Calibrate the diluted colloidal latex buffer to 100% saturation by pressing the button ‘CAL 100 %’. This corresponds to an oxygen concentration of ~8.3 mg per L at 23 °C. The slight difference in oxygen concentration between distilled water and the buffered assay emulsion used in this study is negligible. A second calibration with 0% oxygen is not necessary.
-
Data logging
Select the tab labeled ‘logging’.
Press the button labeled ‘All Active Channels’.
Pick a distinct file storage location and file name, e.g., ‘date_1Lcp_2Lcp_3blank_4blank_pH_temperature’.
Press the button ‘save’.
-
Setup for measurements
Select the tab labeled ‘Measurement’.
Pick a suitable sampling rate, e.g., 15 sec, equal for all cuvettes.
Select 23 °C as the channel temperature when measuring at 23 °C room temperature.
Choose ‘% air saturation’ as the oxygen unit.
Press the button ‘All channels’ to start logging of acquired measurement data.
Pay attention that the amplitude is in the green range, indicating that the light conducting cable and the sensor spot in the cuvette are properly aligned.
-
Execution of the measurement
Select the tab labeled ‘All Channels’ to view the saturation graph for all channels.
Measure the baseline for up to 10 min until linearity of the oxygen saturation has been reached. The value should be at ~100 ± 2% for all channels.
-
Add the desired amount of enzyme to the assay mixture in each cuvette with a pipette or Hamilton syringe. Usually, a concentration of 4 µg/ml rubber oxygenase is sufficient to achieve a decrease of the oxygen concentration with a measurable slope in ~10 min.
For example: enzyme in the assay/protein concentration x assay volume = amount:
4 µg/ml/0.25 µg/µl x 0.5 ml = 8 µl.
Note: The decrease in oxygen concentration should be linear for at least 5 min. For routine assays, the cuvettes do not need to be sealed because oxygen consumption by the enzyme is much faster than diffusion of oxygen into the assay mixture.
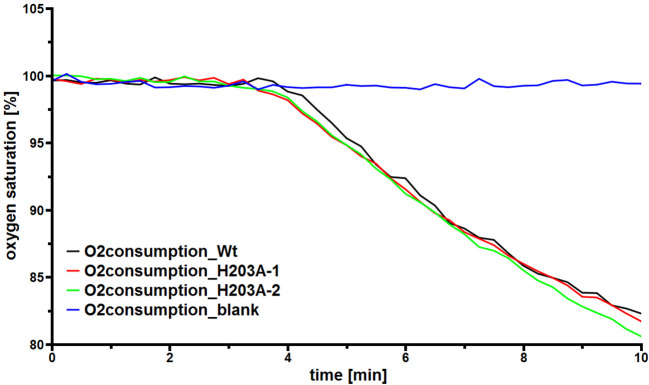
Stop the measurement by selecting the tab ‘Measurement’ and press the button ‘All Channels’. A representative dataset with a blank without enzyme (blue), wild type Lcp as reference (black) and two mutein samples (red and green) is pictured in Figure 3. Data was also shown in the supplementary materials of Röther et al., 2016 .
-
Termination and cleaning of the device
Carefully remove each cuvette from the rack and pour the assay solution into a beaker to avoid loss of the magnetic stirrer. Wash the cuvette and stirrer with deionized water 3 times and dry the cuvettes in a dark environment.
After prolonged measurements with diluted colloidal latex buffer, some precipitation of latex in the cuvettes might occur. The residual latex can be removed with a 2 mm spatula from the glass. Pay attention to the sensor spot to avoid damage. Do not use solvents to clean the inside of the cuvettes since they might dissolve the silicone compound securing the sensor spot in place. The spots can be reused as long as the amplitude is still indicated as sufficient by the software. If necessary, the sensor spot can be removed with a spatula and remains of the silicone compound can be removed with acetone. After drying the cuvette, a new sensor spot can be glued into the cuvette as described above.
From the logged saturation data files, the slope of the decrease can be calculated using e.g., Excel as shown in the data analysis section. For data analysis and determination of specific enzyme activities, see below. Figure 3 shows a representative dataset for a measurement with four cuvettes.
-
-
Inhibitor studies
This assay allows for the rapid and easy determination of enzyme activities depending on the measurement of oxygen saturation. It is possible to compare different enzymes, muteins, or to investigate the effect of potential inhibitors. As an example, 0.1% SDS inhibits oxygen consumption by Lcp.
Part II. HPLC based separation of rubber cleavage products
After the oxidative polyisoprene cleavage occurred, the produced oligo-isoprenoids can be extracted from the reaction mixture and subsequently separated by HPLC for analysis as described below.
Figure 1. Oxygen monitoring cuvettes.
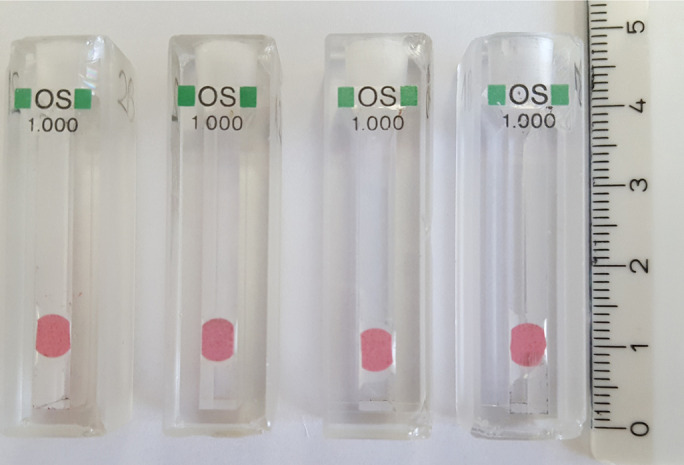
The total volume per cuvette is 1.4 ml. A PreSens oxygen sensor spot (red) was cut and glued in place as described above.
Figure 2. Images of the finished cuvette holder used to align the sensor spots glued into the cuvettes with the light conducting cable.
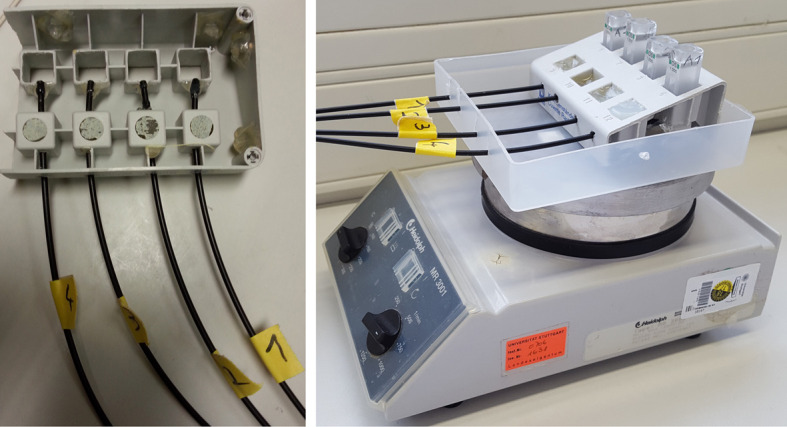
The apparatus is placed on a magnetic stirring device to mix the reaction.
Figure 3. A representative dataset showing the monitoring of the oxygen saturation of diluted colloidal latex buffer.
A blank without enzyme (blue) represents a baseline. After ≈ 4 min, wild type Lcp as reference (black) and two mutein samples (red and green) were added separately. The data are also shown in the supplementary materials of Röther et al., 2016 .
-
Preparations
Set up the HPLC apparatus according to the instructions supplied by the manufacturer and install the RP-8 reversed phase column.
Degas deionized water.
Supply the water as first mobile phase and methanol as the second.
Program a flow rate of 0.7 ml/min at 23 °C.
Program the injection volume of 20 µl sample per run.
-
Program the solvent gradient:
Minute Water (%) Methanol (%) 0-5 50 50 isocratic 5-25 0 100 gradient 25-35 0 100 isocratic 35-36 50 50 gradient 36-40 50 50 isocratic
-
Oxidative polyisoprene cleavage assay
Label 2 ml reaction tubes and place them in a rack.
Pipette 700 µl diluted colloidal latex buffer (0.2%, see Part I, step B3) into each tube and adjust the temperature.
If applicable, add the inhibitors at desired concentrations to the solution.
Add the designated amount of enzyme, usually the final concentration is 4 µg/ml.
Incubate the mixture with the lid open at the desired temperature, usually for 2 h for polyisoprene cleavage, shake softly every 30 min.
Always prepare a blank without enzyme and treat it equally.
-
Extraction of oligo-isoprenoids
Work in a fume cabinet without ignition sources nearby when using ethyl acetate or methanol.
Add 1,000 µl ethyl acetate to each tube containing 700 µl reaction volume.
Close the lid and vortex the tube for 20 sec, white latex will coagulate.
Centrifuge all tubes for 2 min at 20,000 × g at room temperature.
Label 1.5 ml tubes according to the assay and remove 900 µl of the upper solvent phase carefully to avoid mixing and spillage. Discard the 2 ml tubes.
Evaporate the ethyl acetate completely overnight in the fume cabinet or enhance evaporation by flushing carefully with nitrogen gas at ~0.2 L/min.
Add 100 µl methanol to the tube and rinse the walls of the 1.5 ml tube by pipetting the solution up and down 5 times to dissolve the cleavage products. Transfer the methanol-product solution into an HPLC glass vial supplemented with a 0.3 ml small volume insert and screw on the lid.
Apply all samples to HPLC analysis.
Data analysis
Part I. Oxygen consumption assay
-
Evaluation
The measurement of the oxygen concentration is very sensitive but also error prone to several factors.
Due to the temperature and pressure dependent solubility of oxygen, measurements have to be performed at a constant temperature and analyzed with respect to the pressure. Slight variations in atmospheric pressure are within the margin of error of the method, however.
Prolonged practical use of the method showed that each experiment should be repeated three times with data acquired for six measurements.
-
The derived routine assay with four cuvettes is as follows:
Blank without enzyme.
Wild type as reference.
Mutein sample A.
Mutein sample B.
Three repetitions correspond to 6 files for the mutein and 3 baseline files as well as 3 datasets for the wild type protein as a reference, requiring statistical similarity of the samples among each other (mean ± 3 x standard deviation).
-
Calculation of specific enzyme activities
After finishing the described oxygen monitoring, a text file in the *.csv format is saved automatically for each channel separately in the specified location.
It contains a summary of information about the oxymeter and the chosen parameter settings. The results of interest for this analysis are logged as a semicolon (;) separated dataset.
Open the *.csv file in a suitable calculation software e.g., MS Excel.
Select the first column and press the tab ‘data’. Select ‘Text in columns’. Choose ‘Separated’ and choose semicolon (;) as the separator. This should separate the first column into several columns, one for each parameter.
To analyze the oxygen consumption, only two columns are of interest. The time as the x-axis and the ‘Oxy/% air sat.’ as y-axis. Extract both columns into a new spreadsheet.
Repeat these steps to process the data for all channels and paste the values into the spreadsheet.
In the new spreadsheet, plot a graph using the X-Y scatter chart with lines option. The plot should look like the one shown during the measurement with the oxy-4v2 software.
Since we calibrate the oxygen saturation to 100% using air-saturated diluted colloidal latex buffer, the measurement of the baseline is in the range of 100% prior to enzyme addition. Thereafter, a decrease of oxygen due to enzymatic reaction is visible and we use the slope of the linear decrease to calculate the specific enzyme activity.
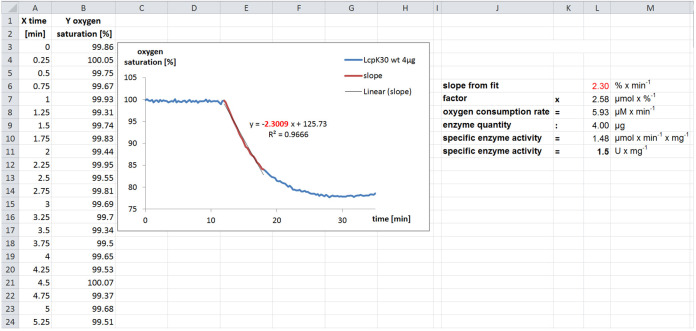
To determine the slope via linear regression, the easiest way is to copy the data of the linear decrease into a new series in the same diagram. For this line, we calculate the slope using the ‘trend line’ feature. Specify ‘linear’ and check the boxes to show the formula and the coefficient of determination (1 indicates best fit) for the fit. The unit of the slope is % O2 min-1.
At 23 °C and 1,013 mbar, 1 L air-saturated diluted colloidal latex buffer contains ~8.3 mg O2. This is equivalent to 259 µmol O2 = 100%. Therefore, a decrease in oxygen saturation by 1% corresponds to ~2.6 µmol dioxygen (2.6 µmol %-1)
To calculate the molar oxygen consumption rate, multiply the calculated slope and the factor: 2.3% min-1 x 2.6 µmol %-1 ~6.0 µmol min-1. This value corresponds to a volume of 1 L and is equal to 3.0 nmol min-1 in the 0.5 ml volume of the cuvette.
To determine the specific enzyme activity, divide the molar oxygen consumption rate by the enzyme quantity used for the determination of the slope, in this case 2 µg to get 1.5 nmol min-1 µg protein-1 or 1.5 µmol min-1 mg-1 (corresponding to 1.5 U/mg).
The specific activity of wild type LcpK30 (Lcp from Streptomyces sp. strain K30) is 1.5 U/mg at 23 °C ( Watcharakul et al., 2016 ) correlating with 1.3 U/mg determined for a homologue Lcp from Gordonia polyisoprenivorans strain VH2 (LcpVH2) investigated by another group ( Hiessl et al., 2014 ).
-
Repeat this evaluation for all measurements, the values for replicates should be within the margin of standard error.
Note: The decrease in oxygen concentration often slows down after an initial constant decrease (Figure 4) or even slightly increases again. This can be explained by diffusion of oxygen into the (not sealed) assay buffer. In case you wish to monitor the oxygen consumption rate for a longer time period you have to seal the cuvette or you should use a larger volume of the assay mixture.
Part II. HPLC based separation of oligo-isoprenoids
After the analysis of each sample by HPLC, a report file is saved that can be evaluated using an appropriate software, in our case Agilent Chem Station.
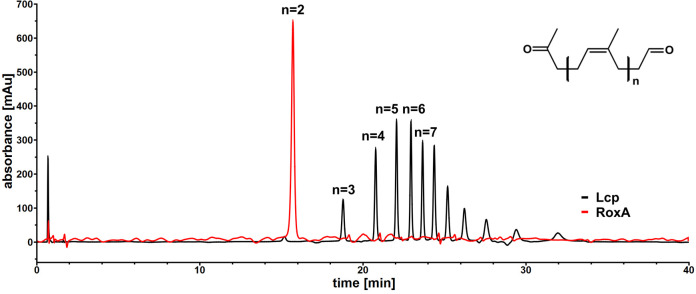
For data processing, only a simple baseline correction by subtracting a blank run without enzyme from each result is sufficient. An example of a successful analysis is pictured in Figure 5.
The identification of the peaks is possible according to their respective retention time in this assay. Analysis by HPLC MS was used to identify the corresponding oligo-isoprenoid molecules in previous studies ( Braaz et al., 2005 ; Birke and Jendrossek, 2014).
Quantification is possible by calculating the peak areas and by comparison to equally treated enzymes of known activity and concentration to determine relative activities.
For RoxA proteins, usually only one major degradation product (n = 2) is detected. In contrast, Lcp cleaves rubber to a variety of oligo-isoprenoids with different numbers (n) of isoprene units (Figure 5).
Figure 4. Example calculation of the specific activity of LcpK30.
In this experiment an assay volume of 1 ml was used. The values for time (X) and oxygen saturation (Y) are measured as described and extracted from the resulting *.csv file into a spreadsheet. The data was visualized in an X-Y scatterplot. The addition of enzyme after 12 min resulted in a decrease of the oxygen saturation due to incorporation of dioxygen during cleavage of polyisoprene. The slope can be fitted and is proportional to the enzyme activity. By multiplying the proportionality factor and dividing by the enzyme quantity used in the measurement, the specific enzyme activity can be calculated as described.
Figure 5. HPLC chromatogram for Lcp (black) and RoxA (red) derived cleavage products after subtraction of a blank run without enzyme.
The formula of generated oligo-isoprenoid products is shown at the top right. The number of isoprene units in the cleavage products is indicated by the value of n above the identified peaks.
Recipes
-
Sodium phosphate (KP) buffer
Prepare 100 mM solutions of KH2PO4 and K2HPO4 separately
Mix both solutions to adjust the pH of the resulting KP buffer, usually pH 7.0
To prepare a buffer of pH 7 mix 5 volumes of the alkaline K2HPO4 solution with 4 volumes of the acidic KH2PO4 solution
-
Nonidet P-40 solution
Add 0.1% wt/vol of the detergent to deionized water
-
Natural rubber latex
Prepare as described above (Procedure Part I, step B2)
-
Diluted colloidal latex buffer
Prepare as described above (Procedure Part I, step B3)
Acknowledgments
We thank the Deutsche Forschungsgemeinschaft (DFG Je152/17 and Je152/18) for funding, PreSens, Germany, Weber and Schaer, Germany and IBA Life Sciences, Germany for supplying sensor spots, polyisoprene latex and Strep-Tactin columns, respectively.
Citation
Readers should cite both the Bio-protocol article and the original research article where this protocol was used.
References
- 1.Birke J., Hambsch N., Schmitt G., Altenbuchner J. and Jendrossek D.(2012). Phe317 is essential for rubber oxygenase RoxA activity. Appl Environ Microbiol 78(22): 7876-7883. [DOI] [PMC free article] [PubMed] [Google Scholar]
- 2.Birke J. and Jendrossek D.(2014). Rubber oxygenase and latex clearing protein cleave rubber to different products and use different cleavage mechanisms. Appl Environ Microbiol 80(16): 5012-5020. [DOI] [PMC free article] [PubMed] [Google Scholar]
- 3.Birke J., Röther W. and Jendrossek D.(2015). Latex clearing protein(Lcp) of Streptomyces sp. strain K30 is a b-type cytochrome and differs from rubber oxygenase A(RoxA) in its biophysical properties . Appl Environ Microbiol 81(11): 3793-3799. [DOI] [PMC free article] [PubMed] [Google Scholar]
- 4.Birke J., Röther W., Schmitt G. and Jendrossek D.(2013). Functional identification of rubber oxygenase(RoxA) in soil and marine myxobacteria. Appl Environ Microbiol 79(20): 6391-6399. [DOI] [PMC free article] [PubMed] [Google Scholar]
- 5.Braaz R., Armbruster W. and Jendrossek D.(2005). Heme-dependent rubber oxygenase RoxA of Xanthomonas sp. cleaves the carbon backbone of poly(cis-1,4-Isoprene) by a dioxygenase mechanism . Appl Environ Microbiol 71(5): 2473-2478. [DOI] [PMC free article] [PubMed] [Google Scholar]
- 6.Braaz R., Fischer P. and Jendrossek D.(2004). Novel type of heme-dependent oxygenase catalyzes oxidative cleavage of rubber(poly-cis-1,4-isoprene). Appl Environ Microbiol 70(12): 7388-7395. [DOI] [PMC free article] [PubMed] [Google Scholar]
- 7.Hiessl S., Bose D., Oetermann S., Eggers J., Pietruszka J. and Steinbuchel A.(2014). Latex clearing protein-an oxygenase cleaving poly(cis-1,4-isoprene) rubber at the cis double bonds. Appl Environ Microbiol 80(17): 5231-5240. [DOI] [PMC free article] [PubMed] [Google Scholar]
- 8.Röther W., Austen S., Birke J. and Jendrossek D.(2016). Cleavage of rubber by the latex clearing protein(Lcp) of Streptomyces sp. strain K30: Molecular insights . Appl Environ Microbiol 82(22): 6593-6602. [DOI] [PMC free article] [PubMed] [Google Scholar]
- 9.Schmitt G., Seiffert G., Kroneck P. M., Braaz R. and Jendrossek D.(2010). Spectroscopic properties of rubber oxygenase RoxA from Xanthomonas sp., a new type of dihaem dioxygenase . Microbiology 8): 2537-2548. [DOI] [PubMed] [Google Scholar]
- 10.Seidel J., Schmitt G., Hoffmann M., Jendrossek D. and Einsle O.(2013). Structure of the processive rubber oxygenase RoxA from Xanthomonas sp . Proc Natl Acad Sci U S A 110(34): 13833-13838. [DOI] [PMC free article] [PubMed] [Google Scholar]
- 11.Watcharakul S., Röther W., Birke J., Umsakul K., Hodgson B. and Jendrossek D.(2016). Biochemical and spectroscopic characterization of purified Latex Clearing Protein(Lcp) from newly isolated rubber degrading Rhodococcus rhodochrous strain RPK1 reveals novel properties of Lcp . BMC Microbiol 16: 92. [DOI] [PMC free article] [PubMed] [Google Scholar]


