Abstract
Nitrogen is an essential macronutrient for plant growth and nitrate content in plants can reflect the nitrogen supply of soil. Here, we provide the salicylic acid method to evaluate the nitrate content in plant tissues. The method is reliable and stable, thus it can be a good choice for measurement of nitrate in plant tissues.
Keywords: Nitrate content, Plant, Salicylic acid-sulphuric acid, NaOH, Standard curve, Boil, OD410
Background
Nitrogen is an important macronutrient required by plants for normal growth and development. Usually most plants absorb nitrogen mainly in the form of nitrate grown under aerobic conditions ( Xu et al., 2016 ). To determine the nitrate accumulation in plants, we need to test the nitrate content in different tissues of plants. There are some methods for determination of nitrate, for example, potentiometric method (Carlson and Keeney, 1971), phenoldisulfonic acid method (Bremner, 1965), Cadium reduction (Huffman and Barbarick, 1981) and other methods. These methods have some disadvantages, such as lower sensitivity, interferences, technician exposure to carcinogenic chemicals ( Cataldo et al., 1975 ; Vendrell and Zupancic, 1990)
Here, we provide the salicylic acid method that is free of interferences, reliable and stable. Nitrosalicylic acid is formed by the reaction of nitrate and salicylic acid under highly acidic conditions. The complex is yellow under basic (pH > 12) condition with maximal absorption at 410 nm. The absorbance is directly proportional to nitrate content. Therefore the nitrate content in tissues can be calculated based on their absorbances. This method is suitable for determination of nitrate concentration in plants.
Materials and Reagents
1.5 ml Eppendorf tubes
12-ml plastic culture tube (Greiner Bio One, catalog number: 184261)
Quartz cuvettes
Arabidopsis thaliana roots and/or shoots (7-day-old seedlings)
Potassium nitrate (KNO3) (Sinopharm Chemical Reagent, catalog number: 10017218)
Deionized water
MS medium
Liquid nitrogen
Salicylic acid (Sinopharm Chemical Reagent, catalog number: 30163517)
Sulphuric acid (98%) (Sinopharm Chemical Reagent, catalog number: 100216008)
Sodium hydroxide (NaOH) (Sinopharm Chemical Reagent, catalog number: 10019718)
500 mg/L (0.0357 mol/L) KNO3 standard solution (see Recipes)
5% (w/v) salicylic acid-sulphuric acid (see Recipes)
8% (w/v) NaOH solution (see Recipes)
Equipment
50 ml flask
Frozen mixed ball grinding machine (RETCH, model: MM400)
Visible light spectrophotometer (PGENERAL, catalog number: T6)
Centrifuge (Eppendorf, model: 5424)
Software
Excel
Procedure
-
Standard curve
To make the standard curve, 1 ml, 2 ml, 3 ml, 4 ml, 6 ml, 8 ml, 10 ml, and 12 ml NO3- standard solution (500 mg/L) is transferred to eight 50 ml flasks respectively, and deionized water is added to each solution to bring the total volume to 50 ml. The concentration of the series of standard solution should be 10, 20, 30, 40, 60, 80, 100, and 120 mg/L, respectively. And the molarity of 10, 20, 30, 40, 60, 80, 100, and 120 mg/L KNO3 is 0.0007, 0.0014, 0.0021, 0.0029, 0.0043, 0.0057, 0.0071, 0.0086 mol/L, respectively.
Transfer 0.1 ml of each standard solution into a 12-ml tube, respectively. Use 0.1 ml deionized water as a control.
Add 0.4 ml salicylic acid-sulphuric acid into each tube and mix well, and then incubate all reactions at room temperature for 20 min.
Add 9.5 ml of 8% (w/v) NaOH solution into each tube, cool down the tubes (heat is generated due to the reaction) to room temperature (about 20-30 min), and measure the OD410 value with the control for reference.
-
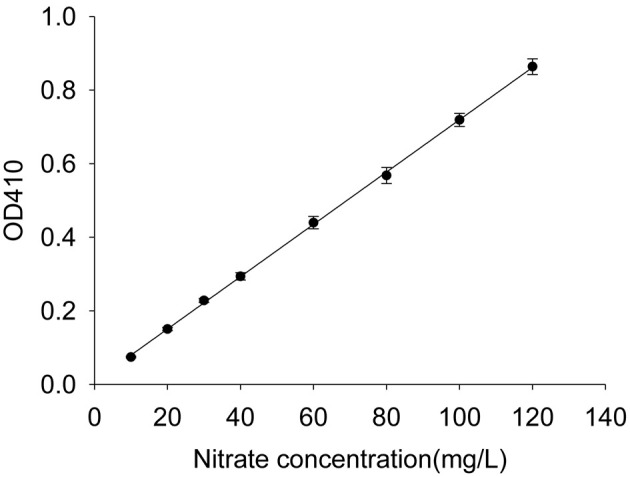
Plot the standard curve with the nitrate concentration as the horizontal axis and the absorbance as the vertical axis. Then, the regression equation can be obtained based on the standard curve (Figure 1). The detailed methods are as follows:
Open an Excel, enter the OD410 values in column A and the nitrate concentrations of the standard solutions in column B. Select all the cells containing values, and then insert a scatter plot.
Select any data point in the plot, right click, select to add a trend line, choose the linear and display equation, then standard curve and the regression equation are obtained.
-
Nitrate assay in Arabidopsis
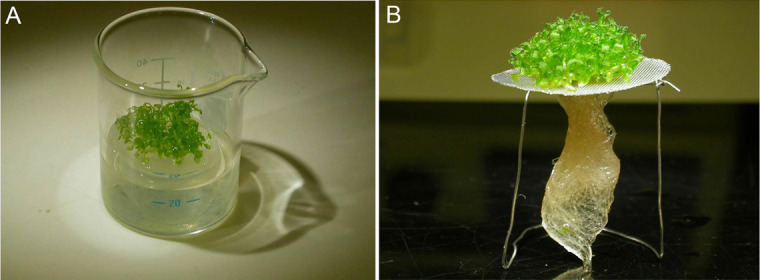
The seedlings are grown on half MS medium for 7 days (as shown in Figure 2), and the seedlings, shoots, and roots are collected separately for nitrate content determination.
Freeze each weighed sample (≤ 0.1 g, for example, about 20-25 7-day-old wildtype seedlings grown on half MS) in a 1.5-ml tube by liquid nitrogen, and grind each sample into powder with the frequency of 30/sec for 1 min using a RETCH MM400.
Add 1 ml deionized water into the tubes and boil at 100 °C for 20 min (at least).
Centrifuge the samples at 15,871 × g for 10 min, and transfer 0.1 ml supernatant into a new 12-ml tube. Use 0.1 ml deionized water as a control.
Add 0.4 ml salicylic acid-sulphuric acid into each tube, mix the sample well, and then incubate the reactions for 20 min at room temperature.
Add 9.5 ml of 8% (w/v) NaOH solution into each tube and cool down the tubes to room temperature (about 20-30 min). Measure the OD410 value of each sample with the control for reference.
According to the OD410 value obtained in the above step, calculate the nitrate concentration (C) with the regression equation, C (µg/ml) = 140.86 x OD410 - 1.1831 obtained in the Procedure A (Figure 1).
-
Calculate the nitrate content using the following equation:
Y = CV/W
Where,
Y: nitrate content (µg/g),
C: nitrate concentration calculated with OD410 into regression equation as step B7 (µg/ml),
V: the total volume of extracted sample (ml),
W: weight of sample (g).
Figure 1. Standard curve.

The 10, 20, 30, 40, 60, 80, 100, and 120 mg/L standard solutions are used to establish a standard curve. Error bars represent SD of biological replicates (n = 4). According to the standard curve, the regression equation is C (µg/ml) = 140.86 x OD410 - 1.1831, where C stands for nitrate concentration.
Figure 2. Hydroponic cultivation system for Arabidopsis seedlings.

A. Arabidopsis seeds are grown on a gauze net (250 microns mesh size) that has been sterilized by autoclaving. B. The gauze net is placed on a bracket. Make sure that the medium level in the beaker reaches to the gauze net.
Data analysis
Table 1. The nitrate content of the roots of WT.
Seedlings were grown on half MS medium for 7 days and the roots were collected for nitrate determination.
| Roots of WT | Fresh weight (g) | OD410 | C (μg/ml) | Nitrate content (μg/g) |
|---|---|---|---|---|
| 1 | 0.0734 | 0.331 | 45.44156 | 619.0948229 |
| 2 | 0.0971 | 0.438 | 60.51358 | 623.2088568 |
| 3 | 0.0902 | 0.42 | 57.9781 | 642.7727273 |
| 4 | 0.0752 | 0.347 | 47.69532 | 634.2462766 |
| Average | 629.8306709 |
Note: The other results of nitrate content in plant tissues were published in the paper of ‘The Arabidopsis NRG2 protein mediates nitrate signaling and interacts with and regulates key nitrate regulators’ (http://www.plantcell.org/content/28/2/485.long).
Notes
When collecting the seedlings, shoots, and roots, each sample should be harvested within one minute.
Each sample should have three replicates at least.
When adding salicylic acid-sulphate acid into the tube, the interval time between samples should be the same.
When boiling the samples, the boiling time is at least 20 min.
The cuvettes used for measuring the OD410 of the samples are quartz cuvettes.
Recipes
-
500 mg/L (0.0357 mol/L) KNO3 standard solution
0.7221 g KNO3 is dissolved in deionized water, and then add dH2O up to 200 ml
Store at 4 °C
-
5% (w/v) salicylic acid-sulphuric acid
5 g salicylic acid in 100 ml sulphuric acid
Protect from light, store at 4 °C and use within 7 days
-
8% (w/v) NaOH solution
80 g NaOH in 1 L distilled water
Store in a glass bottle with rubber stopper
Acknowledgments
This research was supported by NSFC grant (31170230) and Taishan Scholar Foundation to Y. W. This protocol was mainly based on the method of Cataldo et al. (1975) and Vendrell et al. (1990).
Citation
Readers should cite both the Bio-protocol article and the original research article where this protocol was used.
References
- 1.Bremner J. M.(1965). Methods of soil analysis. Part 2. In: Black, C. A.(Ed.). ASA pp: 1216-1219. [Google Scholar]
- 2.Carlson R. M. and Keeney D. R.(1971). Specific ion electrodes: Techniques and uses in soil, plant, and water analysis. In: Walsh, L. M.(Ed.). Instrumental Methods for Analysis of Soils and Plant Tissue. Soil Sci Soc Am pp: 39-65. [Google Scholar]
- 3.Cataldo D. A., Maroon M., Schrader L. E. and Youngs V. L.(1975). Rapid colorimetric determination of nitrate in plant-tissue by nitration a salicylic-acid. Commun Soil Sci Plan 6: 71-80. [Google Scholar]
- 4.Huffman S. A. and Barbarick K. A.(1981). Solid nitrate analysis by cadmium reduction. Comm Soil Sci Pl Anal 12:79-89. [Google Scholar]
- 5.Vendrell P. F. and Zupancic J.(1990). Determination of soil nitrate by transnitration of salicylic-acid. Commun Soil Sci Plan 21: 1705-1713. [Google Scholar]
- 6.Xu N., Wang R., Zhao L., Zhang C., Li Z., Lei Z., Liu F., Guan P., Chu Z., Crawford N. M. and Wang Y.(2016). The Arabidopsis NRG2 protein mediates nitrate signaling and interacts with and regulates key nitrate regulators . Plant Cell 28(2): 485-504. [DOI] [PMC free article] [PubMed] [Google Scholar]


