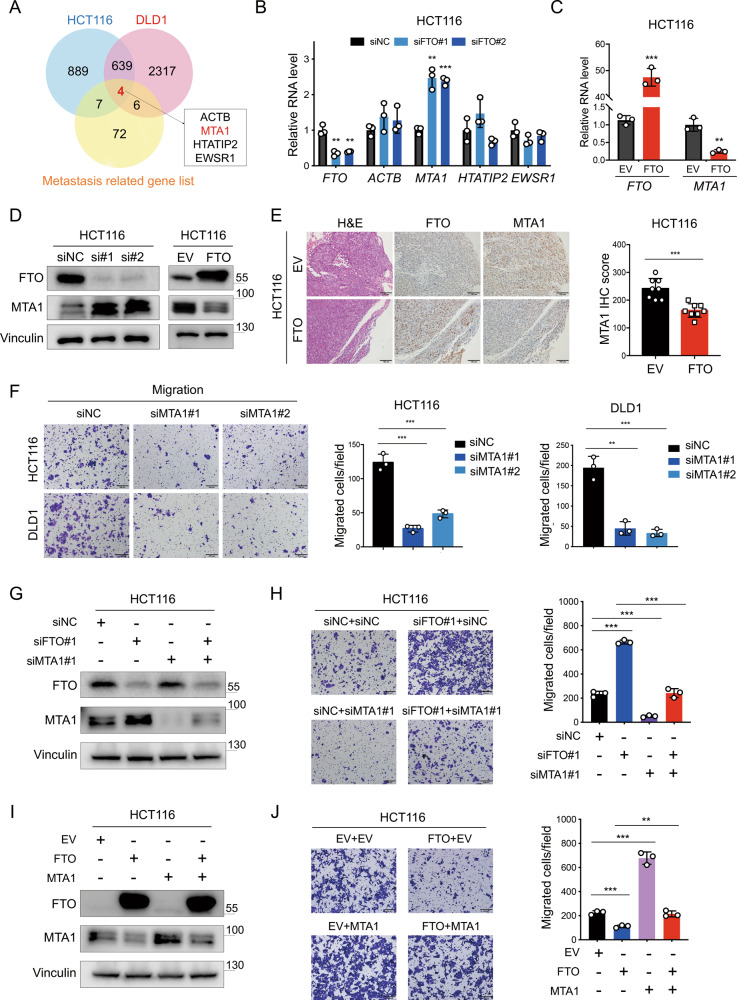
Fig. 4. MTA1 is a downstream target gene of FTO.
A Differentially expressed genes between FTO knockdown and normal control HCT116 and DLD1 cells (left) were identified by transcriptome sequencing. Venn diagram showing the overlap of significantly upregulated genes in FTO knockdown cells with a list of 84 human tumor metastasis-related genes [24, 25] and four downstream genes were screened. B RT-qPCR arrays were used to detect the RNA expression levels of FTO, ACTB, MTA1, HTATIP2, and EWSR1 after FTO knockdown in HCT116 cells, normalized to GAPDH. C MTA1 RNA expression levels were analyzed in FTO and EV HCT116 cells. D Immunoblot assay of MTA1 protein levels in HCT116 cells upon FTO knockdown and FTO overexpression. E Representative IHC images of H&E staining, FTO expression and MTA1 expression in FTO versus EV HCT116 induced tumor tissues (left). Scale bar: 100 μm. IHC scores of MTA1 expression in FTO versus EV group (n = 8 mice per group) compared by two-tailed Student’s t test (right). F The images (left) and quantification (right) of transwell migration assays of MTA1 knockdown (siMTA1#1, siMTA1#2) versus normal control (siNC) cells. Scale bar: 200 μm. G Immunoblot assay of FTO and MTA1 protein levels in siNC, siFTO#1, siMTA1#1, and siFTO#1 + siMTA1#1 HCT116 cells. H Images (left) and quantification (right) of migrated HCT116 cells with siNC+siNC, siFTO#1 + siNC, siNC + siMTA1#1, and siFTO#1 + siMTA1#1. I Immunoblotting assay of FTO and MTA1 protein levels in HCT116 cells with EV, FTO, MTA1 overexpression (MTA1) and FTO + MTA1. J The images (left) and quantification (right) of migrated HCT116 cells with EV + EV, FTO + EV, EV + MTA1 and FTO + MTA1. Scale bar: 200 μm. Data in (B, C, F, H, and J) are presented as the means ± S.D. (n = 3) *P < 0.05, **P < 0.01, ***P < 0.001 (Student’s t test).

