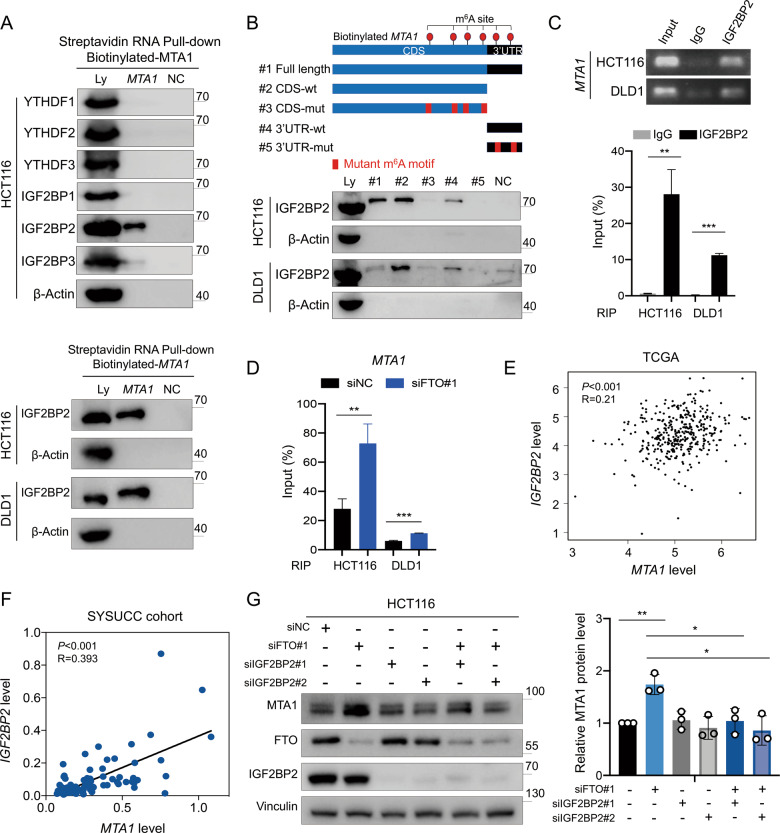
Fig. 6. IGF2BP2 specifically binds the MTA1 transcripts.
A RNA pulldown was performed with biotinylated MTA1. Immunoblotting of YTH family and IGF2BP family m6A readers in cell lysate (Ly), biotinylated full-length MTA1 and beads only (NC) in HCT116 cells (up). Immunoblotting of IGF2BP2 with lysate (Ly), biotinylated full-length MTA1 and beads only (NC) in HCT116 and DLD1 cells by RNA pulldown assay (down). B Immunoblotting of lysate (Ly), MTA1 full length (#1), MTA1 CDS region (#2), CDS m6A motif mutant MTA1 (#3), MTA1 3’UTR region (#4), 3’UTR m6A motif mutant MTA1 (#5) and beads only (NC) by RNA pulldown assay in HCT116 and DLD1 cells. C RIP assays showed the direct binding between IGF2BP2 protein and MTA1 mRNA in HCT116 and DLD1 cells. Agarose electrophoresis (up) and qPCR analysis (down). D RIP assays demonstrating the enrichment of IGF2BP2 protein bound MTA1 mRNA in siNC versus siFTO HCT116 and DLD1 cells. E The correlation between MTA1 and IGF2BP2 RNA expression levels in TCGA dataset for COAD and READ assessed by using the GEPIA online tool (http://gepia. cancer-pku.cn/). F The correlation between MTA1 and IGF2BP2 RNA levels in 78 CRC specimens from SYSUCC. G Immunoblotting assay of MTA1, FTO and IGF2BP2 protein levels in HCT116 cells with siNC, FTO knockdown only (siFTO#1), IGF2BP2 knockdown only (siIGF2BP2#1, siIGF2BP2#2) and both FTO and IGF2BP2 knockdown (siFTO#1 + siIGF2BP2#1, siFTO#1 + siIGF2BP2#2). Data in (C, D, and G) are presented as the mean ± SD (n = 3). *P < 0.05, **P < 0.01, ***P < 0.001 (Student’s t test).

