Abstract
Epidemiological studies show high comorbidity between different mental health problems, indicating that individuals with a diagnosis of one disorder are more likely to develop other mental health problems. Genetic studies reveal substantial sharing of genetic factors across mental health traits. However, mental health is also genetically correlated with socio-economic status (SES) and it is therefore important to investigate and disentangle the genetic relationship between mental health and SES. We used summary statistics from large genome-wide association studies (average N~160,000) to estimate the genetic overlap across nine psychiatric disorders and seven substance use traits and explored the genetic influence of three different indicators of SES. Using Genomic Structural Equation Modelling, we show significant changes in patterns of genetic correlations after partialling out SES-associated genetic variation. Our approach allows the separation of disease-specific genetic variation and genetic variation shared with SES, thereby improving our understanding of the genetic architecture of mental health.
Introduction
Substance abuse and psychiatric disorders pose major burdens on patients’ personal lives, that of their families, and on society as a whole1. Previous studies reported robust evidence of high comorbidity between different mental health disorders, indicating that individuals with a diagnosis of one disorder are more likely to develop other mental health problems. Genetic studies may provide useful information on the contribution of shared genetic risk factors to the observed comorbidities, which may give insights into shared underlying biology and pathology2,3. However, possible confounders such as socio-economic status (SES) may be correlated with genetic variation4, and genetic variants in turn have been implicated in SES. These should therefore be appropriately accounted for. Here, we assess the level of genetic overlap across 16 mental health traits, and explore the influence of SES-associated genetic variation on the pattern of shared heritability.
Twin and family studies have shown that genetic risk factors contribute substantially to the risk of developing a mental health disorder, with heritability estimates ranging between ~40–80%5–7. Twin studies have further revealed significant genetic correlations across disorders, implying that partly overlapping genetic influences underlie vulnerability to different mental health traits (e.g.8–11). To better understand the biological basis of mental health disorders and their comorbidity, it is important to identify the specific genes that underlie these disorders. Genome-Wide Association Studies (GWAS) have become the standard approach to detect common genetic risk variants (single nucleotide polymorphisms; SNPs) associated with psychiatric and substance use disorders and have been successfully applied to identify genetic loci for a wide variety of traits. More recent methodological innovations have enabled researchers to use genome-wide SNP effect sizes from GWAS to estimate the total proportion of phenotypic variation explained by all measured common genetic loci (SNP-based heritability) and to assess the amount of genetic overlap across disorders12,13. The Brainstorm Consortium used GWAS data to estimate genetic correlations (rg) across ten psychiatric disorders, revealing considerable sharing of common genetic risk2. Genetic correlations were especially profound between schizophrenia and bipolar disorder (rg=.68) and between major depression (MD) and anxiety disorder (rg=.79). Vink et al. extended this analysis to substance use phenotypes and showed large genetic overlap across psychiatric disorders and substance use phenotypes14. More recently, a study by the Psychiatric Genomics Consortium3 showed with GWAS data that eight main psychiatric disorders genetically cluster in three correlated latent factors: the first consisted primarily of disorders characterized by compulsive behaviours, the second by mood and psychotic disorders, and the third by early-onset neurodevelopmental disorders and major depression. A subsequent study that extended these analyses by including three substance use disorders showed that these mainly load on this third latent factor15.
A limitation of GWAS studies is that these are generally conducted within heterogeneous populations. Therefore, confounding factors, such as differences in environments, may bias genotype-phenotype associations and may therefore affect estimates of SNP-based heritabilities and genetic correlations. For example, recent studies have shown that genetic associations may be inflated by population phenomena, such as population stratification4,16, gene-environment correlation16,17, and assortative mating17. Abdellaoui et al. showed significant geographic clustering of complex traits, even after controlling for ancestry4. They hypothesized that recent migration driven by educational attainment is one of the main contributing factors for this clustering of complex traits. A consequence of this geographic clustering is that alleles that are associated with educational attainment are correlated with environmental influences on health outcomes. This could cause an inflation of genetic correlation estimates between traits. To explore potential influence of confounding factors at the family-level, Selzam et al. compared between-versus within-family genetic effects when using polygenic scores to predict various complex traits16. They found that estimates of genetic effects were significantly reduced within families compared to between families, suggesting that unaccounted confounding factors inflate the between-family results. Interestingly, after controlling for family SES, the inflation largely disappeared, suggesting that SES is a major source of bias. Similar effects likely cause polygenic scores for educational attainment to be twice as predictive in non-adopted children as in adopted children18. These results highlight that genotype-phenotype associations may be confounded by external variables, especially by those that reflect complex social phenomena such as educational level17 and SES.
Lower SES has been associated with increased levels of substance use and increased susceptibility for psychiatric disorders19,20. SES is often considered an environmental variable, but previous studies have shown that SES indicators have a substantial heritable component21. Twin studies have shown that 52% of the phenotypic variability in educational attainment is explained by genetic factors and GWAS have demonstrated that common genetic variants explain 11%, 21%, and 15% of the variance in household income, social deprivation and educational attainment, respectively21,22. Moreover, substantial genetic correlations between SES, substance use traits, and various psychiatric disorders have been found, with directions of effects in line with findings of traditional phenotypic epidemiology2,20,21,23. For example, ADHD, anxiety disorders, MDD, smoking, and Tourette syndrome show negative genetic correlations with intelligence and years of education whereas anorexia nervosa, autism spectrum disorders, and obsessive compulsive disorders show positive correlations. Marees et al. recently presented findings suggesting that the genetic relation between alcohol consumption measures and mental health traits is mediated by SES24. They found that a high frequency of alcohol consumption (genetically associated with high SES) showed genetic correlations with mental health traits that were the opposite of those for high quantity of alcohol consumption (genetically associated with low SES). For example, alcohol frequency showed a negative genetic correlation with depression while alcohol quantity was positively correlated with depression. We hypothesized that these differences were due to the fact that the two alcohol measures were correlated with SES in opposite directions but did not formally evaluate this premise. Overal, these studies suggest a strong genetic relation between mental health and SES which complicates the biological interpretation of estimates of shared genetic overlap.
In this study, we will test whether and to what extent SES-associated genetic variance influences genetic correlations across a range of mental health phenotypes, including nine psychiatric disorders and seven substance use phenotypes. SES represents an individual’s or family’s access to financial, social, cultural, and human capital resources, which are generally measured by educational attainment, occupational status, and household or family income25. In Great Britain, the authorities generally measure regional differences in SES with a composite of index variables called the Townsend Index (TI)26. We will use GWAS results of this latter indicator variable21, and two other main components of SES, namely educational attainment (EA)27 and household income (HI)21. First, we will explore the role of the three individual components separately. Next, we will use factor analysis to construct a latent variable that combines the three aspects of SES, because a factor that combines different indicators into a single composite may be a better indicator of SES28,29 and discard indicator variability that is not directly related to SES. For this, we will apply a recently developed multivariate method called genomic structural equation modelling (genomic SEM30), which enables estimation of the joint genetic architecture of multiple complex traits. Genomic SEM models the genetic covariance structure of complex traits using GWAS summary statistics and allows comparison of alternative multivariate genetic architectures. Using Genomic SEM, we can identify and partial out SES-associated genetic variation and separate this from the genetic variation that is not shared with SES. Separating these two sources of genetic variation will be relevant from a clinical perspective as the genetic risk that is more “unique” to a mental health disorder may provide insight into disease-specific mechanisms, while the genetic risk “shared” with SES will provide information on the contribution of general risk factors in a population.
We will investigate the impact of genetic SES variance on the SNP-based heritability of 16 indicators of mental health and on the pattern of genetic correlations across these traits. The specific aims of this study are to i) estimate genetic correlations between three different indicators of SES and a composite SES factor with mental health traits; ii) determine to what extent genetic variation associated with SES contributes to estimates of SNP-based heritability of the mental health traits; and iii) elucidate what proportion of the genetic correlations between the various mental health traits is due to genetic overlap with SES.
Methods
GWAS summary statistics
The current study used existing summary statistics for psychiatric disorders included in the recent Brainstorm Consortium report2, expanded with the GWAS for substance use traits and SES indicator variables. Detailed information about the GWAS summary statistics, sample sizes, and availability are provided in Supplementary Table 1. For psychiatric disorders, we used the case-control GWAS summary statistics for attention deficit/hyperactivity disorder (ADHD)31, anxiety/depression (AnxD)32, major depression (MD)33, bipolar disorder (BIP)34, schizophrenia (SCZ)35, autism spectrum disorder (ASD)36, obsessive-compulsive disorder (OCD)37, anorexia nervosa (AN)38, and Tourette’s syndrome (TS)39. In contrast to the Brainstorm Consortium report we excluded post-traumatic stress disorder, since this GWAS had a SNP-based heritability Z-score below our inclusion threshold of 240.
For substance use traits, we used GWAS results from lifetime cannabis use (Cannabis; ever versus never used cannabis)41, alcohol consumption frequency (AlcFreq)24, alcohol consumption quantity in subjects who drink at least once or twice a week (AlcQuan)24, ever initiated smoking (SmkInit)23, age of smoking initiation in ever-smokers only (SmkAge)23, cigarettes per day (CigDay)23, and successful smoking cessation in lifetime smokers only (SmkCes)23. Note that SmkCes was coded such that 1 indicates a person has not quit smoking, whereas 0 indicates that he or she quit smoking.
For SES indicator variables we selected the GWAS for educational attainment (EA)27, household income (HI)21, and Townsend index (TI)21. All summary statistics are available for download, freely or by request/application.
Genetic modelling
Modelling of the genetic variance of the traits and the covariance between traits was performed in Genomic SEM30 R package v0.0.2 (https://github.com/MichelNivard/GenomicSEM/wiki). The analyses were performed using 1,215,002 SNPs present in the HapMap 3 reference panel, with exclusion of the major histocompatibility complex (MHC) region on chromosome 6. Genomic SEM is robust to confounding due to population stratification, and against full or partial sample overlap and cryptic relatedness across GWAS samples.
First, we estimated the proportion of trait variance explained by common SNPs (SNP-based heritability) for all SES, psychiatric, and substance use traits. We compared genetic variance estimates of the 16 mental health traits from a model excluding SES (i.e. SNP-based heritability) with those obtained from a model in which genetic SES variance was partialled out. SES was defined as a latent SES factor composed of educational attainment, household income, or Townsend index, but we also explored the influence of these SES indicator traits in isolation.
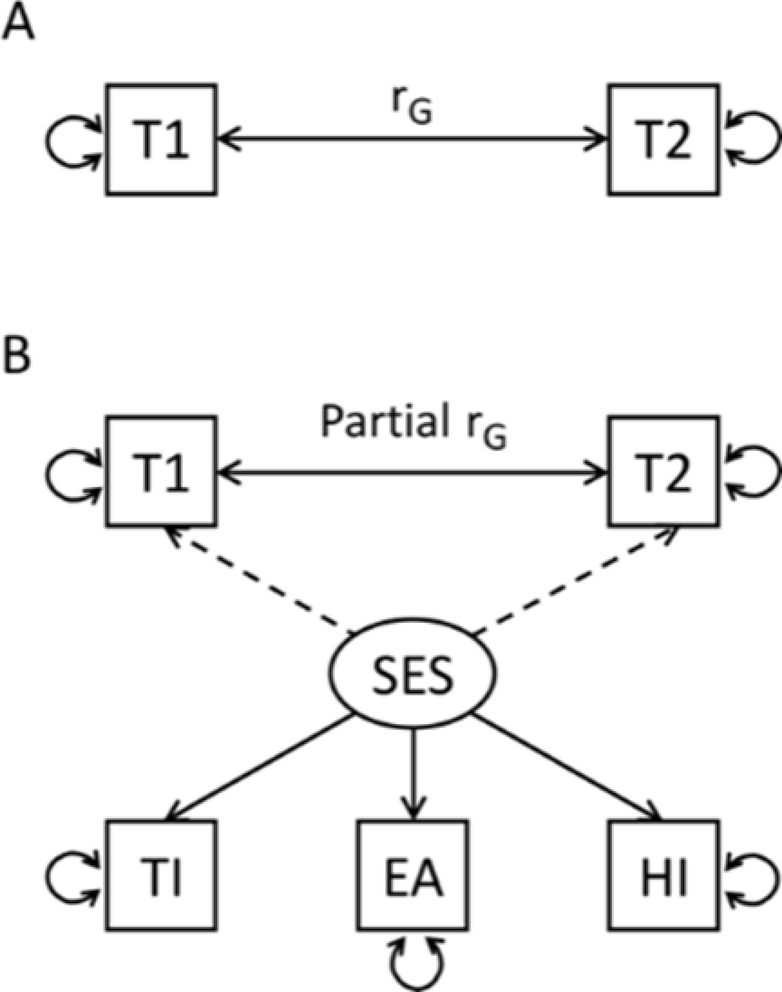
Secondly, we estimated the genetic correlations with and without the effects of the latent SES factor partialled out. The SEM models are represented in Figure 1. Each Genomic SEM model includes five traits: the two mental health traits and the latent SES factor which is represented by three SES indicator traits. We fit models for all possible combinations of the 16 mental health traits. Genomic SEM produces genetic covariance matrices using a multivariable extension of LD Score regression (LDSC) for all of the input variables in a model - in the current model a 5×5 matrix - with SNP-based heritability on the diagonal and genetic correlations off-diagonal. This multivariable genetic covariance matrix is entered into the structural equation modelling R-package lavaan 0.6–342. The SES residual model fitted a single latent common factor that represents the overlapping genetic variance between the three SES indicator traits, which has the advantage of excluding variable-specific variance (e.g., variance present in educational attainment but not present in the other SES indicator traits). The latent SES factor variance is then used to regress out variance from the observed genetic variance of the two mental health traits of interest. In other words, the model removes the effect of genetic SES variance on both SNP-based heritability of each of the two target traits and their genetic covariance. The three SES indicator traits were also tested separately for their effect on the pairwise genetic correlations in a simplified 3×3 model that did not construct a latent SES factor, but directly regressed the effect of an SES indicator trait from the two mental health traits in the model. In assessing whether a genetic correlation was significant, we used a Benjamini-Hochberg FDR correction to account for multiple testing: the 120 genetic correlations between all 16 mental health traits before partialling out genetic SES variance, and then for the 120 genetic correlations between all 16 mental health traits after partialling out the genetic SES variance, (i.e., applying the FDR outcome in five different sets of 120 p-values, the five sets being for the uncorrected genetic correlations and the genetic correlations corrected for EA, HI, TI, and the SES factor).
Figure 1.
Genomic SEM path model fitted on the genetic covariation matrices estimates the genetic correlation (solid bidirectional arrow) between two traits of interest 1 and 2 (T1, T2). (A) path model of the simple bivariate genetic correlation using LDSC. (B) The model including a latent SES factor which represents the shared genetic variation of SES indicator traits Townsend Index (TI), Educational Attainment (EA), and Household Income (HI) (solid directional arrows). The latent SES factors’ genetic variance is regressed out from the variance of T1 and T2 (dashed arrows) affecting the estimates for heritability and genetic correlation.
Significance of SES-induced change in genetic correlations
We used a Monte Carlo random sampling technique based on the model estimates and their variability to assess the significance of the effect of removing SES-associated genetic variance on the genetic overlap of pairs of traits, we used a Monte Carlo random sampling technique based on the model estimates and their variability. In Genomic SEM, variability of the estimates is obtained by jack-knifing across 200 equal sized chunks (leave-one-chunk-out) and re-estimating all free parameters in the model. Each jack-knife iteration results in a full symmetric (5×5) matrix with 15 free parameters representing the SNP-based heritabilities and genetic correlations of the two traits of interest and the three SES indicator traits. Based on these jack-knifed estimates, Genomic SEM provides a standard error (SE) for the 15 parameter estimates plus a term for the covariation between the estimates, resulting in a (15×15) matrix that captures not only parameter variance but also covariance, which can be substantial. Disregarding such correlated error would lead to substantially increased type-II errors. Using the matrix of estimates and the matrix of errors and error-covariances, we created 1000 samples using the mvrnorm function (MASS package in R43) from multivariate normal distributions of the estimates which followed the error-covariance structure. Each sampled matrix was used to recalculate SNP-based heritability and genetic correlation in the model with and without the SES factor. Significance was established by noting the change in estimates of genetic correlation, comparing estimates before and after SES factor inclusion across the 1000 models computed from the sampled data. We counted the number of times an estimate changed in the opposite direction as in the observed models (for example, if an rG was lower after including SES in the full, unsampled model, we counted the number of occasions in the 1000 sampled models that the inclusion caused an increase in rG). P-values were defined as this count divided by the 1000 samples, multiplied by two for two-sided testing (See the supplementary information for an extended explanation of the Monte Carlo sampling approach_.
The process was repeated for each of the SES indicator traits separately. Benjamini-Hochberg FDR was used to correct for multiple testing for the changes in 120 genetic correlations between all 16 mental health traits after partialling out the SES-factor (i.e., applying the FDR outcome in four different sets of 120 p-values, the four sets being for the change in genetic correlations after correcting for EA, HI, TI, and the SES factor).
Graph analysis of genetic correlation matrices
To establish the effect of SES on genetic clustering across substance use and psychiatric phenotypes, we used graph analysis on the squared genetic correlation matrices before and after removing the SES-associated genetic variance. R package iGraph (v1.2.4.1)44 was used to visualise the connectivity strength based on the proportion of variance explained (i.e. squared genetic correlation). Clusters were predefined as substance use traits (AlcFreq, AlcQuan, Cannabis, CigDay, SmkCes, SmkInit, AgeSmk) and psychiatric traits (ADHD, AN, AnxD, ASD, BIP, MD, OCD, SCZ, TS). The effect of removing SES genetic variance was established for the eigenvector centrality measure for each vertex. The effect on clustering was established by comparing intra- and inter-cluster connection strength (r-squared) for the predefined clusters (psychiatric and substance use). Finally, we assessed whether genetic clustering was increased using the fast greedy algorithm of Newman and Girvan45 without predefined clusters.
Results
The SNP-based heritability estimates for the latent SES factor, educational attainment, household income, and Townsend Index were 0.06 (SE=0.005), 0.09 (SE=0.002), 0.06 (SE=0.003), and 0.03 (SE=0.002), respectively. We found substantial genetic correlations between the three SES indicator variables: educational attainment-household income rg=0.86, SE=0.04, FDR adjusted p-value <0.001; educational attainment-Townsend Index rg=0.49, SE=0.03, FDR adjusted p-value <0.001; household income – Townsend Index rg=0.77, SE=0.05, FDR adjusted p-value <0.001. Also see Supplementary Tables 5 and 6.
Genetic correlations of SES with the mental health traits
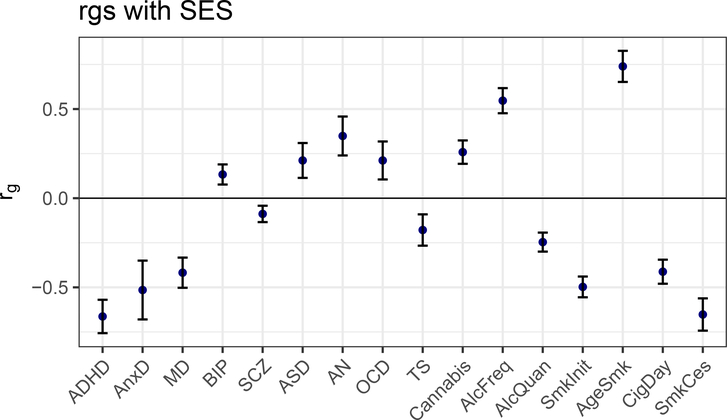
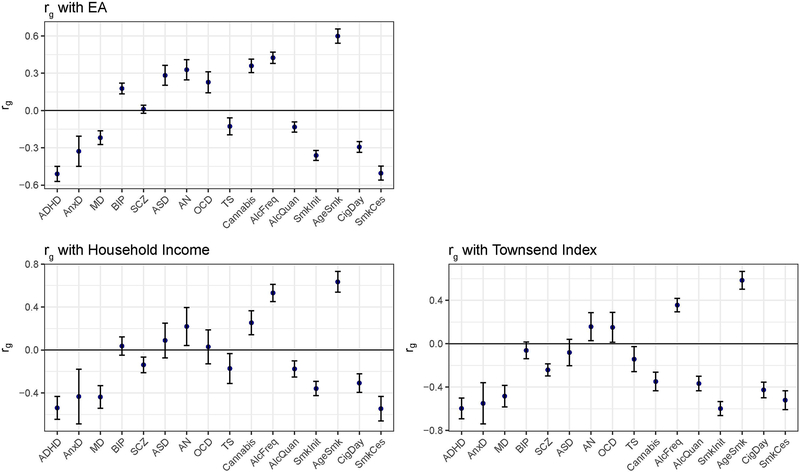
We show, based on the path model displayed in Figure 1, the genetic correlations between the latent SES factor with the 9 psychiatric disorders and 7 substance use traits in Figure 2 and Supplementary Table 1. All 16 traits showed significant genetic correlations with the latent SES factor, with negative correlations (N=9) being slightly more common than positive correlations (N=7). Substantial negative genetic correlations (rg < −0.4) of the latent SES factor were found with ADHD (rg=−0.663, SE=0.047, FDR adjusted p-value <0.001), anxiety disorder(rg=−0.515, SE=0.082, FDR adjusted p-value <0.001), major depression(rg=−0.418, SE=0.042, FDR adjusted p-value <0.001), smoking initiation (rg=−0.498, SE=0.029, FDR adjusted p-value <0.001; i.e., ever smoked cigarettes), cigarettes smoked per day (rg=−0.412, SE=0.034, FDR adjusted p-value <0.001), and smoking cessation (rg=−0.652, SE=0.045, FDR adjusted p-value <0.001), whereas substantial positive genetic associations (rg > 0.4) were found with frequency of alcohol consumption (rg=0.547, SE=0.035, FDR adjusted p-value <0.001) and age at smoking initiation (rg=0.739, SE=0.044, FDR adjusted p-value <0.001; i.e. genetic variants underlying younger age of smoking were associated with genetic variants for lower SES).
Figure 2:
Genetic correlations between the latent SES factor and 9 psychiatric disorders and 7 substance use traits as computed with LDSC (error bars show ± 2×SE).
Genetic correlations were also estimated with each of the individual SES indicator traits (i.e., household income, Townsend index, and educational attainment); results were very similar to those for the latent SES factor (Supplementary Table 2 and Extended Data Figure 1).
Attenuation of SNP-based heritability of mental health trait through SES
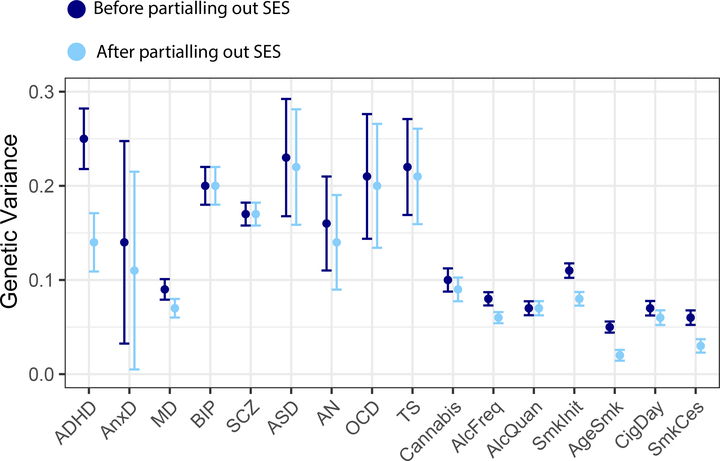
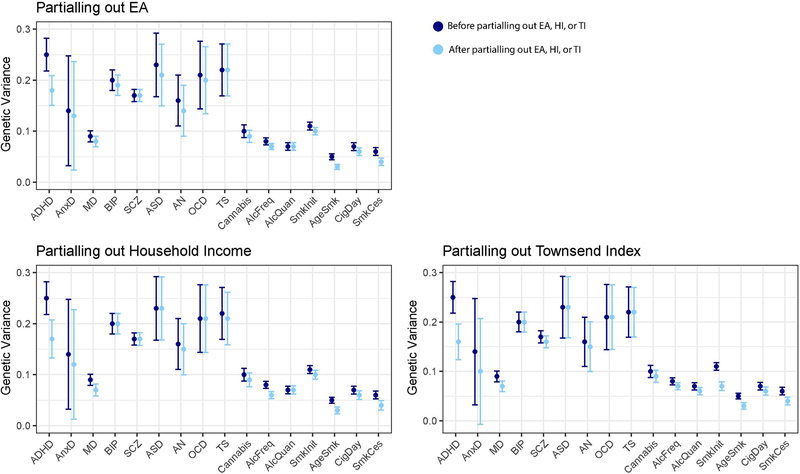
Figure 3 and Supplementary Table 3 show the SNP-based heritability estimates of the 16 mental health traits as well as the residual genetic variance after partialling out genetic effects that are shared with the latent SES factor. A reduction in genetic variance was most apparent for ADHD with attenuation of 43% after removing genetic SES variance. Genetic variance was also reduced for anxiety disorder, major depression, anorexia nervosa, frequency of alcohol consumption, smoking initiation, age at smoking initiation, and smoking cessation. The smallest reductions were observed for e.g. bipolar disorder, schizophrenia, and quantity of alcohol use.
Figure 3:
Genetic variance explained by SNPs before (SNP-based heritability) and after removing genetic effects overlapping with the latent SES factor (error bars show ± 2×SE).
Results were roughly similar when examining the effect of individual SES indicator traits on the SNP-based mental health trait heritabilities, although the attenuation of the heritability estimates was generally smaller (Supplementary Table 3 and Extended Data Figure 2).
Proportion of the genetic correlations between the mental health traits before and after removing SES-associated genetic variance
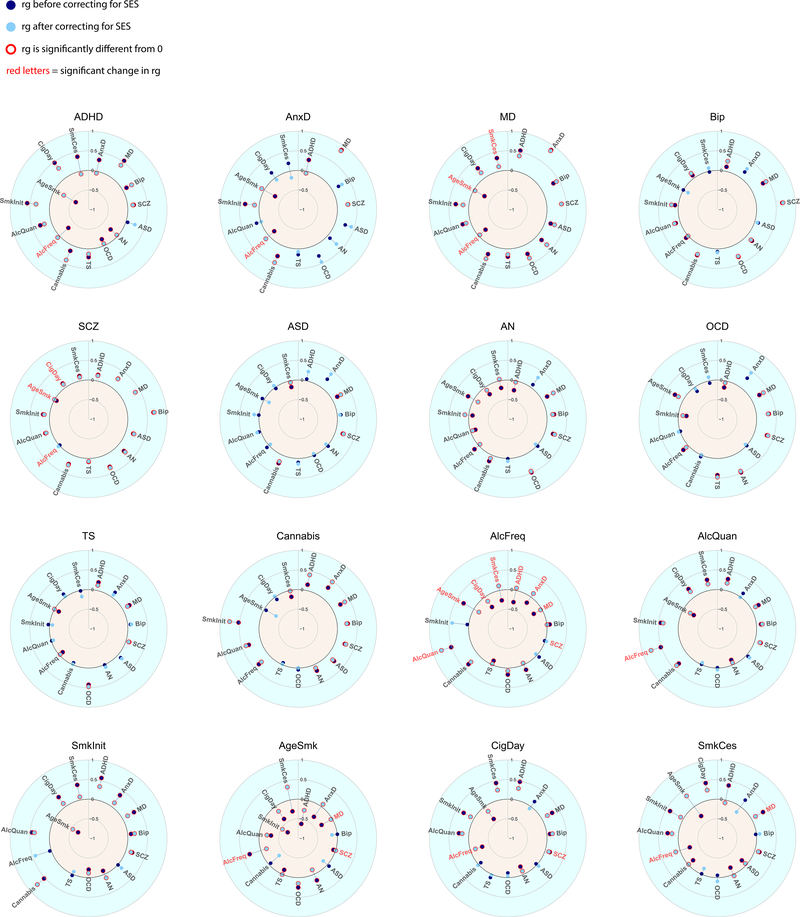
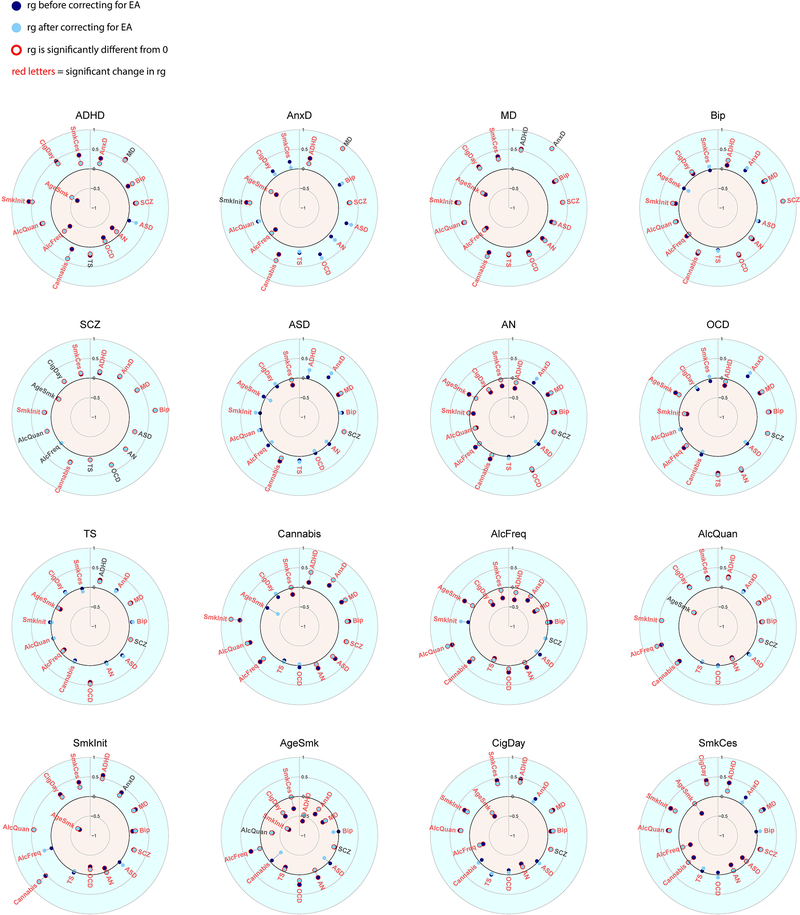
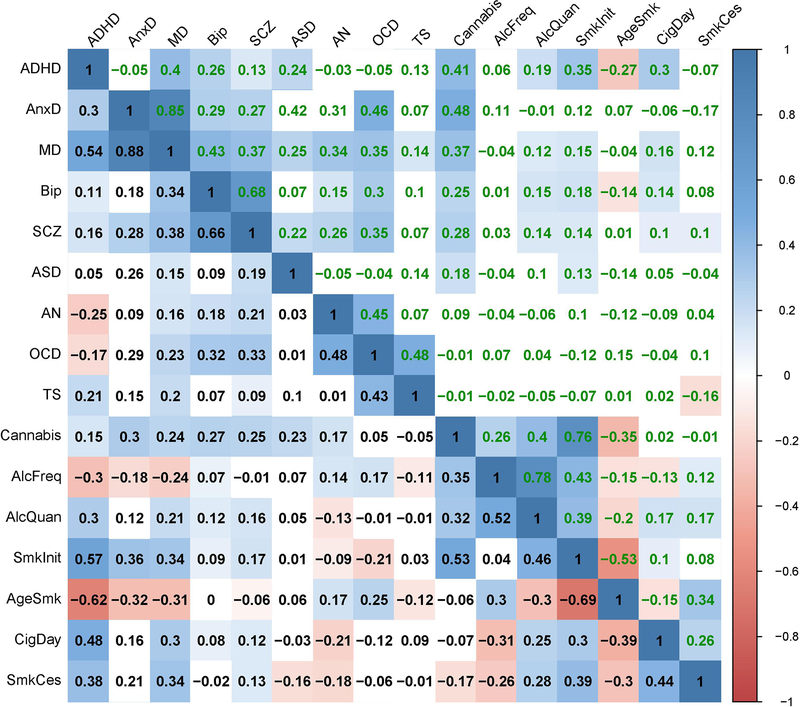
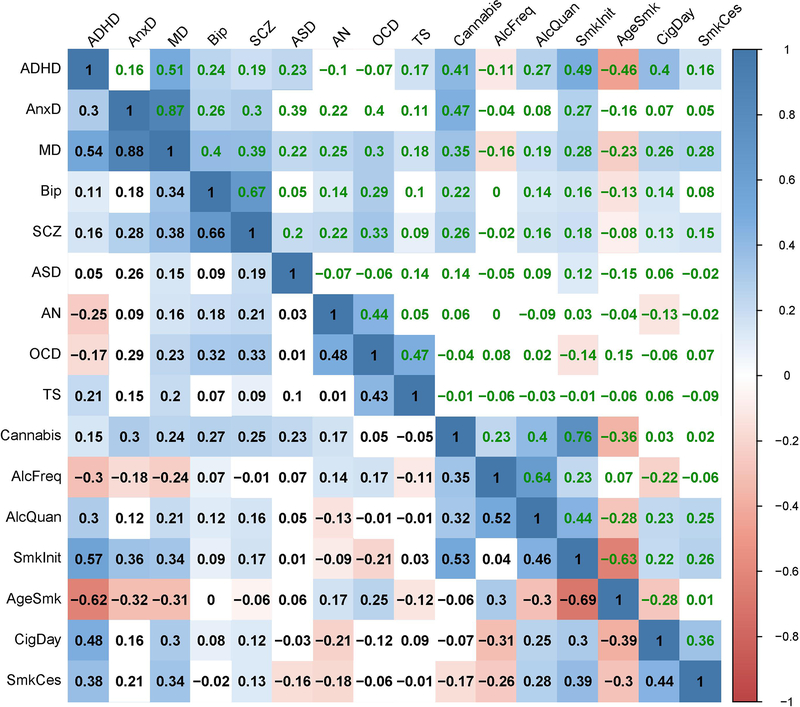
Figure 4 and Extended Data Figure 7 show genetic correlations between the mental health traits before and after removing genetic variance in common with the latent SES factor. The direction of change in genetic correlation is dependent on the direction of the genetic correlation between SES and the two traits: if both traits were genetically correlated with SES in the same direction (i.e. both positive or both negative), the genetic correlation between the traits decreased when partialling out the latent SES factor, whereas if the two traits showed genetic correlations with SES in opposite directions, the genetic correlation between the two traits increased. Exact estimates of the genetic correlations before and after partialling out the effects of SES can be found in Extended Data Figure 7, and Supplementary Table 4.
Figure 4:
Genetic correlations before and after partialling out the SES factor. Significant genetic correlations are indicated with red circles and significant changes in genetic correlations after partialling out SES are indicated in red letters.
Notably, genetic correlations were substantially weakened between ADHD and several substance use and psychiatric disorders, consistent with the strong reduction in SNP-based heritability of ADHD in Figure 3. Other changes include weakened genetic correlations between anxiety and several substance use outcomes (age at smoking initiation, smoking initiation, frequency of alcohol consumption), and a weakened genetic correlations between major depression and several substance use outcomes (smoking cessation, cigarettes per day, age at smoking initiation, smoking initiation, frequency of alcohol consumption). Finally, the genetic correlations between the different substance use outcomes generally showed large decreases. Changes in the pattern of genetic correlations were negligible, on the other hand, for bipolar disorder, schizophrenia, autism spectrum disorder, obsessive-compulsive disorder, and Tourette syndrome (although high statistical power that comes with some of the summary statistics resulted in statistically significant changes even when the changes in point estimates were minimal).
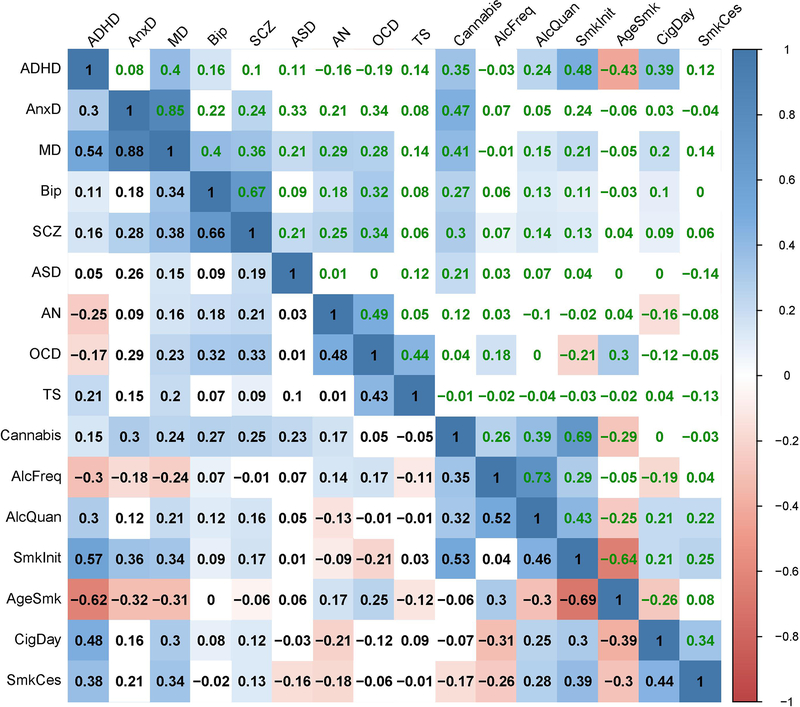
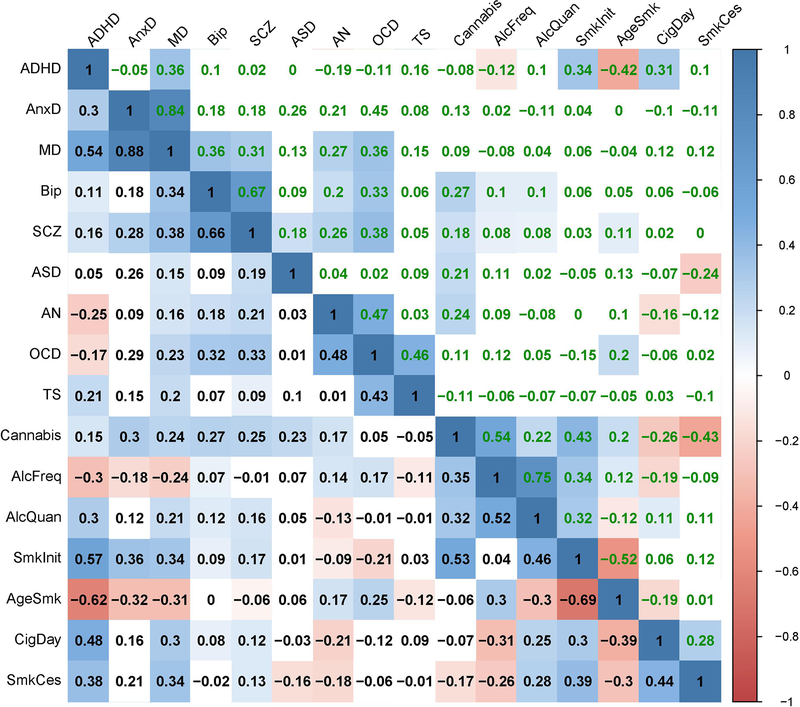
When examining the results of the effects of the individual SES indicator traits on the genetic correlations (Extended Data Figures 3–6 & 8–10, and Supplementary Table 4), the changes in genetic correlations between trait pairs are very similar for the different SES indicator traits. However, many more changes are significant after partialling out educational attainment than when removing the effects of household income, Townsend Index, or the latent SES factor.
Effect of SES on genetic clustering
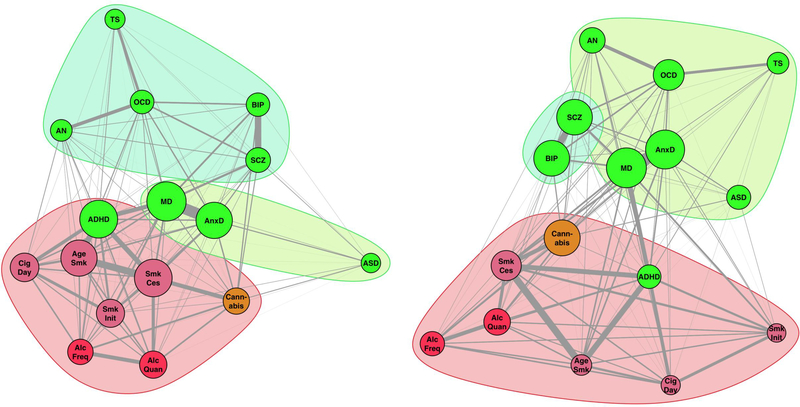
Figure 5 shows the genetic correlation clusters based on graph analyses of genetic variance explained before and after removing SES-associated genetic variation. The graphs show stronger clustering of the psychiatric disorders after SES genetic variance removal, compared to substance use traits. This was caused by strongly decreased edge weights (in terms of variance explained) between substance use traits (–0.062), a marginal decrease in edge weights between psychiatric traits (–0.010), and decreased edge weights across substance use and psychiatric traits (–0.023). These changes resulted in a clearer separation of the substance use and psychiatric cluster and stronger cohesion within the psychiatric cluster post-SES-removal (Figure 5 right). Using the Newman and Girvan (2004) clustering algorithm45, we observed and increased modularity Q (from 0.251 to 0.321). This algorithm separated one substance use cluster and two psychiatric clusters (but note that ADHD is a notable exception and is clustered with substance use traits), even after removing genetic SES variance. The two psychiatric clusters changed from (autism spectrum disorders, anxiety, major depression) and (anorexia nervosa, OCD, Tourette’s syndrome, schizophrenia, bipolar disorder) to (autism spectrum disorders, anxiety, major depression, anorexia nervosa, OCD, Tourette’s syndrome) and (schizophrenia, bipolar disorder).
Figure 5.
SNP-based genetic correlations between the mental health traits illustrated with a graph to reveal complex genetic relationships. Each vertex (node) represents a mental health trait, with green nodes representing psychiatric disorders and reddish nodes the substance use traits (red for alcohol, orange for cannabis, and lilac for smoking related traits). Vertex size is based on eigenvector centrality with a minimum offset. Weighted undirected graphs were created with the absolute genetic correlation as connection strength (represented in line thickness). Vertex layout was based on the Fruchterman and Reingold algorithm73. Left; Graph before removing genetic SES variance resulted in three clusters (Clustering coefficient Q=0.251). Right; Graph after removing genetic SES variance showed an increased clustering index (Q=0.321), reshaped psychiatric genetic clusters, and kept the substance use cluster intact (including ADHD).
Discussion
We have used the summary statistics from large-scale GWASs (average N ~160,000) to examine the extent to which genetic overlap with SES influences genetic variance in and genetic overlap across 16 mental health phenotypes. We show that removing the variance of the latent SES factor significantly changes the pattern of genetic relationships between mental health traits.
All 16 mental health traits showed a significant genetic correlation with a latent SES factor extending findings of previous studies2,14,23,41. Although the majority of the 16 genetic correlations between mental health traits and the latent SES factor were negative, in seven of the 16 genetic correlations the genetic propensity for lower SES was associated with an decreased genetic risk for psychiatric traits, namely for OCD, bipolar disorder, autism, anorexia nervosa, alcohol intake frequency, and cannabis use. Some of these positive genetic correlations are in line with the phenotypic correlations reported by epidemiological studies, such as the positive phenotypic correlations of SES with autism46 and anorexia nervosa47; studies have been less consistent about the direction of the relationship between bipolar disorder and OCD with SES48. The potential mechanisms behind these findings can be diverse, for example, the positive genetic correlation between educational attainment and cannabis use (rG= 0.36, SE=0.027, FDR adjusted p-value<0.001) could potentially be related to higher rates of cannabis use in metropolitan vs. rural areas49, supporting the previously reported association between lifetime cannabis use and higher childhood family SES50.
Our results showed attenuated SNP-based heritability estimates after controlling for SES, with the strongest effect observed for ADHD (43% attenuation). This observation is in line with the results of within-family GWAS that showed a reduction of genetic effects within families compared to between families16. For example, Selzam et al.16 reported that the polygenic risk score for ADHD is a significantly stronger predictor between families (beta=−0.18) than within families (beta=−0.06); this difference disappeared after controlling for SES. The significant genetic correlations between mental health and SES and the general reduction of genetic cross-trait correlations after removing genetic SES variance suggest that part of the heritability of mental health as well as the genetic overlap between the different mental health traits is due to shared genetic variation with SES. For pairs of traits with opposite directions in their genetic correlation with SES, an increase in genetic correlation was observed. For example, the genetic correlation between ADHD (rg with SES = −0.66, SE= 0.047, FDR adjusted p-value<0.001) and lifetime cannabis use (rg with SES = 0.26, SE=0.033, FDR adjusted p-value<0.001) was 0.15 (SE=0.044, FDR adjusted p-value=0.0012) and increased to 0.41 (SE=0.067, FDR adjusted p-value<0.001) after partialling out SES genetic variance supporting the previously reported link between externalizing disorders and substance use51. This shows that there are instances in which genetic overlap between traits is obscured by their shared genetic overlap with SES, highlighting the complex interdependence among these variables.
The relevance of our approach lies in the ability to compare patterns of genetic correlation before and after removing SES-associated genetic variation. For example, we previously reported that frequency and quantity of alcohol consumption are genetically correlated with SES in opposite directions and hypothesized that this may explain the different patterns of genetic correlations between the two alcohol measures and mental health traits24. Indeed, after removing genetic variance associated with SES, the genetic correlation between these two alcohol measures increased while the pattern of genetic correlations with other traits became much more similar. In the bivariate analyses that do not include the influence of SES, frequency of alcohol consumption was genetically associated with lower risk of ADHD, anxiety, and depression. However, after partialling out SES-associated genetic variation, the genetic correlations between frequency of alcohol consumption and these aspects of mental health were negligible. This suggests that the mental health benefits of moderate drinking may reflect SES confounding, that may reflect shared genetic architecture or gene-environment correlation (rGE), rather than direct causal effects of drinking behaviour.
Using graph analyses to investigate clustering of the mental health traits, we found three genetic clusters. Interestingly, ADHD clustered within the substance use category, rather than in one of the psychiatric clusters. After partialling out the SES genetic variation, ADHD remained in the substance use cluster. This indicates that some neurobiological causes of ADHD are shared with substance use traits above and beyond SES genetic variance—which includes the possibility of direct causal links. The results showed that genetic overlap among mental health traits partly depends on the overlap with genetic SES variation. This has consequences for conceptualizations of an underlying psychopathology factor (i.e., p-factor).3,30,52
While the strength of genetic association within the substance use cluster decreased on average after partialling out SES, the average strength of genetic association within the two psychiatric disorder clusters did not change substantially. Paradoxically, the substance use cluster remained largely intact while the psychiatric clusters changed in composition. This can be attributed to the fact that the effect of partialling out SES had relatively consistent effects on interrelations between substance use traits, whereas it had strong effects on some genetic associations within the psychiatric clusters (either becoming stronger or weaker) but not on others (also see Figure 4). This differential effect resulted in a reordering of the psychiatric disorders clusters. For traits that were highly affected by the partialling out of SES, in particular MDD and ADHD, their contribution to a shared psychopathology factor (see e.g. 3) must be reconsidered and its interpretation may be different when shared genetic architecture and spurious contributions from rGE, such as regional effects associated with SES4, are removed by partialling out SES genetic variance. Also, as some genetic associations between psychiatric disorders changed sign or increased in strength after partialling out SES genetic variance, our analyses show that confounding factors may obscure genetic overlap between traits.
There are different mechanisms that can explain why SES-associated genetic variation influences GWAS findings of mental health traits and the observed patterns of genetic correlations. If SES acts as a confounder, we see several mechanisms that could cause the effect of SES on mental health traits. First, SES is geographically clustered4, and is thus related to a wide range of detrimental environmental variables that may increase the risk for both physical and mental health problems as well as substance use. Living in disadvantaged neighbourhoods may place individuals at risk for substance use through increased availability and targeted marketing for alcohol products53,54. Adverse neighbourhood circumstances are also associated with increased risk of developing other psychiatric disorders55,56. It has been shown recently that a genetic predisposition for higher educational attainment is strongly associated with migration to better neighbourhoods with fewer exposures to harmful environmental influences4.
Second, a causal influence of SES on some mental health traits could also exist at a neurocognitive level, since lower cognitive abilities are correlated with lower educational attainment, lower income57,58, and lower impulse control59. The literature demonstrates that lower cognitive abilities and lower impulse control are correlated with both increased substance use and increased risk for psychiatric disorders59–61. Third, these findings may also partly reflect pleiotropy in which genetic variants influence the risk of mental health traits as well as SES through an underlying p-factor shared among substance use, psychiatric disorders, and lower SES52. Our current results provide information on the extent to which genetic correlations across mental health traits change after partialling out SES genetic variance, but do not allow us to separate between these alternative mechanistic explanations.
SES is usually considered a confounder in epidemiological research, warranting removal of its variability to investigate ‘true’ relations between variables. However, it is possible (and perhaps even likely) that SES sometimes acts as a collider, or shows bidirectional causal relations with mental health traits. For example, ADHD is known to affect educational performance and likely also HI62–64. In such cases, it is possible that the removal of SES variance biases the genetic correlation estimates. Nevertheless, the change in genetic correlations observed across our traits reveals that interpreting the genetic overlap at face value – as has been done in many cases2,3 – may be too simple. The fact that so many of the SNP heritabilities and genetic correlations were affected suggests that SES is a central and important factor, either as cause or as consequence. Unfortunately, we cannot disentangle causal direction with these results; however, our results set the stage for such modelling, pointing to SES as an unneglectable factor in psychiatric genetics research.
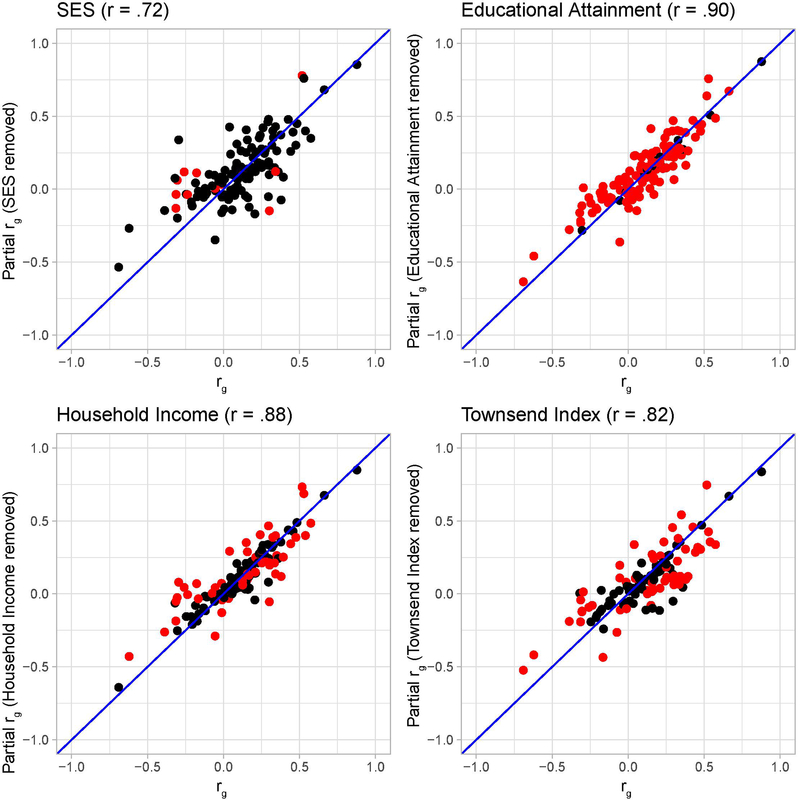
When considering the separate components used to derive the underlying SES factor, namely educational attainment, household income, and Townsend index, the strongest effects were observed for educational attainment. Nearly all genetic correlations were significantly altered after partialling out genetic variation associated with educational attainment (Extended Data Figure 6). This may be related to the strength of the signal of the educational attainment GWAS, which has a much larger sample size (N=766,345) than the other SES indicators (N=96,900 and N=112,005). However, it may also reflect the importance of educational attainment on life outcomes related to both SES and mental health65.
SES is an important factor to consider when interpreting the results of GWAS studies and post-GWAS analyses. Results of GWAS that are not controlled for SES-associated genetic variation may lead to biased estimates of trait-specific variance. The range of phenotypes for which this applies, is likely more extensive than those covered in the present study, e.g., complex traits such as BMI, longevity, and cardiovascular diseases, may be influenced in similar ways. Depending on the specific purpose of a genetic study, researchers may wish to consider partialling out SES-associated genetic variance thereby reducing SNP-based heritabilities for traits that are genetically linked to SES, so that the remaining genetic variance will be more trait-specific, and possibly more relevant from a clinical perspective.
Removing SES related genetic variance in genetic studies will also influence results of secondary analyses that use the GWAS summary statistics, such as Polygenic Risk Score (PRS) analyses66. Partialling out SES may reduce the predictive power of PRS analyses as it removes part of the genetic variance, but the remaining genetic variance may more specifically reflect the phenotype of interest, which would increase their potential clinical utility.
Our results also suggest a possible violation of an important assumption of Mendelian Randomization (MR) analyses. Mendelian Randomization uses germline genetic variants as an instrument for the exposure to an environmentally modifiable risk factor and can be used to investigate causality between traits67. Mendelian Randomization makes the important assumption that genetic variants included in the instrumental variable should be independent of factors (measured and unmeasured) that confound the exposure-outcome relationship17,68. SES is likely to be a confounder of MR analyses through its genetic associations with the genetic instruments for mental health phenotypes, which may affect results of MR studies aimed at establishing causal relationships across mental health traits, and other complex traits (e.g., BMI, longevity, and cardiovascular diseases). The results from our Genomic SEM analysis can be used to construct genetic instruments for mental health traits that control for the influence of SES allowing investigation of causal relations limiting the role of SES as a potential confounder. An alternative approach would be to conduct within-family MR analyses69,70.
Our findings have possible implications for the diagnostic boundaries across mental health disorders. It has previously been suggested that the observation of strong genetic correlations across psychiatric disorders suggests horizontal pleiotropy2, which would be indicative of a mismatch between current clinical boundaries and the underlying pathogenic processes. We show that the genetic comorbidity between mental health traits is more complex and that the genetic clustering of traits changes when partialling out genetic variance shared with SES.
Our findings need to be interpreted in the context of some limitations. First, SES is a multifactorial concept and there is no consensus in the field on how to best measure SES71. However, we used GWAS summary statistics to generate a latent SES factor composed of three indicators of SES, using both self-reported (educational attainment) and more objective measures (Townsend Index). We have further performed additional analyses to explore the influence of each of these individual indicators and found effects to be largely consistent. This provides an indication that our selection of SES indicators is not critical for the observed changes in genetic correlations and SNP-based heritability.
Second, as is the case for most genetic studies on mental health, the summary statistics in this study are based on samples with an overrepresentation of participants from Western, Educated, Industrialized, Rich, and Democratic (WEIRD) populations. This reduces the generalizability of our findings and future studies should be focused on exploring the relations between SES and mental health in other populations.
Finally, while Genomic SEM is much more flexible in including the effects of confounding factors in the Structural Equation Model, the nature of our data does not allow us to draw conclusions on the nature of the causal relationships between mental health phenotypes. It is therefore unknown whether SES acts as confounder or collider. As indicated above, the latter case will result in biased estimates.
Our findings reveal that SNP-based heritabilities of 16 mental health traits, and the genetic correlations between them, are influenced by genetic overlap with SES traits. Our findings suggest that the genetic overlap between substance use traits and psychiatric disorders2,23,41,72 is in part due to their shared genetic overlap with SES. These findings provide important insights into the complexity of these associations and highlight the need for considering the role of SES in future studies investigating the genetic basis of mental health traits.
Extended Data
Extended Data Fig. 1. Genetic correlations between SES indicators and 9 psychiatric disorders and 7 substance use traits as computed with LDSC (error bars show ± 2×SE).
Extended Data Fig. 2. Genetic variance explained by SNPs before (SNP-based heritability) and after removing genetic effects overlapping with the SES indicators (error bars show ± 2×SE).
Extended Data Fig. 3. Genetic correlations before and after partialling out educational attainment (EA).
Significant genetic correlations are indicated with red circles and significant changes in genetic correlations after partialling out EA are indicated in red letters.
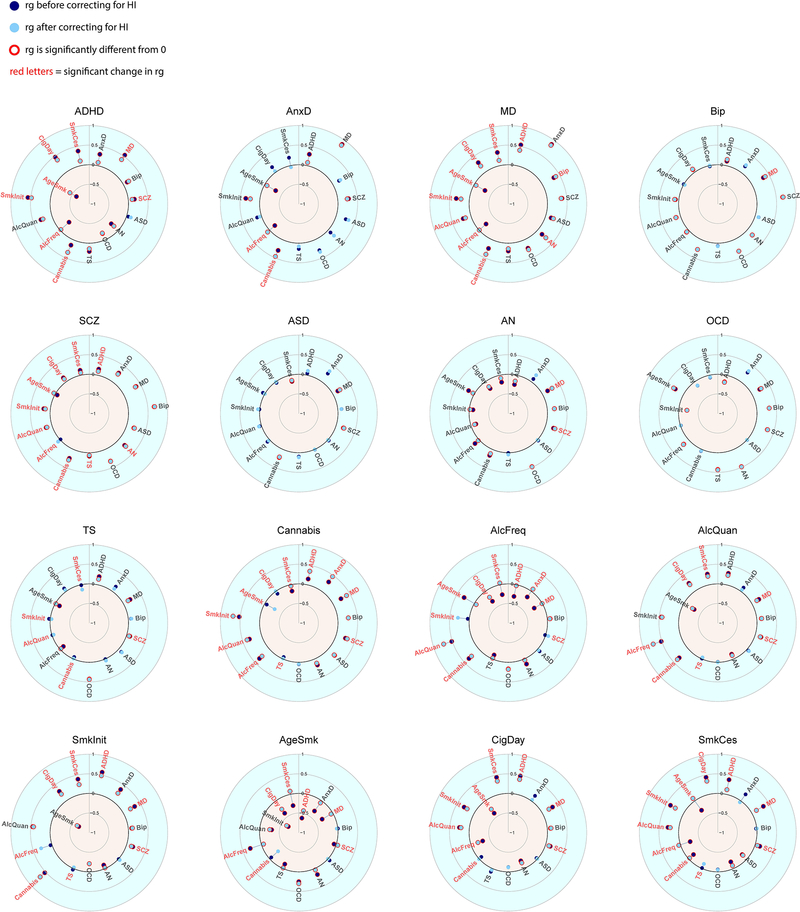
Extended Data Fig. 4. Genetic correlations before and after partialling out household income (HI).
Significant genetic correlations are indicated with red circles and significant changes in genetic correlations after partialling out HI are indicated in red letters.
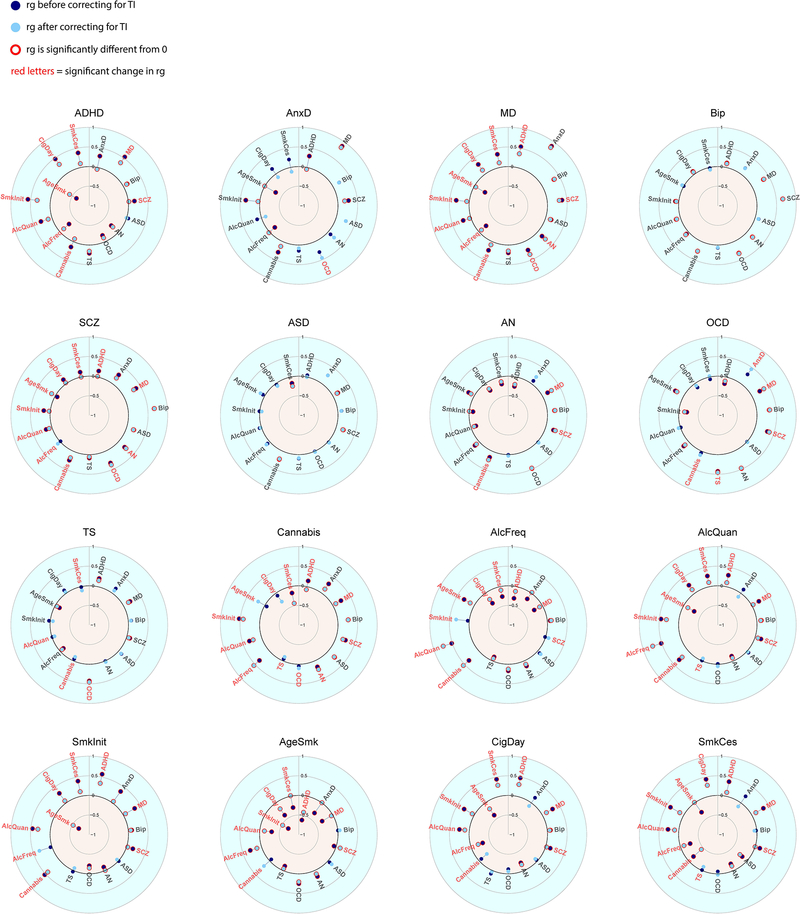
Extended Data Fig. 5. Genetic correlations before and after partialling out Townsend index (TI).
Significant genetic correlations are indicated with red circles and significant changes in genetic correlations after partialling out HI are indicated in red letters.
Extended Data Fig. 6. Genetic correlations before (x-axis) and after (y-axis) partialling out SES. Each dot represents one of the mental health or substance use traits.
Significant changes in genetic correlations after partialling out SES are indicated as red dots. The four correlations on top of the Figures are the Pearson correlations between the genetic correlations before and after partialling out the SES factors.
Extended Data Fig. 7. The genetic correlations before (lower diagonal, in black font) and after (upper diagonal, in green font) partialling out latent genetic SES factor variance.
Coloured squares indicate significant genetic correlations (FDR corrected, see methods).
Extended Data Fig. 8. The genetic correlations before (lower diagonal in black type) and after (upper diagonal in green type) partialling out genetic variance of educational attainment.
Coloured squares indicate significant genetic correlations (FDR corrected, see methods).
Extended Data Fig. 9. The genetic correlations before (lower diagonal in black type) and after (upper diagonal in green type) partialling out genetic variance of household income.
Coloured squares indicate significant genetic correlations (FDR corrected, see methods).
Extended Data Fig. 10. The genetic correlations before (lower diagonal in black type) and after (upper diagonal in green type) partialling out genetic variance of the Townsend index.
Coloured squares indicate significant genetic correlations (FDR corrected, see methods).
Supplementary Material
Acknowledgements
A.A., A.T.M., & K.J.H.V. are supported by the Foundation Volksbond Rotterdam. A.T.M. & T.J.G. are supported by the Netherlands Organization for Research (NWO) Vidi grant 0.16.Vidi.185.044. M.G.N. is supported by ZonMW grants 849200011 and 531003014 from The Netherlands Organisation for Health Research and Development. This research was supported by the National Institute on Aging, under grants RF1055654 and R56AG058726.
Footnotes
Competing interests
The authors declare no competing interests.
Code availability
Code used for the analyses is available on https://github.com/MareesAT/Genetic-correlates-of-socio-economic-status-influence-the-pattern-of-shared-heritability-across-ment.
Data availability
This research was conducted using data downloadable from: https://www.med.unc.edu/pgc/download-results/, https://www.ru.nl/bsi/research/group-pages/substance-use-addiction-food-saf/vm-saf/genetics/international-cannabis-consortium-icc/, https://www.thessgac.org/data, and https://www.ccace.ed.ac.uk/node/335. Summary statistics for the phenotypes ’alcohol consumption frequency’ and ‘alcohol consumption quantity’ are available from the corresponding authors on request.
References
- 1.Disease GBD, Injury I & Prevalence C Global, regional, and national incidence, prevalence, and years lived with disability for 328 diseases and injuries for 195 countries, 1990–2016: a systematic analysis for the Global Burden of Disease Study 2016. Lancet 390, 1211–1259, doi: 10.1016/S0140-6736(17)32154-2 (2017). [DOI] [PMC free article] [PubMed] [Google Scholar]
- 2.Brainstorm C et al. Analysis of shared heritability in common disorders of the brain. Science 360, doi: 10.1126/science.aap8757 (2018). [DOI] [PMC free article] [PubMed] [Google Scholar]
- 3.Cross-Disorder Group of the Psychiatric Genomics, C. Genomic Relationships, Novel Loci, and Pleiotropic Mechanisms across Eight Psychiatric Disorders. Cell 179, 1469–1482 e1411, doi: 10.1016/j.cell.2019.11.020 (2019). [DOI] [PMC free article] [PubMed] [Google Scholar]
- 4.Abdellaoui A et al. Genetic correlates of social stratification in Great Britain. Nat Hum Behav, doi: 10.1038/s41562-019-0757-5 (2019). [DOI] [PubMed] [Google Scholar]
- 5.Polderman TJC et al. Meta-analysis of the heritability of human traits based on fifty years of twin studies. Nature Genetics 47, 702–+, doi: 10.1038/ng.3285 (2015). [DOI] [PubMed] [Google Scholar]
- 6.Sullivan PF, Daly MJ & O’Donovan M Genetic architectures of psychiatric disorders: the emerging picture and its implications. Nature reviews. Genetics 13, 537–551, doi: 10.1038/nrg3240 (2012). [DOI] [PMC free article] [PubMed] [Google Scholar]
- 7.Boomsma D, Busjahn A & Peltonen L Classical twin studies and beyond. Nature reviews. Genetics 3, 872–882, doi: 10.1038/nrg932 (2002). [DOI] [PubMed] [Google Scholar]
- 8.Middeldorp CM, Cath DC, Van Dyck R & Boomsma DI The co-morbidity of anxiety and depression in the perspective of genetic epidemiology. A review of twin and family studies. Psychological medicine 35, 611–624, doi: 10.1017/s003329170400412x (2005). [DOI] [PubMed] [Google Scholar]
- 9.Kendler KS, Prescott CA, Myers J & Neale MC The structure of genetic and environmental risk factors for common psychiatric and substance use disorders in men and women. Archives of general psychiatry 60, 929–937, doi: 10.1001/archpsyc.60.9.929 (2003). [DOI] [PubMed] [Google Scholar]
- 10.Ystrom E, Reichborn-Kjennerud T, Neale MC & Kendler KS Genetic and environmental risk factors for illicit substance use and use disorders: Joint analysis of self and co-twin ratings. Behavior genetics 44, 1–13, doi: 10.1007/s10519-013-9626-6 (2014). [DOI] [PMC free article] [PubMed] [Google Scholar]
- 11.Derks EM, Vink JM, Willemsen G, van den Brink W & Boomsma DI Genetic and environmental influences on the relationship between adult ADHD symptoms and self-reported problem drinking in 6024 Dutch twins. Psychological medicine 44, 2673–2683, doi: 10.1017/S0033291714000361 (2014). [DOI] [PubMed] [Google Scholar]
- 12.Bulik-Sullivan BK et al. LD Score regression distinguishes confounding from polygenicity in genome-wide association studies. Nature genetics 47, 291–295, doi: 10.1038/ng.3211 (2015). [DOI] [PMC free article] [PubMed] [Google Scholar]
- 13.Bulik-Sullivan B et al. An atlas of genetic correlations across human diseases and traits. Nature genetics 47, 1236–1241, doi: 10.1038/ng.3406 (2015). [DOI] [PMC free article] [PubMed] [Google Scholar]
- 14.Vink J & Schellekens A Relating addiction and psychiatric disorders. Science 361, 1323–1324, doi: 10.1126/science.aav3928 (2018). [DOI] [PubMed] [Google Scholar]
- 15.Abdellaoui A, Smit DJA, Brink W. v. d., Denys D & Verweij KJH Genomic relationships across psychiatric disorders including substance use disorders. MedRxiv, doi: 10.1101/2020.06.08.20125732 (2020). [DOI] [PubMed] [Google Scholar]
- 16.Selzam S et al. Comparing Within- and Between-Family Polygenic Score Prediction. American journal of human genetics 105, 351–363, doi: 10.1016/j.ajhg.2019.06.006 (2019). [DOI] [PMC free article] [PubMed] [Google Scholar]
- 17.Morris TT, Davies NM, Hemani G & Smith GD Population phenomena inflate genetic associations of complex social traits. Sci Adv 6, eaay0328, doi: 10.1126/sciadv.aay0328 (2020). [DOI] [PMC free article] [PubMed] [Google Scholar]
- 18.Cheesman R et al. Comparison of Adopted and Nonadopted Individuals Reveals Gene-Environment Interplay for Education in the UK Biobank. Psychol Sci 31, 582–591, doi: 10.1177/0956797620904450 (2020). [DOI] [PMC free article] [PubMed] [Google Scholar]
- 19.Karriker-Jaffe KJ Neighborhood socioeconomic status and substance use by U.S. adults. Drug Alcohol Depen 133, 212–221, doi: 10.1016/j.drugalcdep.2013.04.033 (2013). [DOI] [PMC free article] [PubMed] [Google Scholar]
- 20.McLaughlin KA, Costello EJ, Leblanc W, Sampson NA & Kessler RC Socioeconomic Status and Adolescent Mental Disorders. Am J Public Health 102, 1742–1750, doi: 10.2105/Ajph.2011.300477 (2012). [DOI] [PMC free article] [PubMed] [Google Scholar]
- 21.Hill WD et al. Molecular Genetic Contributions to Social Deprivation and Household Income in UK Biobank. Curr Biol 26, 3083–3089, doi: 10.1016/j.cub.2016.09.035 (2016). [DOI] [PMC free article] [PubMed] [Google Scholar]
- 22.Cesarini D & Visscher PM Genetics and educational attainment. NPJ Sci Learn 2, 4, doi: 10.1038/s41539-017-0005-6 (2017). [DOI] [PMC free article] [PubMed] [Google Scholar]
- 23.Liu M et al. Association studies of up to 1.2 million individuals yield new insights into the genetic etiology of tobacco and alcohol use. Nature genetics, doi: 10.1038/s41588-018-0307-5 (2019). [DOI] [PMC free article] [PubMed] [Google Scholar]
- 24.Marees AT et al. Potential influence of socioeconomic status on genetic correlations between alcohol consumption measures and mental health. Psychological medicine, 1–15, doi: 10.1017/S0033291719000357 (2019). [DOI] [PMC free article] [PubMed] [Google Scholar]
- 25.Improving the measurement of socioeconomic status for the national assessment of educational progress: A theoretical foundation.
- 26.Townsend P, Phillimore P & Beattie A Health and Deprivation: Inequality and the North (1988).
- 27.Lee JJ et al. Gene discovery and polygenic prediction from a genome-wide association study of educational attainment in 1.1 million individuals. Nat Genet 50, 1112–+, doi: 10.1038/s41588-018-0147-3 (2018). [DOI] [PMC free article] [PubMed] [Google Scholar]
- 28.Trzaskowski M et al. Genetic influence on family socioeconomic status and children’s intelligence. Intelligence 42, 83–88, doi: 10.1016/j.intell.2013.11.002 (2014). [DOI] [PMC free article] [PubMed] [Google Scholar]
- 29.White KR The relation between socioeconomic status and academic achievement. Psychological Bulletin 91, 461–481 (1982). [Google Scholar]
- 30.Grotzinger AD et al. Genomic structural equation modelling provides insights into the multivariate genetic architecture of complex traits. Nat Hum Behav, doi: 10.1038/s41562-019-0566-x (2019). [DOI] [PMC free article] [PubMed] [Google Scholar]
- 31.Martin J et al. A Genetic Investigation of Sex Bias in the Prevalence of Attention-Deficit/Hyperactivity Disorder. Biol Psychiat 83, 1044–1053, doi: 10.1016/j.biopsych.2017.11.026 (2018). [DOI] [PMC free article] [PubMed] [Google Scholar]
- 32.Otowa T et al. Meta-analysis of genome-wide association studies of anxiety disorders. Mol Psychiatr 21, 1391–1399, doi: 10.1038/mp.2015.197 (2016). [DOI] [PMC free article] [PubMed] [Google Scholar]
- 33.Wray NR et al. Genome-wide association analyses identify 44 risk variants and refine the genetic architecture of major depression. Nature genetics 50, 668–681, doi: 10.1038/s41588-018-0090-3 (2018). [DOI] [PMC free article] [PubMed] [Google Scholar]
- 34.Sklar P Large-scale genome-wide association analysis of bipolar disorder identifies a new susceptibility locus near ODZ4 (vol 43, pg 977, 2011). Nat Genet 44, 1072–1072 (2012). [DOI] [PMC free article] [PubMed] [Google Scholar]
- 35.Ripke S et al. Biological insights from 108 schizophrenia-associated genetic loci. Nature 511, 421–+, doi: 10.1038/nature13595 (2014). [DOI] [PMC free article] [PubMed] [Google Scholar]
- 36.Grove J et al. Identification of common genetic risk variants for autism spectrum disorder. Nature genetics 51, 431–444, doi: 10.1038/s41588-019-0344-8 (2019). [DOI] [PMC free article] [PubMed] [Google Scholar]
- 37.International Obsessive Compulsive Disorder Foundation Genetics, C. & Studies, O. C. D. C. G. A. Revealing the complex genetic architecture of obsessive-compulsive disorder using meta-analysis. Molecular psychiatry, doi: 10.1038/mp.2017.154 (2017). [DOI] [PMC free article] [PubMed] [Google Scholar]
- 38.Watson HJ et al. Genome-wide association study identifies eight risk loci and implicates metabo-psychiatric origins for anorexia nervosa. Nature genetics 51, 1207–1214, doi: 10.1038/s41588-019-0439-2 (2019). [DOI] [PMC free article] [PubMed] [Google Scholar]
- 39.Yu D et al. Interrogating the Genetic Determinants of Tourette’s Syndrome and Other Tic Disorders Through Genome-Wide Association Studies. The American journal of psychiatry 176, 217–227, doi: 10.1176/appi.ajp.2018.18070857 (2019). [DOI] [PMC free article] [PubMed] [Google Scholar]
- 40.Watanabe K et al. A global overview of pleiotropy and genetic architecture in complex traits. Nature genetics 51, 1339–1348, doi: 10.1038/s41588-019-0481-0 (2019). [DOI] [PubMed] [Google Scholar]
- 41.Pasman JA et al. GWAS of lifetime cannabis use reveals new risk loci, genetic overlap with psychiatric traits, and a causal influence of schizophrenia. Nature Neuroscience 21, 1161–+, doi: 10.1038/s41593-018-0206-1 (2018). [DOI] [PMC free article] [PubMed] [Google Scholar]
- 42.Rosseel Y Lavaan: AnRPackage for Structural EquationModeling. Journal of Statistical Software 48 (2012). [Google Scholar]
- 43.Venables WN & Ripley BD Modern Applied Statistics with S, Fourth edition. (Springer, 2002). [Google Scholar]
- 44.Csardi G & Nepusz T The Igraph Software Package for Complex Network Research. Interjournal Complex Systems, 1695 (2006). [Google Scholar]
- 45.Newman MEJ & Girvan M Finding and evaluating community structure in networks. Physical review E69 (2004). [DOI] [PubMed] [Google Scholar]
- 46.King MD & Bearman PS Socioeconomic Status and the Increased Prevalence of Autism in California. Am Sociol Rev 76, 320–346, doi: 10.1177/0003122411399389 (2011). [DOI] [PMC free article] [PubMed] [Google Scholar]
- 47.Lindberg L & Hjern A Risk factors for anorexia nervosa: a national cohort study. Int J Eat Disord 34, 397–408, doi: 10.1002/eat.10221 (2003). [DOI] [PubMed] [Google Scholar]
- 48.Eid L et al. Bipolar disorder and socioeconomic status: what is the nature of this relationship? Int J Bipolar Disord 1, 9, doi: 10.1186/2194-7511-1-9 (2013). [DOI] [PMC free article] [PubMed] [Google Scholar]
- 49.Gfroerer JC, Larson SL & Colliver JD Drug use patterns and trends in rural communities. J Rural Health 23 Suppl, 10–15, doi: 10.1111/j.1748-0361.2007.00118.x (2007). [DOI] [PubMed] [Google Scholar]
- 50.Patrick ME, Wightman P, Schoeni RF & Schulenberg JE Socioeconomic status and substance use among young adults: a comparison across constructs and drugs. Journal of studies on alcohol and drugs 73, 772–782 (2012). [DOI] [PMC free article] [PubMed] [Google Scholar]
- 51.Krueger RF, Markon KE, Patrick CJ, Benning SD & Kramer MD Linking antisocial behavior, substance use, and personality: an integrative quantitative model of the adult externalizing spectrum. J Abnorm Psychol 116, 645–666, doi: 10.1037/0021-843X.116.4.645 (2007). [DOI] [PMC free article] [PubMed] [Google Scholar]
- 52.Caspi A & Moffitt TE All for One and One for All: Mental Disorders in One Dimension. American Journal of Psychiatry 175, 831–844, doi: 10.1176/appi.ajp.2018.17121383 (2018). [DOI] [PMC free article] [PubMed] [Google Scholar]
- 53.Jones-Webb R et al. Alcohol and malt liquor availability and promotion and homicide in inner cities. Subst Use Misuse 43, 159–177, doi: 10.1080/10826080701690557 (2008). [DOI] [PubMed] [Google Scholar]
- 54.Romley JA, Cohen D, Ringel J & Sturm R Alcohol and environmental justice: The density of liquor stores and bars in urban neighborhoods in the united states. Journal of studies on alcohol and drugs 68, 48–55, doi:DOI 10.15288/jsad.2007.68.48 (2007). [DOI] [PubMed] [Google Scholar]
- 55.Kim J Neighborhood disadvantage and mental health: The role of neighborhood disorder and social relationships. Soc Sci Res 39, 260–271, doi: 10.1016/j.ssresearch.2009.08.007 (2010). [DOI] [Google Scholar]
- 56.Patel V, Flisher AJ, Hetrick S & McGorry P Adolescent Health 3 - Mental health of young people: a global public-health challenge. Lancet 369, 1302–1313, doi: 10.1016/S0140-6736(07)60368-7 (2007). [DOI] [PubMed] [Google Scholar]
- 57.Deary IJ, Strand S, Smith P & Fernandes C Intelligence and educational achievement. Intelligence 35, 13–21, doi: 10.1016/j.intell.2006.02.001 (2007). [DOI] [Google Scholar]
- 58.Strenze T Intelligence and socioeconomic success: A meta-analytic review of longitudinal research. Intelligence 35, 401–426, doi: 10.1016/j.intell.2006.09.004 (2007). [DOI] [Google Scholar]
- 59.Chamorro J et al. Impulsivity in the general population: A national study. J Psychiatr Res 46, 994–1001, doi: 10.1016/j.jpsychires.2012.04.023 (2012). [DOI] [PMC free article] [PubMed] [Google Scholar]
- 60.Ersche KD, Turton AJ, Pradhan S, Bullmore ET & Robbins TW Drug Addiction Endophenotypes: Impulsive Versus Sensation-Seeking Personality Traits. Biol Psychiat 68, 770–773, doi: 10.1016/j.biopsych.2010.06.015 (2010). [DOI] [PMC free article] [PubMed] [Google Scholar]
- 61.Trivedi JK Cognitive deficits in psychiatric disorders: Current status. Indian J Psychiatry 48, 10–20, doi: 10.4103/0019-5545.31613 (2006). [DOI] [PMC free article] [PubMed] [Google Scholar]
- 62.Biederman J & Faraone SV The effects of attention-deficit/hyperactivity disorder on employment and household income. MedGenMed 8, 12 (2006). [PMC free article] [PubMed] [Google Scholar]
- 63.de Zeeuw EL, van Beijsterveldt CEM, Ehli EA, de Geus EJC & Boomsma DI Attention Deficit Hyperactivity Disorder Symptoms and Low Educational Achievement: Evidence Supporting A Causal Hypothesis. Behavior genetics 47, 278–289, doi: 10.1007/s10519-017-9836-4 (2017). [DOI] [PMC free article] [PubMed] [Google Scholar]
- 64.Dardani C et al. Is genetic liability to ADHD and ASD causally linked to educational attainment? BiorRxiv, doi: 10.1101/2020.02.11.944041 (2020). [DOI] [PMC free article] [PubMed] [Google Scholar]
- 65.Conti G, Heckman J & Urzua S The Education-Health Gradient. Am Econ Rev 100, 234–238, doi: 10.1257/aer.100.2.234 (2010). [DOI] [PMC free article] [PubMed] [Google Scholar]
- 66.Marees AT et al. A tutorial on conducting genome-wide association studies: Quality control and statistical analysis. International journal of methods in psychiatric research 27, e1608, doi: 10.1002/mpr.1608 (2018). [DOI] [PMC free article] [PubMed] [Google Scholar]
- 67.Lawlor DA, Harbord RM, Sterne JA, Timpson N & Davey Smith G Mendelian randomization: using genes as instruments for making causal inferences in epidemiology. Stat Med 27, 1133–1163, doi: 10.1002/sim.3034 (2008). [DOI] [PubMed] [Google Scholar]
- 68.Hemani G, Bowden J & Davey Smith G Evaluating the potential role of pleiotropy in Mendelian randomization studies. Human molecular genetics 27, R195–R208, doi: 10.1093/hmg/ddy163 (2018). [DOI] [PMC free article] [PubMed] [Google Scholar]
- 69.Liu C et al. Are there causal relationships between ADHD and BMI? Evidence from multiple genetically informed designs. MedRxiv, doi: 10.1101/2020.04.16.20067918v1.full.pdf (2020). [DOI]
- 70.Davies NM et al. Within family Mendelian randomization studies. Human molecular genetics 28, R170–R179, doi: 10.1093/hmg/ddz204 (2019). [DOI] [PubMed] [Google Scholar]
- 71.Farah MJ The Neuroscience of Socioeconomic Status: Correlates, Causes, and Consequences. Neuron 96, 56–71, doi: 10.1016/j.neuron.2017.08.034 (2017). [DOI] [PubMed] [Google Scholar]
- 72.Nivard MG et al. Connecting the dots, genome-wide association studies in substance use. Molecular Psychiatry 21, 733–735, doi: 10.1038/mp.2016.14 (2016). [DOI] [PubMed] [Google Scholar]
- 73.Fruchterman TMJ & Reingold EM Graph Drawing by Force-Directed Placement. Software- Practice and Experience 21, 1129–1164 (1991). [Google Scholar]
Associated Data
This section collects any data citations, data availability statements, or supplementary materials included in this article.
Supplementary Materials
Data Availability Statement
This research was conducted using data downloadable from: https://www.med.unc.edu/pgc/download-results/, https://www.ru.nl/bsi/research/group-pages/substance-use-addiction-food-saf/vm-saf/genetics/international-cannabis-consortium-icc/, https://www.thessgac.org/data, and https://www.ccace.ed.ac.uk/node/335. Summary statistics for the phenotypes ’alcohol consumption frequency’ and ‘alcohol consumption quantity’ are available from the corresponding authors on request.


