Abstract
Remarkably little is known about urethral striated and smooth muscle and vascular plexus contributions to maintaining continence or initiating micturition. We therefore developed a 3-D, multiphysics, finite element model, based on sequential MR images from a 23-year-old nulliparous heathy woman, to examine the effect of contracting one or more individual muscle layers on the urethral closure pressure (UCP). The lofted urethra turned out to be both curved and asymmetric. The model results led us to reject the current hypothesis that the striated and smooth muscles contribute equally to UCP. While a simulated contraction of the outer (circular) striated muscle increased closure pressure, a similar contraction of the large inner longitudinal smooth muscle both reduced closure pressure and shortened urethral length, suggesting a role in initiating micturition. When age-related atrophy of the posterior striated muscle was simulated, a reduced and asymmetric UCP distribution developed in the transverse plane. Lastly, a simple 2D axisymmetric model of the vascular plexus and lumen suggests arteriovenous pressure plays and important role in helping to maintain luminal closure in the proximal urethra and thereby functional urethral length. More work is needed to examine interindividual differences and validate such models in vivo.
Introduction
The female urethra has traditionally been modeled as a straight tube with pressure-flow relationships examined using the Bernoulli principle.2,9,25 Griffith employed Hooke’s law to study the relationship between pressure and radius of the female urethra during micturition.8 Kim et al. constructed one of the earliest 2D finite element (FE) models of the urethra within the pelvic floor complex using linear elements to investigate the causes of urine leakage during stressful events such as coughing, laughing or lifting a heavy object.17 Zhang et al. developed an idealized pelvic floor FE model and included urine as a “fluid-like media” and Eulerian elements to simulate urine leakage for the case of female athletes landing a jump.34 Finally, Spirka et al. developed a more realistic fluid-solid interactive model of the lower urinary tract system using an Arbitrary Lagrangian-Eulerian method.29 However, none of these methods employed anatomically accurate representations of the urethra or considered the role of the individual urethral muscle layers to the urethral closure pressure (UCP) that is widely accepted as the most important factor in maintaining continence.15
In the only experimental study to examine the contributions of the striated (STM) and smooth muscle layers and vascular plexus to UCP in women, Rud et al. examined five continent women during a radical hysterectomy to remove cervical cancer.26 They found the vascular plexus layer, striated and smooth muscle layers contributed almost equally to UCP. However, they were unable to separate the individual contributions of the longitudinal (LSM) and circular (CSM) smooth muscle layers with their experimental technique. This is an important question because the longitudinal smooth muscle is so much more prominent than the circular; a paradox for a sphincter, so those contributions remain unknown. To begin to understand their individual contributions, we developed a multiphysics finite element (FE) model to test the primary hypothesis, based on Rud’s findings, that the circular striated muscle and the smooth muscle contribute equally to the increase in UCP when contracted by the same amount.
Using a separate 2D axisymmetric multiphysics model, we also tested the secondary hypothesis that the difference between arteriovenous pressure of the vascular plexus and intravesical pressure contributes to closure of the proximal urethra and thereby functional urethral length.
In testing both hypotheses, we consider the six major urethral structures that comprise the urethra: the bladder neck region, the trigonal ring, the striated circular muscle, the circular smooth muscle, the longitudinal smooth muscle and the vascular plexus (Figure 1).
Figure 1.
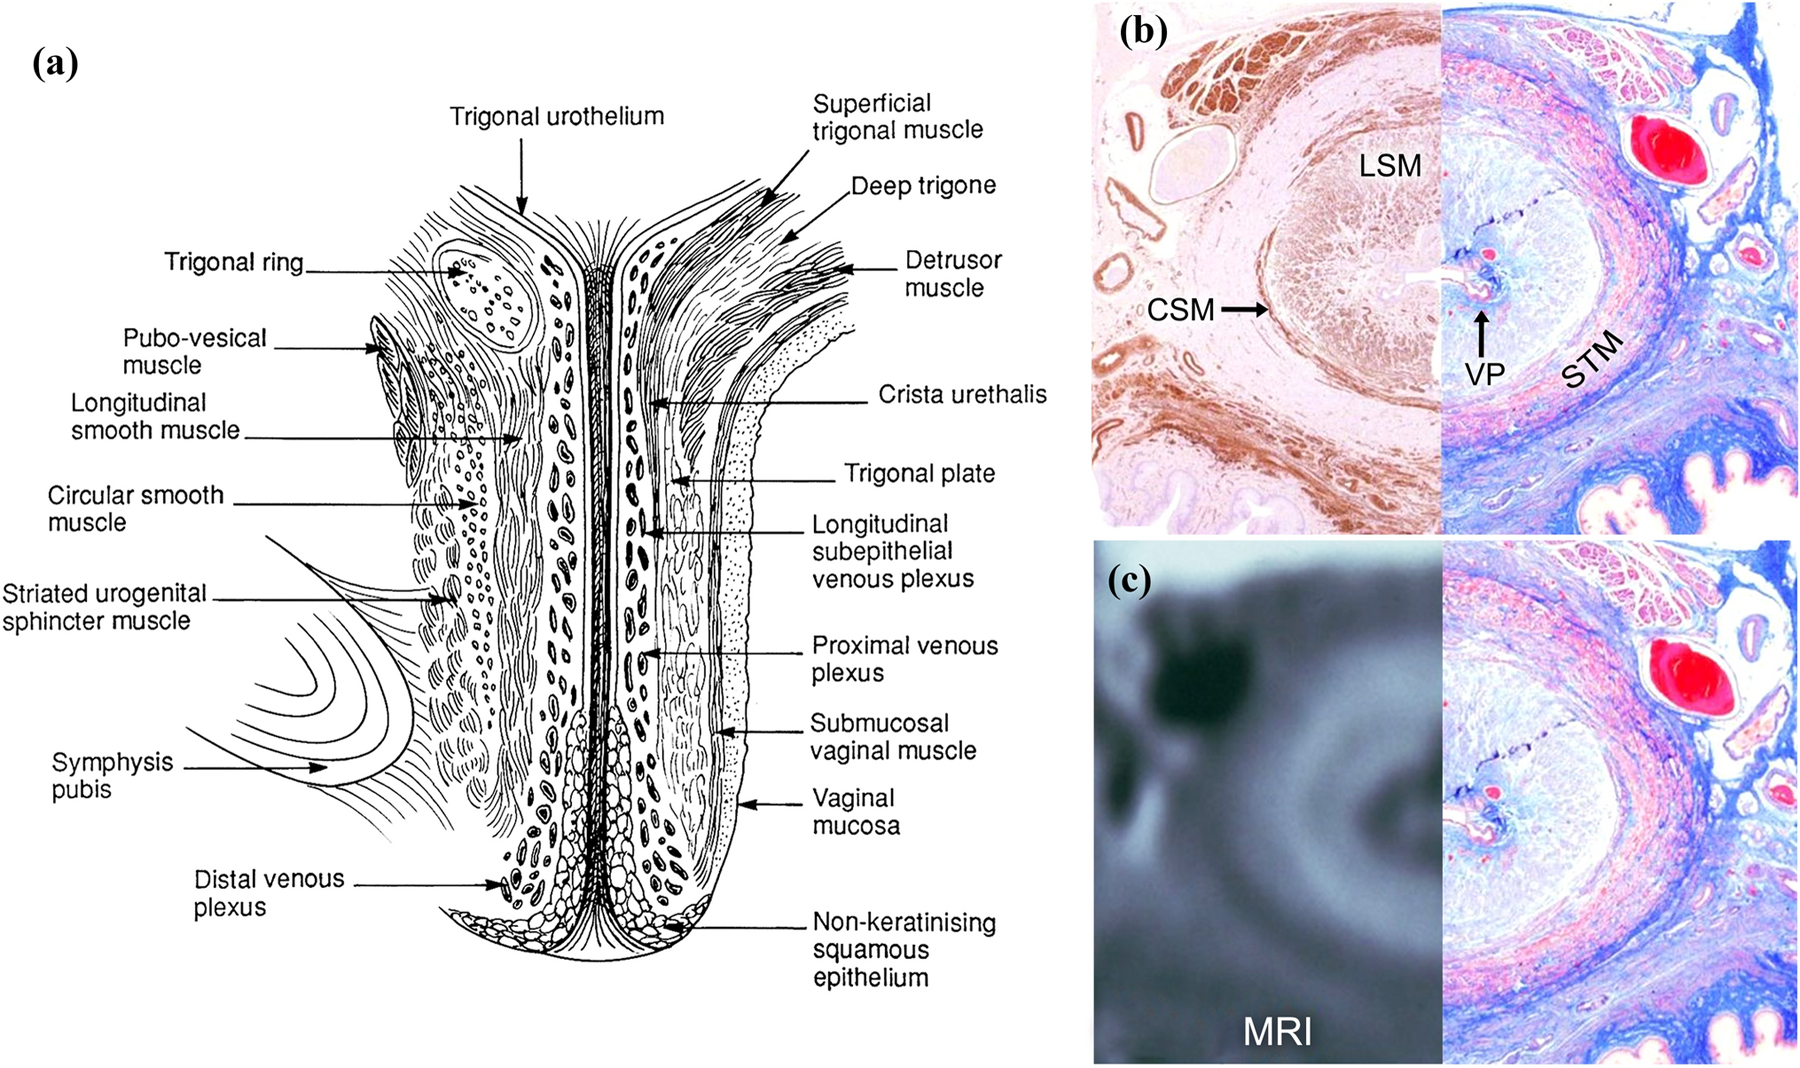
(a) Left view of an illustration of a mid-sagittal section through of a female urethra.30 (b, left) Axial mid-urethral actin immunoperoxide histologic section for smooth muscle and (b, right) mirrored trichrome histologic section. (c, left) Axial midurethral MRI with mirrored image of the corresponding trichrome-stained histologic section (c, right).
Two different FE models were developed and implemented in separate sections of this paper. In the first section, to test the primary hypothesis, the goal was to construct a 3D multiphysics FE model from MRI scan of a woman that had individual muscle layers that could contract, relax and apply closure pressure. Therefore, each muscle layer could deform the urethra and related connective tissues about a vascular core surrounding a rigid indwelling intraurethral catheter, large enough to express the blood from the core. This was because we assumed the diameter of a 7 Fr indwelling (2.3 mm) urodynamics catheter used to measure UCP typically exceeds that of the vascular plexus (see, for example1) and would completely empty the vascular plexus of blood.
To test the secondary hypothesis concerning the vascular plexus, a simple 2D axisymmetric fluid-solid interactive FE model of the proximal portion of the vascular plexus layer in the urethra was constructed.
Finally, the effect of aging on the urethra was explored using both of the above FE models. Studies have shown that the maximum urethral closure pressure (MUCP) decreases linearly with increasing age at an average of 15 cmH2O per decade.31 This significant reduction in the MUCP is rooted in dysfunction of urethral musculature when, for example, a posterior portion of the STM loses its contractility, in the vascular plexus when its effective pressure fails to rise effectively in a stress event, or in both structures.
Methods
I. On the Muscular Sphincter of the Urethra
a. 3D Geometry Construction
The overall 3D geometry of the urethra of a continent 23-year-old nulliparous healthy adult female was captured using a 3-Tesla Ingenia MRI scanner (Philips Medical Systems, Best, Netherlands) using a thin-slice (1 mm) proton density sequence. The study was approved by the University of Michigan Medical School Institutional Review Board (IRBMED) under protocol #HUM00132937. Layer identification were based on previous work comparing the MRI appearance of urethral layers with histologic sections of the same urethra.30 The 3D Slicer (V4.10.1) software package was used to loft and create early 3D domains. The model was then refined in SolidWorks® (Figure 2a–d) and imported into COMSOL® Multiphysics V5.4 (Burlington, MA, USA) for meshing and solving the FE equations.
Figure 2.
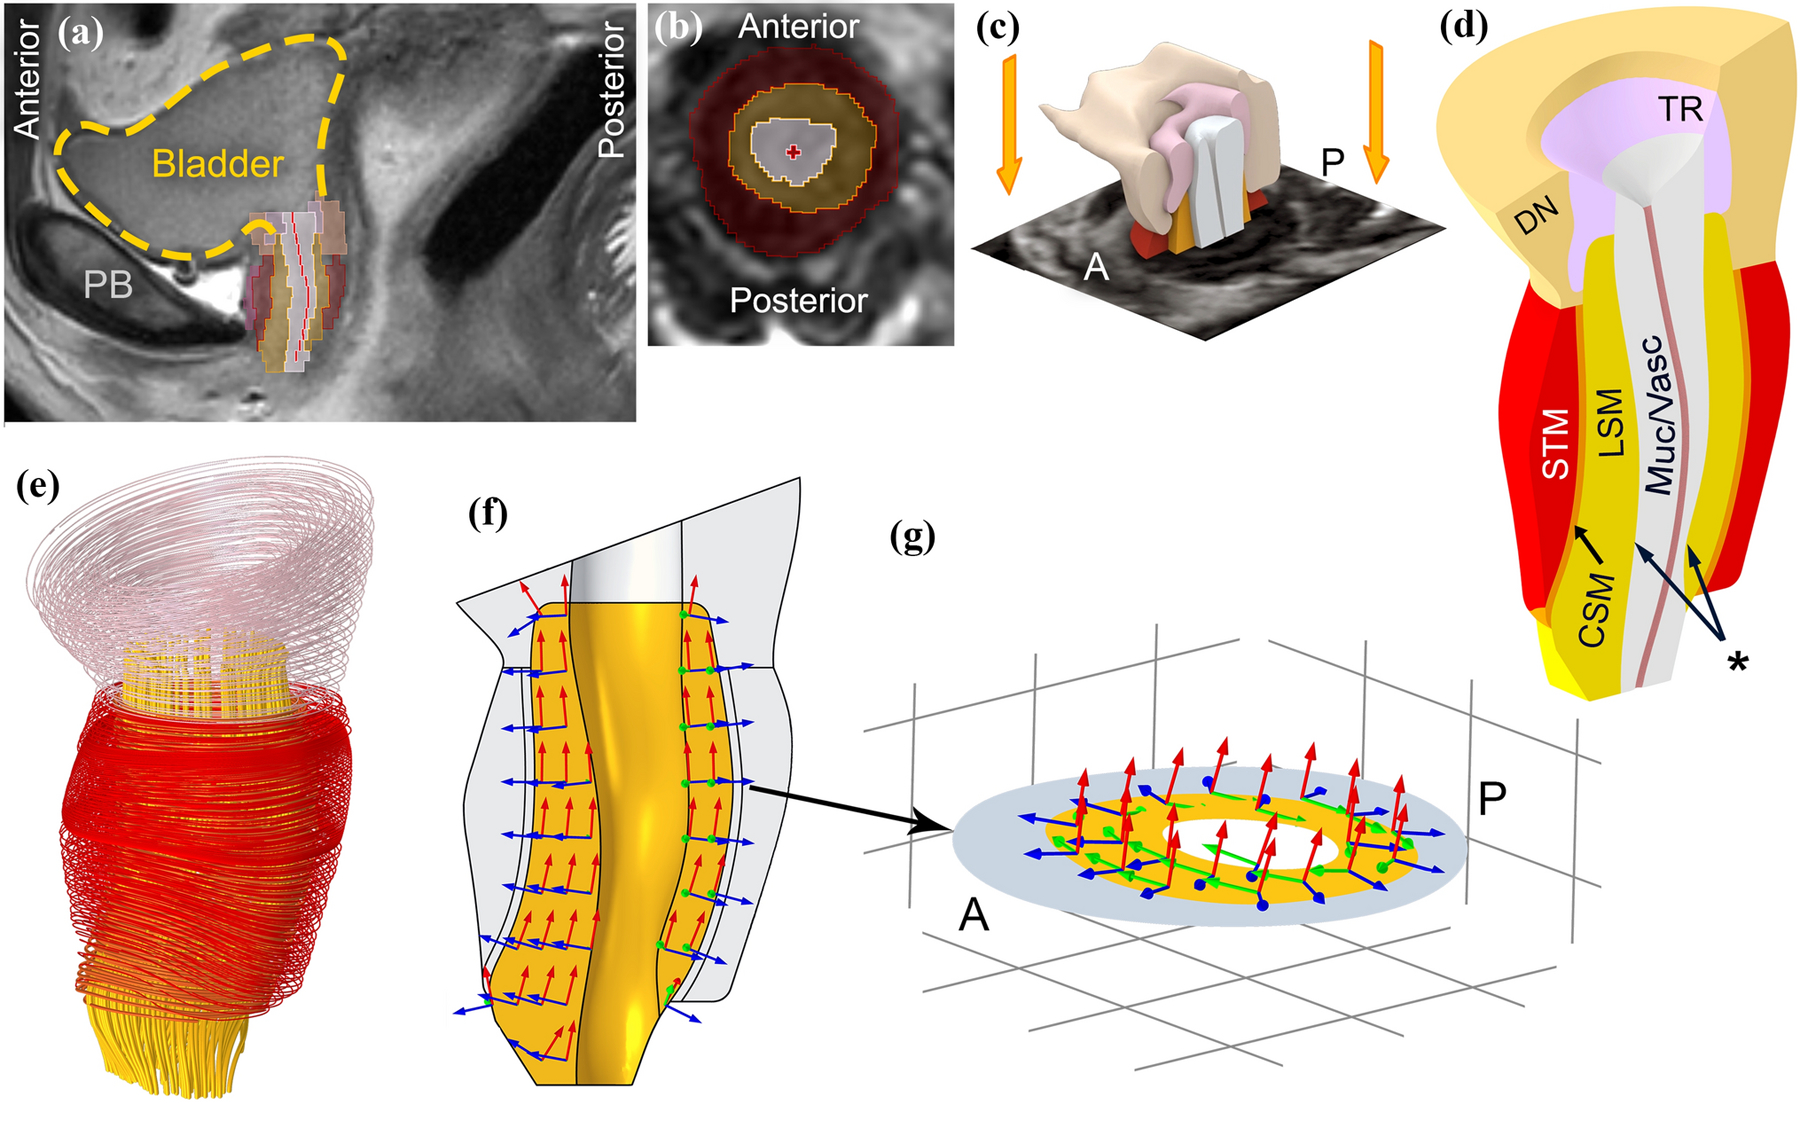
Construction of a 3D urethral model of a 23-year-old healthy female urethra taken in vivo from MR scans. (a) Mid-sagittal view with bladder outlined by yellow dashed spline (PB: pubic bone) and (b) a segmented axial view of the urethral sphincter. Dark red, yellow and gray regions show an axial cross section of the circular striated muscle, longitudinal smooth muscle and vascular plexus layers respectively. The bright red cross sign marks the center of the lumen. (c) The 3D model was constructed by lofting axial segmented MRI slices in 3D slicer. A: anterior and P: posterior. (d) The final refined 3D model; the segmented compressor urethrae is not shown in the 3D model and its active contraction is excluded from the simulations. STM: circular striated muscle, CSM: circular smooth muscle, LSM: longitudinal smooth muscle, Muc/Vasc: Vascular plexus and submucosa, DN: Detrusor Neck and TR: Trigonal Ring. Asterisk shows the inner surface of the LSM where the pressures in the quasi-radial direction were recorded by the imaginary intraurethral catheter. The innermost red spline is the coapted epithelium of the urethral lumen. (e) Muscle fibers (striated muscle) or line of action (smooth muscle) for each muscle domain. (f) Example of the curvilinear coordinate system for the LSM layer and (g) mid-axial cross section showing the curvilinear coordinate system in the LSM layer. In the simulations, LSM layer contracts along red axes (lines of action) and the pressures change is measured along blue axes (quasi-radial direction).
b. Curvilinear Coordinate System
In order to simulate the contraction of each urethral muscle layer along its striated muscle fiber or smooth muscle cell lines of action, domain-specific curvilinear coordinate systems (Figure 2e–g) were created via the diffusion method and matched with known histological data.6,22 The diffusion method we used differs from the well-known Diffusion Tensor Imaging (DTI) method:3 instead it was equivalent to solving the heat conduction equation on a domain that has two or more boundaries with different temperatures.19 The resulting temperature gradient forming the first base vector was used to create the curvilinear coordinate system.
Therefore, in these simulations, each urethral muscle layer was considered as an individual domain for which specific boundaries were selected as the source and the sink to calculate the temperature gradient and the corresponding mathematical field. The choice of the mentioned boundaries for the LSM was the very top and bottom boundaries, and for the circular muscle layers, it was the midsagittal cross-section of the muscle domains.
After creating individual mathematical field for each layer, the coordinate system of all elements was created such that the first basis vectors were aligned to the line of action of each smooth muscle layer (or the fiber direction in the case of the striated muscle) with the third basis vectors aligned to the quasi-radial direction. As a result, muscle contraction for all layers could be simulated most simply by applying external strains to the first basis vector of each layer, while the results were validated by measuring stresses or corresponding pressures in the quasi-radial direction (third basis vector). The pressure measurements in the quasi-radial direction corresponded to the translated pressure on an imaginary intraurethral catheter similar to those used clinically that was assumed large enough to completely empty the vascular plexus of blood, as most 6–8 Fr (2.0–2.7 mm diameter) catheters do (vide supra).
c. Muscle Contraction
As a first step towards a more complex muscle contraction model,13,20 a simpler approach was adopted.28 The stretch ratio λc was defined as the ratio of the contracted length Lc to slack length Ls, i.e., when the muscle was stimulated but unstressed (e.g., free boundary condition at one or both ends):
| (1) |
In the tissue mechanics FE simulation, λc would be the input to the problem in the form of external strain along the fiber direction or line of action. The total stretch ratio λ in the tissue would then be the resultant of contraction λc and mechanical λm stretch ratios, or the ratio of the current length (l) to the slack length (Ls):
| (2) |
Therefore, the mechanical stretch ratio λm is the passive deformation from the contracted state to the current state associated with the applied indirect stress from the adjacent muscle layers. The resulting total stretch ratio λ for each muscle, including the contracted muscle, was then calculated as an output.
d. Measuring the Pressure Change on the Indwelling Catheter
Since the contraction levels and the internal mechanical stresses of the urethral muscle layers are unknown at rest, the pressure “change” rather than the absolute pressure on the indwelling intraurethral catheter was calculated in the simulation. This enabled pressure measurement resulting from the muscle contraction to be calculated, independent of the periurethral pressure distribution, as the latter can change for example when the intra-abdominal pressure (IAP) changes in different postures and activities.
e. Tissue Models and Material Properties
Obtaining the true material properties of each layer of the human urethra in vivo was found to be challenging. Similar organs and tissues of similar shape and mixture of elastin and fibers, such as femoral arteries, lower esophageal sphincter, appendix and gallbladder were evaluated. As a starting point, the femoral arteries were selected and assumed to be similar to the arterial tissue. Therefore, the material properties of the femoral artery were used from the literature23 and constants of a 9-parameter Mooney-Rivlin hyperelastic constitutive model were used from that same literature.
f. Urethral FE problem setup
A union (or tie) boundary condition was defined for the internal shared interfaces of muscle layers. The anterior distal end of the longitudinal smooth muscle was chosen as a fixed boundary condition representing its attachment to the pubic bone. To consider the effect of periurethral tissues, the outside surface of the urethral wall was considered as a passive isotropic linear elastic foundation with the total stiffness of mesentery tissues.1 To study the interaction of the urethral muscles on UCP, the vascular plexus was not included because we assumed that a rigid 7 French catheter (~2.3 mm diameter) placed in the lumen during standard clinical testing would expel all blood from the vascular plexus and simply measure the UCP generated by the sphincteric muscles.
Additionally, in this scenario, instead of implementing contact physics between the imaginary inserted urodynamic catheter and the urethral lumen, an elemental roller boundary condition was defined to simplify the model and reduce the computational time. Whenever the simulation resulted in negative pressure recordings on the catheter, i.e., dilation of the urethra, the roller constraint was then replaced by a free boundary condition on the inner surface of the longitudinal smooth muscle.
The example urethra shown earlier was then meshed with about 55,000 tetrahedral quadratic serendipity elements, and the FE model was simulated using the parallel direct solver (PARDISO) in COMSOL®. It was assumed that the contraction happened quasi-statically, so a stationary parametric analysis was performed instead of a time-dependent analysis.
Finally, to simulate the effect of advancing age on the striated muscle (STM), since the dorsal 70° segment of the STM has been shown to consist of passive tissues incapable of contracting,22 the external strain was only applied to the lateral and ventral regions (i.e., a ‘horseshoe’ shaped region seen in a transverse plane section) in the simulation. The simulation result considering this assumption was then compared with the case where the entire STM was actively contracting in order to elucidate the effect of the passive tissue presence in the region where posterior STM had been in the younger model.
II. On the Role of the Vascular Plexus in Sealing the Urethral Lumen (in the Absence of an Indwelling Catheter)
The vascular plexus is a blood-filled cavity interposed between the urethral lumen and the longitudinal smooth muscle layer. It is inflated by arterial pressure with a pressure in the intraurethral veins controlled by the arteriovenous anastomoses.14 In order to begin to understand how the plexus seals the lumen we employed a separate 2D axisymmetric FE model with the plexus layer being modeled as a fluid domain filled with blood. It was assumed to have inlet and outlet boundaries representing the arterial and venous pressures. The plexus domain was assumed separated from either the bladder neck or intra-lumen fluid domain filled with urine, by a 100 μm elastic epithelial layer with a very low Young’s modulus. It is the interaction between the fluid dynamic (urine and blood) and tissue mechanics (epithelium) physics that will be explored here. We did not explore the effect of muscle contraction on the outer boundary.
To study the effect of vascular plexus on sealing of the urethral lumen we can consider a 1.5 mm × 1.5 mm window from the proximal portion of the vascular plexus, immediately inferior to the bladder neck, where the plexus, urine, and epithelial domains exist was studied (see Figure 3). The width of the window was chosen from the values provided by the literature for the plexus layer.22 For simplicity, the height of the window of interest was only a fraction of the total plexus length. This would not change the result but reduced the computational time.
Figure 3.
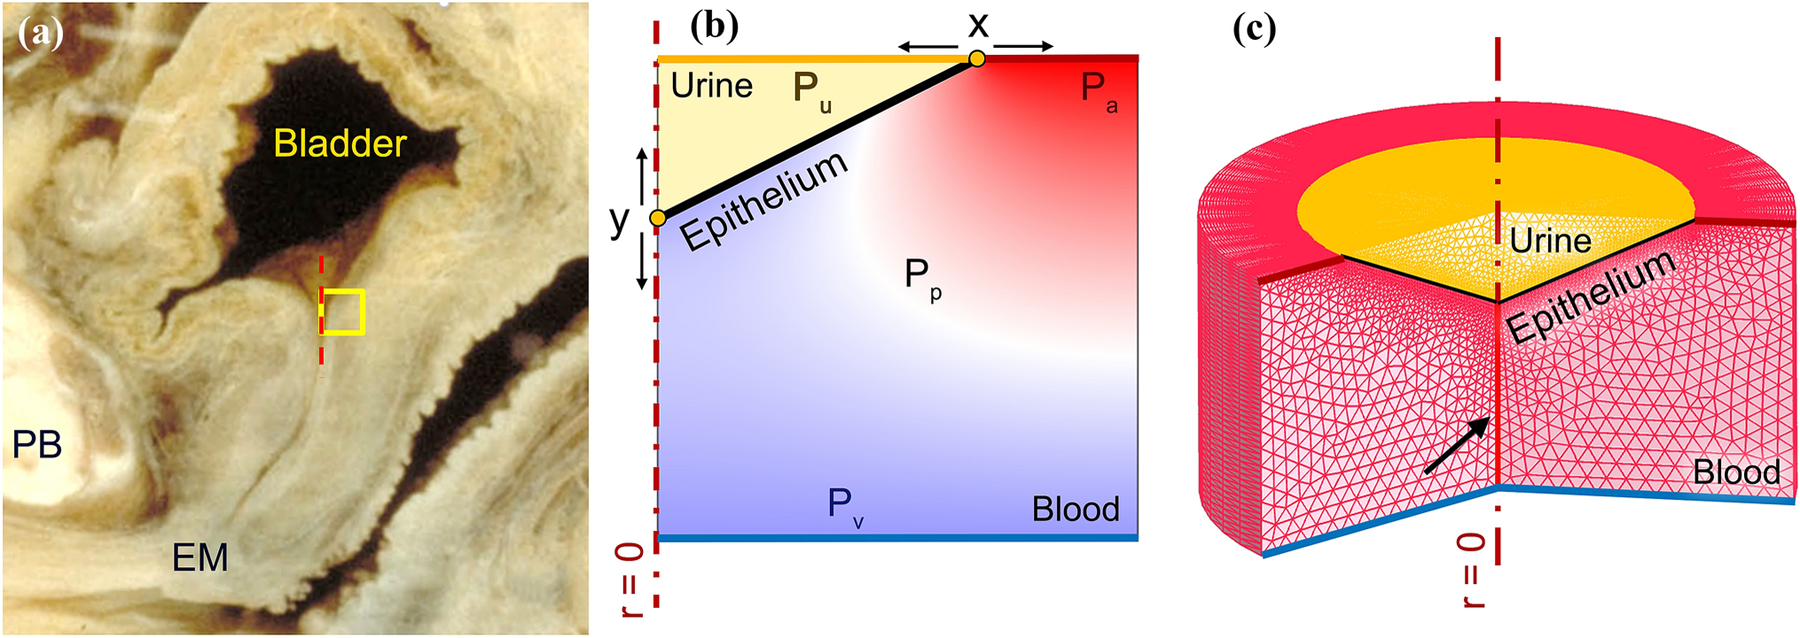
(a) Left lateral view of a mid-sagittal section of a cadaveric female lower urinary tract (©DeLancey). The yellow square represents the region of interest in the proximal urethra immediately inferior to the bladder neck. PB represents pubic bone and EM represents external meatus. (b) 2D axisymmetric window (in the region of interest) of the proximal vascular plexus filled with blood, the epithelium separating the plexus from the urine in the proximal urethra. Arterial (Pa), venous (Pv) and vesical pressures (Pu) are variables that were systematically changed in the FE simulation to explore their effect on the closure pressure and the functional length of the urethra. The effective plexus pressure (Pp) is a dependent pressure between the inlet and outlet pressures which determines the closure pressure. (c) 2D axisymmetric meshed domain partially revolved showing the 1.5 mm thick annular shape of the proximal urethra and its vascular plexus. The closed lumen is shown by the black arrow.
The axis of symmetry was placed on the left edge of the window. The urine fluid domain was represented by the triangular shape in the upper left corner of the window. The rest of the window was considered the plexus domain, and the epithelial layer separated both fluid domains (solid black line in Figure 3b). Overall, this window was meshed with about 2,300 triangular elements.
The epithelial layer was modeled with quadratic elastic shell elements. The fluid dynamics physics of both the urine and blood-filled plexus domains was solved using the time-dependent Navier-Stokes equations. Since deformation of this interactive model was large, an Arbitrary Lagrange and Eulerian moving mesh scheme was adopted. For the sake of simplicity, the intrinsic viscous damping of the plexus layer tissue was neglected in these simulations.
The boundary conditions of the ends of the epithelial shell (Figure 3b) were defined as ‘rollers’ along each edge. The top segment of the urine domain (yellow) was set as an open boundary with a bladder pressure (Pu). The vascular supply was assumed to enter the proximal urethra based on histology.14 Therefore, the right segment of the top edge of the plexus domain (dark red) was set to be the inlet with the arterial pressure (Pa) while the bottom edge (blue) was defined as the outlet with venous pressure (Pv) where the veins exit.14 Both the inlet and outlet boundaries were chosen as one-way boundaries to suppress backflow in the plexus boundary. In the FE study, these three pressures were altered around the equilibrium state to see how they would deform and move the epithelial boundary. The functional urethral length includes the left boundary of the plot (Figure 3b). In other words, the urethral lumen is hermetically sealed where it contacts the left y axis in that figure. If the epithelial boundary rolls caudally, because of increased vesical pressure or decreased effective plexus pressure, the urine intrudes into the lumen, thereby temporarily shortening the functional length of the urethra, and vice versa.
More specifically, if the point y in (Figure 3b) moves proximally the functional urethral length is lengthened improving the continence margin, while if it moved distally the vesical length would open and the functional urethral length would be reduced, reducing the continence margin. To avoid the complexities of dealing with topology changes and self-contact mechanics, the simulations were halted once the epithelial layer stably moved in either direction and reached the other boundaries.
In setting up the wall boundary types in the fluid dynamics physics, a “no slip” boundary condition was chosen for the internal wall e.g., the epithelium. The “no-slip” boundary condition on the epithelial edge (or wall) means that the fluid velocity relative to the boundary was set to zero.
In defining the moving mesh, both fluidic domains were chosen as deforming domains. The top and the symmetry edge (r = 0) – on which the epithelial shell ends are rolling - were defined to have sliding mesh.
Finally, Table 1 shows the material properties that were taken from the literature to be used for this simulation.11,16,21,24,32
Table 1.
Assumed material properties of the epithelial layer, blood and urine used in the fluid-solid interactive physics of the vascular plexus layer.
| Epithelium | Young’s Modulus | 14 kPa | Yamada (1970) |
| Density | 1190 kg/m3 | ||
| Poisson’s ratio | 0.45 | ||
| Blood | Dynamic Viscosity | 3.5×10⁻³ Pa.s | Gustafson (1980) |
| Density | 1060 kg/m3 | ||
| Urine | Dynamic Viscosity | 7×10⁻⁴ Pa.s | Kim (2017), Oppliger (2005) |
| Density | 1023 kg/m3 |
Results
I. Contribution of each urethral muscle to UCP
The computations (Table 2) showed that when the striated muscle contracted in length by 4%, the MUCP increased up to 35 cmH2O (Figure 4), whereas when the circular smooth muscle (CSM) contracted by the same amount, 4%, the MUCP increased up to only 12 cmH2O. The lower MUCP change in this case could be a result of the smaller CSM thickness compared to that of the STM (Figure 5).
Table 2.
Change in the maximum UCP from rest when each individual muscle layer was contracted (in length by 4%).
| Muscle Layer | State (λc) | Change in the MUCP (cmH2O) from rest |
|---|---|---|
| At Rest | 1 | 0 |
| Circular striated muscle | 0.96 | 35 |
| Circular smooth muscle | 0.96 | 12 |
| Longitudinal smooth | 0.96 | 0 |
| Circular smooth and striated muscles | 0.96 | 42 |
| All three layers | 0.96 | 30 |
Figure 4.
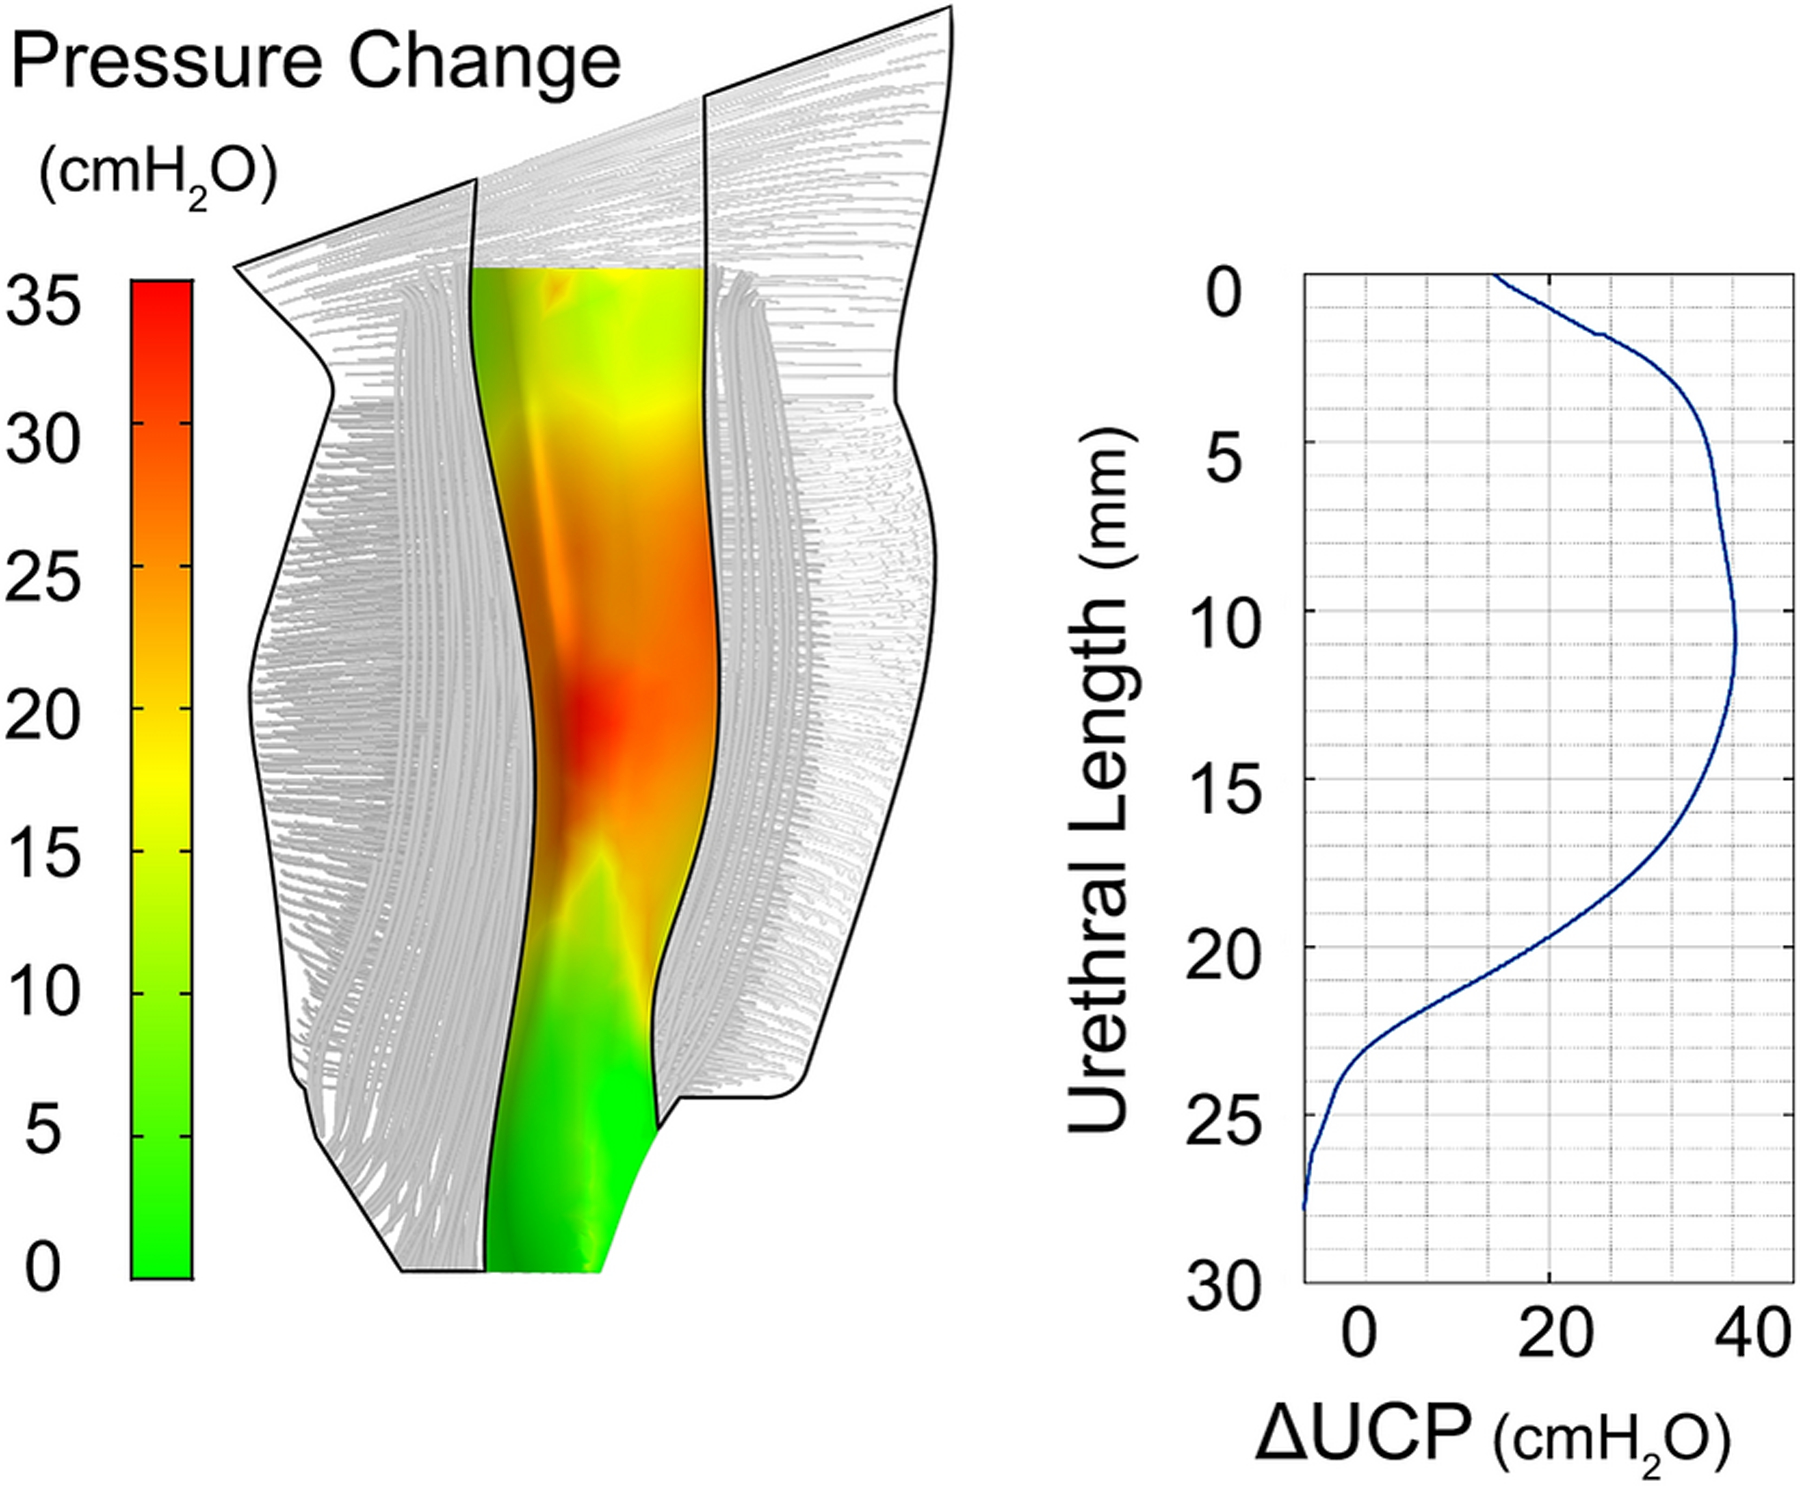
Distribution of the pressure change on the surface between plexus and LSM layer when the STM fibers contracted in length by 4% from the resting state (left), and the plot of the change in UCP along the urethra for the same STM contraction (right).
Figure 5.
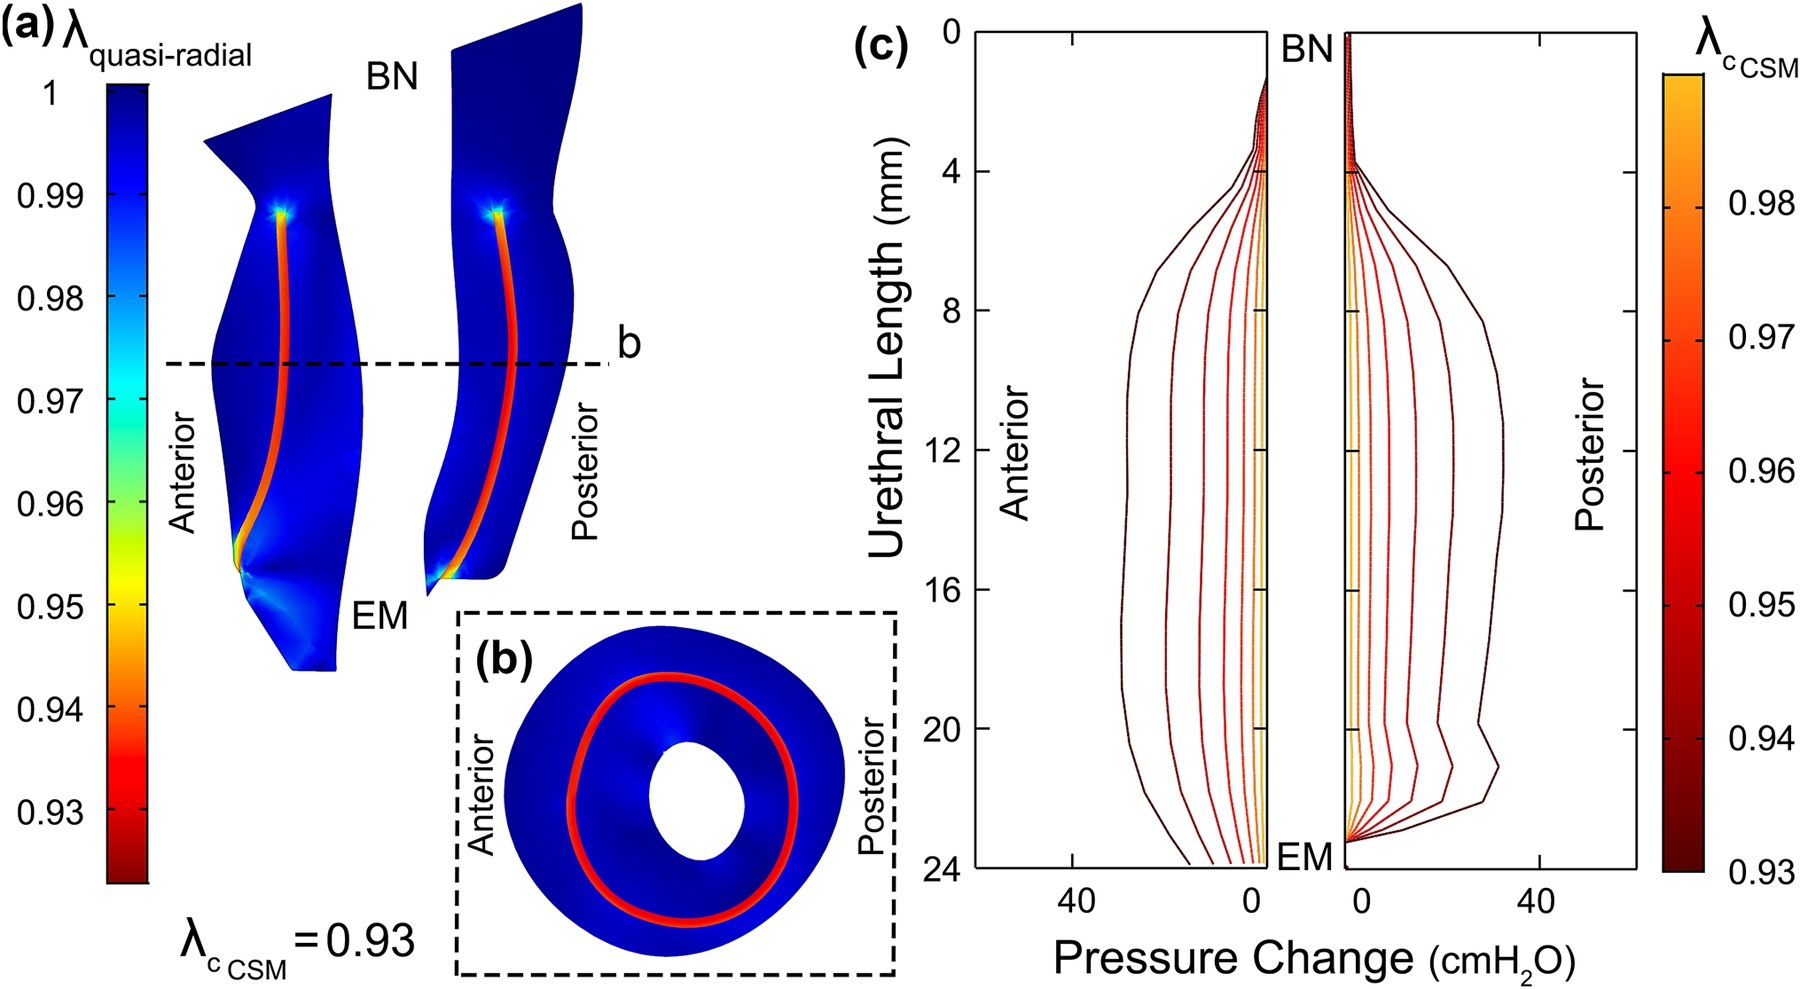
(a) Mid-sagittal and (b) mid-axial cross-section of the urethral musculature tissues showing the quasi-radial principal stretch ratio λquasi−radial when CSM (red regions) is contracted 7% in length (BN: bladder Neck and EM: external meatus). (c) Distribution of the pressure change on the catheter when only the CSM layer contracted up to 7% in length (). CSM contributed three times less to the UCP than STM when contracted by the same contraction stretch ratio.
In contrast, when the longitudinal smooth muscle contracted in length, even by 20%, the MUCP did not increase in the mid-urethra, but it shortened the urethra (Figure 6). When all three muscles contracted simultaneously in length by 4%, the change in MUCP reached 30 cmH2O in the mid-urethra, thereby reducing the MUCP (see Discussion).
Figure 6.
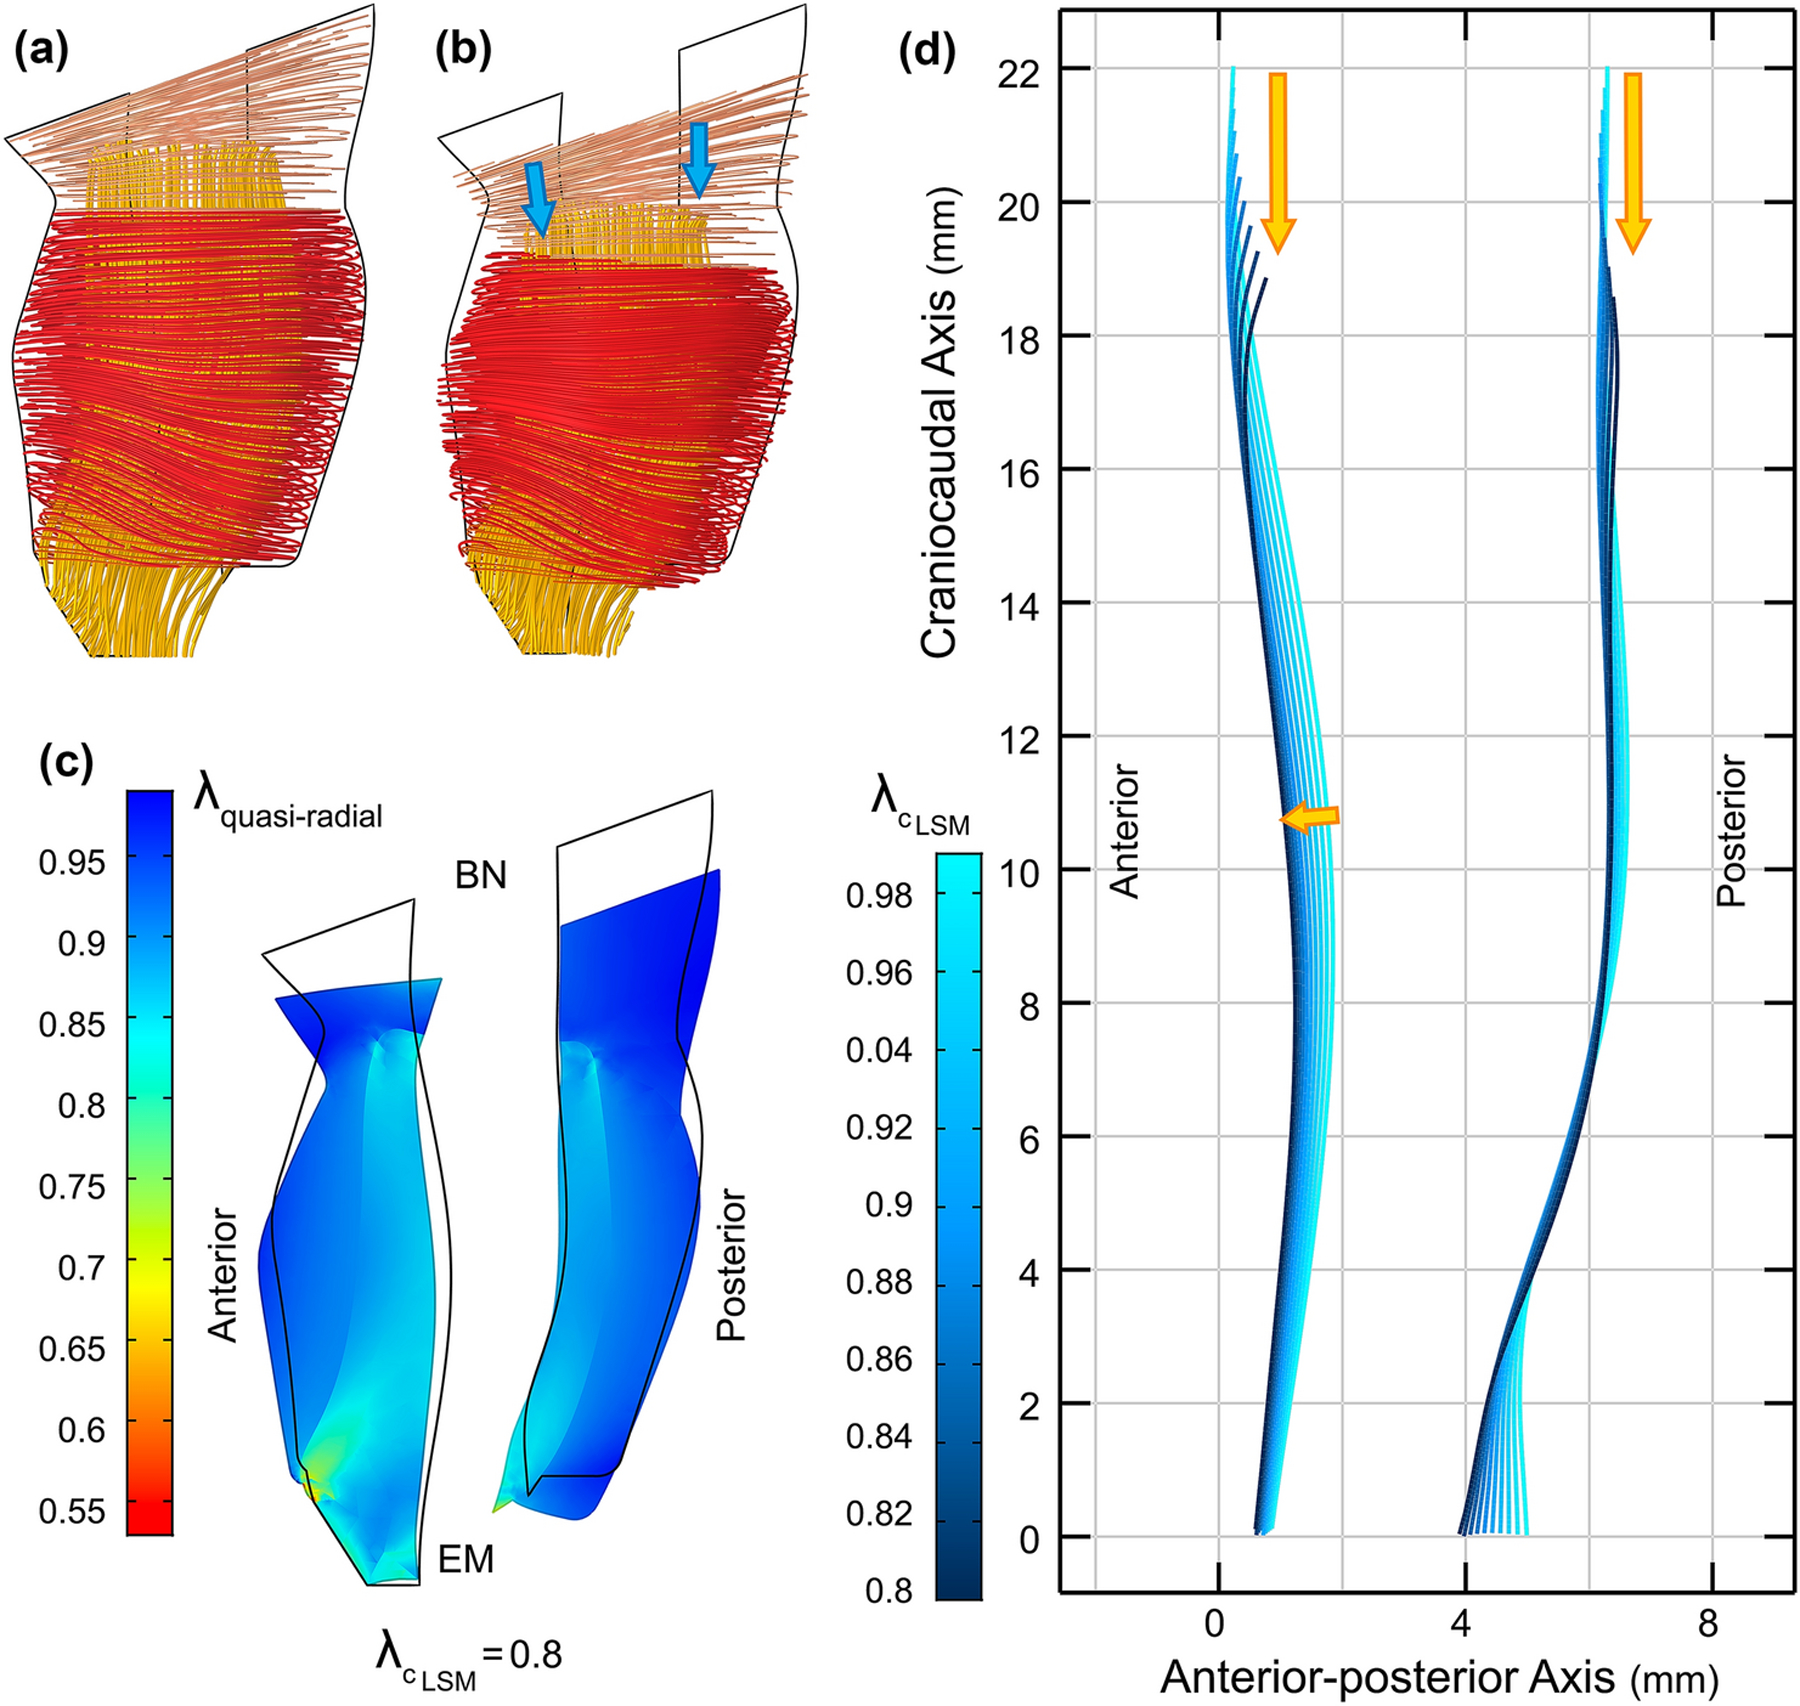
(a) Lateral view of the urethra muscle fibers at rest, and (b) when LSM contracts 20% in length. (c) The overall deformed midsagittal cross section of the urethra when LSM contracts 20%. The black outline represents the resting state. The color distribution represents the overall stretch ratio (resultant of active and mechanical) along the quasi-radial direction (BN: bladder neck and EM: external meatus). (d) The anterior and posterior loci of the intersection of the inner surface of the LSM and mid-sagittal plane shows that the urethra is shortened and moved downward when LSM contracts from the rest state. The anterior mid-urethral region of the LSM did not constrict but stretched out the outer STM instead.
II. Simulating the effect of aging in the dorsal passive portion of the STM on UCP
When the intact STM was contracted urethral pressure distribution posteriorly was similar to that anteriorly (Figure 7a, b and c). However, when age-related posterior muscle atrophy was modeled as passive tissue in these simulations, to be stretched by the remaining horseshoe-shaped STM in the transverse plane, the levels of the pressure change in the urethra were reduced by 26% anteriorly and 83% posteriorly (Figure 7d, e and f). Hence, this simulated aging effect reduced UCP.
Figure 7.
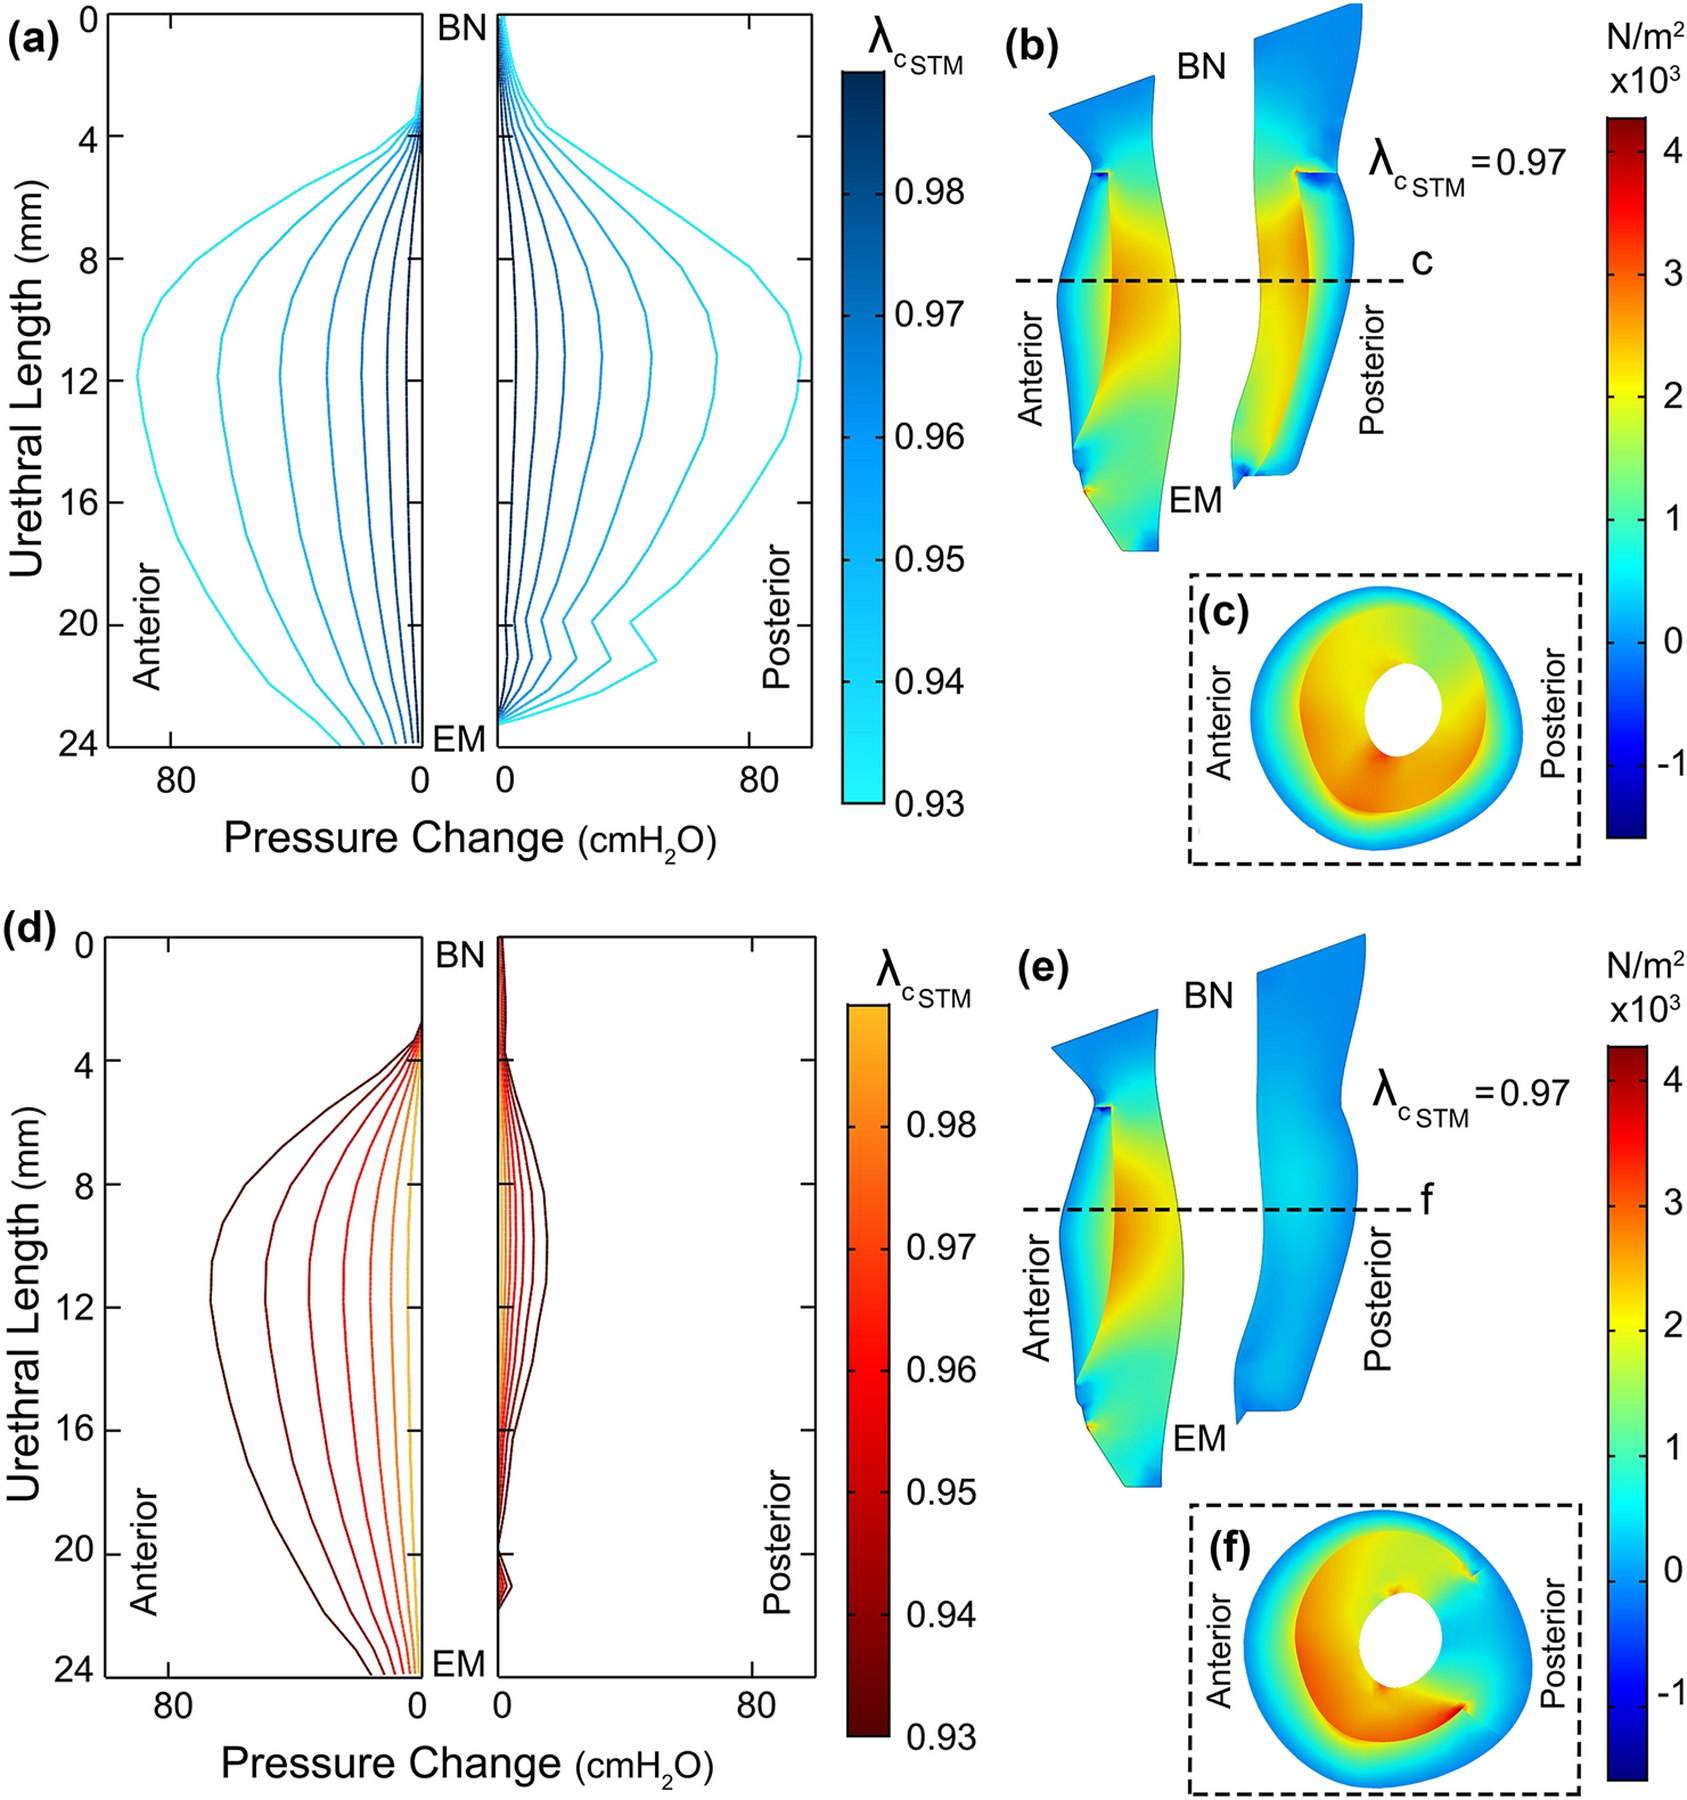
a) Urethral pressure (change) distribution when STM layer was comprised wholly of contractile fibers contracting up to 7% in length (BN: bladder Neck and EM: external meatus). Each profile is associated with a particular stretch ratio of the STM (). (b) Mid-sagittal and (c) mid-axial (dashed line) cross section of the urethra muscles showing the principal stress distribution along inward quasi-radial direction when STM contracts 3% in length. (d) Urethral pressure (change) distribution when the horseshoe of STM contracted up to 7% in length. The dorsal region of the STM was modeled as a passive tissue without actively contracting. (e) Mid-axial and (f) mid-sagittal cross section of the urethra muscles showing the principal stress distribution along inward quasi-radial direction when STM contracts 3% in length.
III. On the Vascular Plexus in Sealing the Urethral Lumen
To examine the role of the vascular plexus layer “at rest” in the 2D axisymmetric FE model, the initial vesical pressure (Pu) was set to 15 mmHg (or ~20.4 cmH2O). The initial inlet (Pa) and outlet (Pv) pressures of the plexus domain were also set equal to the vesical pressure (Figure 8a). Afterwards, a series of time dependent studies were run and the plexus pressures increased via a ramp function to reach the desired pressure based on the scenario being studied. The outlet pressure (Pv) increases to a fraction of the inlet pressure through iterations to resemble the pressure drop across the vascular plexus.33
| (3) |
Figure 8.
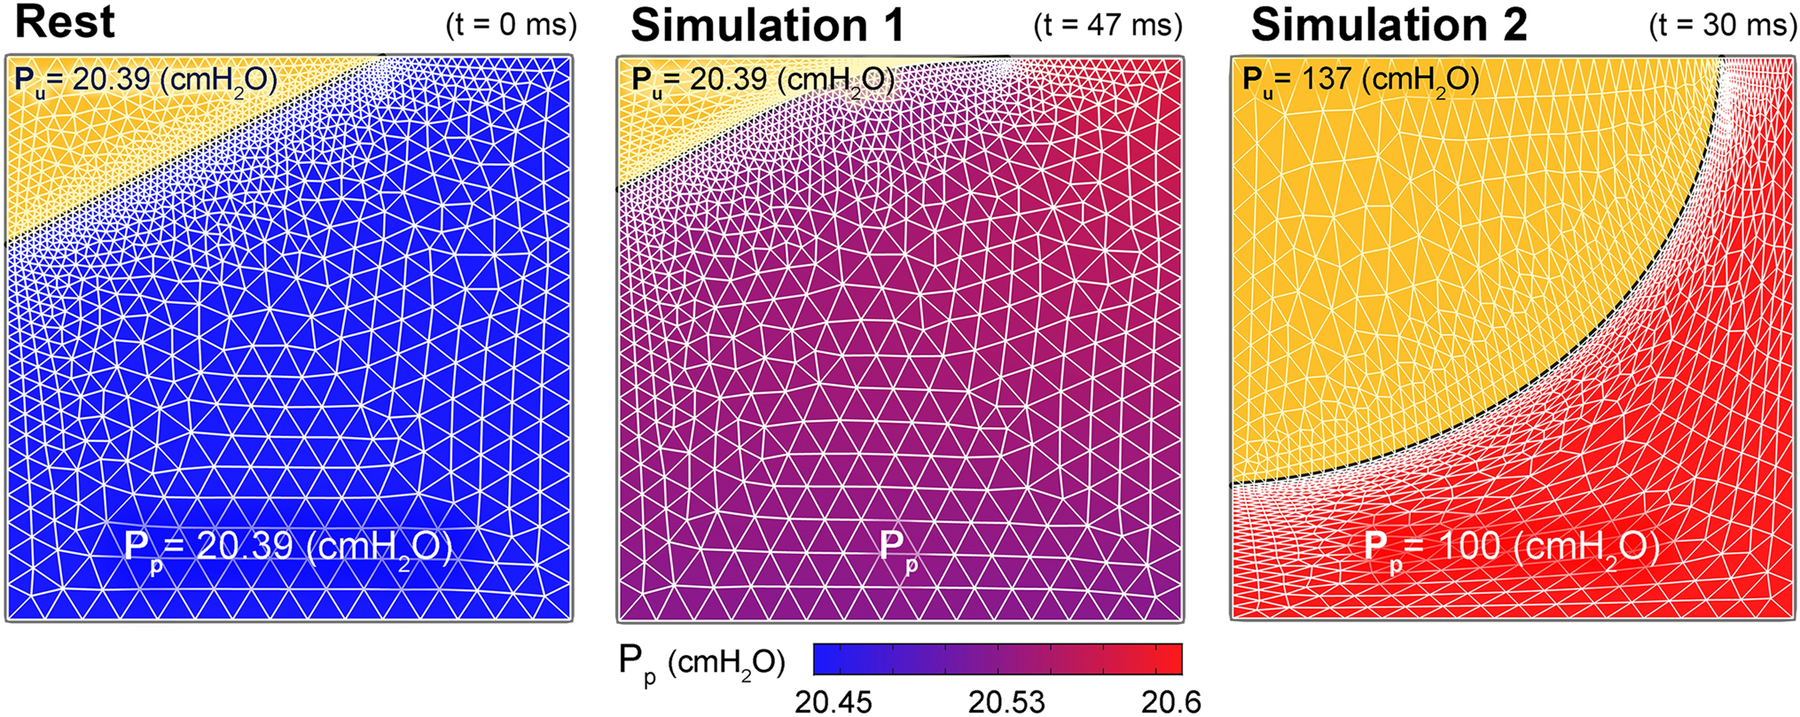
The pressure distribution at different time intervals across the 1.5 mm × 1.5 mm window of the proximal urethra where the vascular plexus (VP) layer starts. Results reveals that the higher blood pressure distribution in the VP compared to the vesical pressure can increase the functional urethral length and promote a hermetic seal. (a) Urine inside the bladder is shown by the yellow triangular region at top left corner. (a) At t = 0 s the arterial pressure of the vascular plexus (inlet) is increased from the initial value equal to the vesical pressure. (b) As pressure distribution continues to increase across the VP, the epithelial boundary slides proximally (up). This further increase in VP inlet and respectively outlet pressures, increases the functional urethral length (or the left axisymmetric boundary of VP). However, when intra-abdominal pressure suddenly rises during stress events such as cough or lifting a heavy object and if the average pressure across the plexus layer fails to overcome the increased vesical pressure in a stress incontinent patient, the functional urethral length is reduced i.e., the epithelial layer expands and is pushed distally (c). This could initiate a leakage episode.
The results of this simulation showed that the epithelial border slides proximally (Figure 8b) and thereby increases the functional urethral length (or increasing the y value in Figure 3b); In other words, it helps to keep the hermetic seal of the urethra.
In a sensitivity analyses of the parameter α, a new insight was revealed in that for this simplified model of the plexus, the effective plexus pressure (Pp) between the inlet and outlet pressures determines the closure pressure. However, Pp was not exactly the mean of the inlet and outlet pressures and depended upon factors including the true topology and state of the plexus. Therefore, Pp could vary between different urethrae as would the state of the surrounding musculature tissues deforming the plexus in different scenarios.
In summary, a positive difference between the effective plexus pressure (Pp) and the vesical pressure (Pu) helped to maintain continence. Given the material properties that were assumed, there was also a minor hysteresis pressure (Ph ≈ 2 cmH2O) which depended on the stiffness of the epithelial layer. Therefore, in a non-accelerating frame:
in which Ph ≪ Pu.
A second simulation in which the IAP was increased rapidly also verified the stated pressure equilibrium. In that simulation, the effect of IAP rise was modelled by increasing the three pressures in all domains. In the first phase of this simulation, the arterial pressure could compensate for the increased vesical pressure and therefore maintain continence. However, in the absence of a further increase in vesical pressure an incompetency of the intermediate vascular plexus pressure (Pp) caused the epithelial layer to deform and move distally (Figure 8c): in so doing, it reduced the functional urethral length (or decreased y value in Figure 3b) (Figure 3c. A similar result was obtained when the intermediate vascular plexus pressure was reduced from the equilibrium state simulating the start of the micturition process in which arterioles shut off the arterial pressure to the vascular plexus layer.
Discussion
This six-element, FE urethral model permitted us to test hypotheses which would be very difficult, if not impossible, to test in vivo in humans for ethical reasons. The test of the primary hypothesis showed that a simulated STM contraction corroborated earlier experimental findings that women can voluntarily increase their MUCP between 13 to 23 cmH2O4,7 from the resting UCP state. Both the predicted magnitude of the increase in UCP, as well as the similarity in shape of the calculated UCP -urethral length relationship to that measured by Hilton and Stanton,12 provides some measure of validation for those model results.
Our results provide a fresh view of muscle dynamics. While contraction of the circular muscles increased the UCP, a co-contraction of the LSM reduced that elevation in UCP. This finding contrasts with the existing theory whereby the “smooth” muscles of the urethra has been held responsible for one third of the UCP.26 That observation did not consider which of the two smooth muscles was being referred to. This is an important distinction since there is much more longitudinal than circular smooth muscle, a paradoxical situation for a sphincter. In fact, the model-predicted role of LSM in shortening the urethra and not increasing the UCP is at odds with Rud’s hypothesis that the LSM contributes to the UCP by contracting and forming a thick plug via the Poisson effect.27 We therefore reject the primary hypothesis that the striated and smooth muscles contribute equally to UCP and find that the relative contributions of the two smooth muscle elements need to be considered.
A careful examination of the results also revealed that the contraction of the LSM distends the STM, but did not constrict the lumen. This unique behavior was the consequence of the asymmetrical shape of the urethra and the fact that STM does not fully contract in the resting state. In fact, LSM contractions of up to 20% in length, straightened the curvature of the urethra, mostly anteriorly, rather than forming a thick plug.
Finally, these simulations indicate that the CSM layer was markedly less effective in contributing to the UCP compared to the STM, even though it lies closer to the lumen. It has been suggested elsewhere that the CSM is incapable of significantly constricting the urethra due to its minimal layer thickness,14 and we would concur with that being the case, at least in this urethra.
In testing the second hypothesis, it was shown that the pressure difference between the effective vascular plexus pressure (Pp) and the vesical pressure directly affects the functional urethral length and hermetic seal of the plexus layer. Previously, Rud et al. found that the vascular plexus was responsible for 28% of the UCP (~41 cmH2O) in five women.26 Since there is no information on whether the catheter displaced all the blood from the plexus layer in their experiment, it is not possible to validate the present model using their data. However, since they measured pulsating pressures in the lumen, we surmise that the plexus might still have contained some blood that was being pressurized by arterial pressure. Therefore, we can conclude they measured an effective plexus pressure being higher than the vesical pressure and yet less than the arterial pressure (see equation (3) on the effective plexus pressure).
I. Aging
Perucchini et al. showed that aging affects the width of the dorsal active STM even in the nulliparous women – excluding the possible atrophy due to nerve damage inflicted by pressure of the fetal head during a difficult vaginal delivery.22 Therefore, when the dorsal 70° arc of the STM was rendered in the transverse plane into a passive tissue in the present model, the UCP dorsally was found to be less than that in an intact STM. Validation for this result comes from a similar pressure profile10 having been measured in incontinent women. Therefore, our model results provide a possible explanation of how and why aging can adversely affect continence by reducing UCP and why stress incontinence is more prevalent in older women.
Regarding the vascular plexus layer and the second hypothesis, any structural change can alter the vascular resistance in the plexus layer and the effective vascular plexus pressure (Pp), thereby changing the continence thresholds. This could become critical in activities that increase IAP. The model suggests that the failure to provide a high enough arteriovenous vasculature pressure reduces the functional urethral length, thereby permitting a urine leakage episode during increases in intravesical pressure. Similarly, one can speculate that to initiate micturition, arteriole muscles might constrict and impede the blood supply to the vascular plexus, thereby reducing the effective vascular pressure in the plexus and allowing urine to flow into the proximal urethra.
One might also speculate that atherosclerosis could adversely affect the arterial pressure supplying the vascular plexus by partially impeding inflow and this might be one reason that SUI is more common in older women. Nevertheless, blood pressure increases with age,18 while the UCP declines.31 Among many other possibilities, it implies that either there are structural changes in the vasculature14 that prevent an effective vascular plexus pressure rise, or simply there is not enough stiffness or support from the muscles, perhaps in the atrophied urethral wall, to constrain the outer margin of the vascular plexus radially.
The Young’s modulus of the epithelial boundary of the plexus layer in these simulations was low enough to cause minimal hysteresis effect on the pressure equilibrium (Ph ≈ 2 cmH2O). Nevertheless, aging and diseases can also alter the type of epithelial cells of the lumen.14 This in turn can affect the mechanical properties and possibly lower thresholds for continence.
II. Limitations
A major limitation of this study was the lack of direct in vivo validation of model predictions in this woman. In the future, this might be achieved by using state-of-the-art imaging or non-invasive urodynamic techniques that have yet to be developed. This is important given the many knowledge gaps we faced that included the actual material properties of the different living tissues, the true fiber directions, the density and distribution of smooth muscle cells, and the exact boundary conditions. As an example, in reality the proximal and distal ends of the LSM are actually fused into other layers,14 whereas in the present model the LSM fibers were mainly oriented longitudinally and unified with the circular fibers orthogonally only at the ends. Other simplifying assumptions were the exclusion of the contact mechanics, time dependent analyses (in testing the primary hypothesis), and viscoelasticity from the model, all of which could introduce errors and make results deviate from reality. More importantly, this model was constructed from a resting state, for which there is no experimental information on how much each layer is precontracted. Therefore, this model may not exactly predict the exact contribution of each layer at rest.
A second limitation was the fact that this model was built using MR scans from a single healthy young woman and not all urethral details could be captured due to lack of resolution at the smaller length scales. In regards to the first point, Perruchini22 found that the geometry of urethral layers can differ markedly between women. Therefore, interindividual differences need to be incorporated into future models. Lastly, when a muscle contracts the viscoelastic material properties of that muscle change in proportion to the contractile stress in the muscle.5 This effect needs to be considered in the future.
Finally, a third limitation in this first detailed 3D model of a healthy urethra was the absence of the remarkable vascular plexus along the full length of the urethra fully coupled with the developed musculature layers in order to identify the effective vasculature pressure (Pv). Modeling both vasculature and musculature layers together could provide more realistic results. Moreover, in the vascular plexus model, the effects of gravity and activity-related accelerations on the domains were neglected; in practice, these could lead to urine leakage in activities like jumping, running, coughing or sneezing.
Concluding Remarks
The STM was the muscle layer that contributed the most to the UCP, about three times that developed by the CSM.
A contraction of the LSM did not contribute to the UCP by forming a thick plug as described in the literature. Instead, it shortened the urethra and reduced UCP. Given this, we speculate that its role may be during voiding.
Regarding age-related loss of the striated muscle in the posterior urethra, we predicted that the widening of the passive portion of the striated circular layer in its posterior region reduced the overall predicted UCP: this reached an 83% reduction in this region, and could thereby contribute to stress incontinence.
The difference between the vascular plexus pressure and vesical pressures was found to help determine the UCP and directly contribute to the functional urethral length.
Acknowledgments
We gratefully acknowledge financial support from the National Institute of Diabetes and Digestive and Kidney Diseases (1 RC2 DK122379–01) and Procter & Gamble (through a research contract).
Footnotes
Conflict of Interest
Authors declare that they have no conflict of interest.
The diameter of the widest section of the vascular plexus layer along the urethra is less than 3 mm.22 The diameter of an 8 Fr catheter is 2.67 mm (1 Fr = 0.33 mm).
References
- 1.Abé H, Hayashi K, and Sato M. Data Book on Mechanical Properties of Living Cells, Tissues, and Organs. Tokyo: Springer Japan, 1996, 37–39 pp. [Google Scholar]
- 2.Backman KA URODYNAMICS-THE HYDRODYNAMICS OF MICTURITION IN NORMAL FEMALE SUBJECTS. Acta Neurol. Scand 42:79–85, 2009. [DOI] [PubMed] [Google Scholar]
- 3.Brandão S, Parente M, Silva E, Da Roza T, Mascarenhas T, Leitão J, Cunha J, Natal Jorge R, and Nunes RG. Pubovisceralis Muscle Fiber Architecture Determination: Comparison Between Biomechanical Modeling and Diffusion Tensor Imaging. Ann. Biomed. Eng 45:1255–1265, 2017. [DOI] [PubMed] [Google Scholar]
- 4.Brincat CA, DeLancey JOL, and Miller JM. Urethral closure pressures among primiparous women with and without levator ani muscle defects. Int. Urogynecol. J 22:1491–1495, 2011. [DOI] [PMC free article] [PubMed] [Google Scholar]
- 5.Chaudhuri O, Cooper-White J, Janmey PA, Mooney DJ, and Shenoy VB. Effects of extracellular matrix viscoelasticity on cellular behaviour. Nature 584:535–546, 2020. [DOI] [PMC free article] [PubMed] [Google Scholar]
- 6.Clobes A, DeLancey JOL, and Morgan DM. Urethral circular smooth muscle in young and old women. Am. J. Obstet. Gynecol 198:587.e1–5, 2008. [DOI] [PMC free article] [PubMed] [Google Scholar]
- 7.DeLancey JOL, Fenner DE, Guire K, Patel DA, Howard D, and Miller JM. Differences in continence system between community-dwelling black and white women with and without urinary incontinence in the EPI study. Am. J. Obstet. Gynecol 202:584.e1–584.e12, 2010. [DOI] [PMC free article] [PubMed] [Google Scholar]
- 8.Griffiths D The pressure within a collapsed tube, with special reference to urethral pressure. Phys. Med. Biol 30:951–963, 1985. [DOI] [PubMed] [Google Scholar]
- 9.Griffiths DJ The mechanics of the urethra and of micturition. Br. J. Urol 45:497–507, 1973. [DOI] [PubMed] [Google Scholar]
- 10.Griffiths DJ, Constantinou CE, and van Mastrigt R. Urinary bladder function and its control in healthy females. Am. J. Physiol 251:R225–30, 1986. [DOI] [PubMed] [Google Scholar]
- 11.Gustafson DR Physics: Health and the human body. Wadsworth Publishing Company, 1980. [Google Scholar]
- 12.HILTON P, and STANTON SL. Urethral pressure measurement by microtransducer: the results in symptom-free women and in those with genuine stress incontinence. BJOG An Int. J. Obstet. Gynaecol 90:919–933, 1983. [DOI] [PubMed] [Google Scholar]
- 13.Holzapfel GA, Gasser TC, and Ogden RW. A new constitutive framework for arterial wall mechanics and a comparative study of material models. J. Elast 61:1–48, 2000. [Google Scholar]
- 14.Huisman AB Aspects on the anatomy of the female urethra with special relation to urinary continence. Contrib. Gynecol. Obstet 10:1–31, 1983. [PubMed] [Google Scholar]
- 15.Kim KJ, Ashton-Miller JA, Strohbehn K, DeLancey JOL, and Schultz AB. The vesico-urethral pressuregram analysis of urethral function under stress. J. Biomech 30:19–25, 1997. [DOI] [PubMed] [Google Scholar]
- 16.Kim KW, Choi YH, Lee SB, Baba Y, Kim H-H, and Suh S-H. Analysis of Urine Flow in Three Different Ureter Models. Comput. Math. Methods Med 2017:1–11, 2017. [DOI] [PMC free article] [PubMed] [Google Scholar]
- 17.Kim KJ BIOMECHANICAL ANALYSES OF FEMALE STRESS URINARY INCONTINENCE., 1994.
- 18.Kotchen JM, McKean HE, and Kotchen TA. Blood pressure trends with aging. Hypertension 4:128–134, 1982. [DOI] [PubMed] [Google Scholar]
- 19.Luikov AV Analytical heat diffusion theory. Elsevier, 2012. [Google Scholar]
- 20.Martins JAC, Pires EB, Salvado R, and Dinis PB. A numerical model of passive and active behavior of skeletal muscles. Comput. Methods Appl. Mech. Eng 151:419–433, 1998. [Google Scholar]
- 21.Oppliger RA, Magnes SA, Popowski LA, and Gisolfi CV. Accuracy of Urine Specific Gravity and Osmolality as Indicators of Hydration Status. Int. J. Sport Nutr. Exerc. Metab 15:236–251, 2005. [DOI] [PubMed] [Google Scholar]
- 22.Perucchini D, DeLancey JOL, Ashton-Miller JA, Galecki A, and Schaer GN. Age effects on urethral striated muscle. II. Anatomic location of muscle loss. Am. J. Obstet. Gynecol 186:356–60, 2002. [DOI] [PubMed] [Google Scholar]
- 23.Prendergast PJ, Lally C, Daly S, Reid AJ, Lee TC, Quinn D, and Dolan F. Analysis of Prolapse in Cardiovascular Stents: A Constitutive Equation for Vascular Tissue and Finite-Element Modelling. J. Biomech. Eng 125:692–699, 2003. [DOI] [PubMed] [Google Scholar]
- 24.Putnam D Composition and Concentrative Administration. Security, 1971. [Google Scholar]
- 25.Ritter RC, Zinner NR, and Paquin AJ. Clinical Urodynamics II. Analysis of Pressure-flow Relations in The Normal Female Urethra. J. Urol 91:161–165, 1964. [DOI] [PubMed] [Google Scholar]
- 26.Rud T, Andersson KE, Asmussen M, Hunting A, and Ulmsten U. Factors maintaining the intraurethral pressure in women. Invest. Urol 17:343–7, 1980. [PubMed] [Google Scholar]
- 27.Mustonen S, Ala-Houhala IO, Long-term T Renal Dysfunction in Patients with Acute Urinary Retention. Scand. J. Urol. Nephrol 35:44–48, 2001. [DOI] [PubMed] [Google Scholar]
- 28.Shaw JA, Dasharathi K, Wineman AS, and Si MS. A simple model for myocardial changes in a failing heart. Int. J. Non. Linear. Mech 68:132–145, 2015. [Google Scholar]
- 29.Spirka T, Kenton K, Brubaker L, and Damaser MS. Effect of Material Properties on Predicted Vesical Pressure During a Cough in a Simplified Computational Model of the Bladder and Urethra. Ann. Biomed. Eng 41:185–194, 2013. [DOI] [PMC free article] [PubMed] [Google Scholar]
- 30.Strohbehn K, Quint LE, Prince MR, Wojno KJ, and Delancey JO. Magnetic resonance imaging anatomy of the female urethra: a direct histologic comparison. Obstet. Gynecol 88:750–6, 1996. [DOI] [PubMed] [Google Scholar]
- 31.Trowbridge ER, Wei JT, Fenner DE, Ashton-Miller JA, and DeLancey JOL. Effects of Aging on Lower Urinary Tract and Pelvic Floor Function in Nulliparous Women. Obstet. Gynecol 109:715–720, 2007. [DOI] [PubMed] [Google Scholar]
- 32.Yamada H, and Evans FG. Strength of biological materials. 1970.
- 33.Yang JM, Yang SH, and Huang WC. Functional correlates of Doppler flow study of the female urethral vasculature. Ultrasound Obstet. Gynecol 28:96–102, 2006. [DOI] [PubMed] [Google Scholar]
- 34.Zhang Y, Kim S, Erdman AG, Roberts KP, and Timm GW. Feasibility of Using a Computer Modeling Approach to Study SUI Induced by Landing a Jump. Ann. Biomed. Eng 37:1425–1433, 2009. [DOI] [PubMed] [Google Scholar]


