

Abstract
Pelvic organ prolapse (POP) is common among older women who have delivered children vaginally. While the pathophysiology is not fully delineated, POP can occur in part from insufficient repair of disrupted elastic matrix fibers. Quantification of structural changes to elastic fibers has not been described previously for POP. The goal of this paper is to present a validated technique for morphometric analysis of elastic fibers in vaginal tissue cultures from lysyl oxidase like-1 knock out (LOXL1 KO) mice with POP. The effect of LOXL1 KO, effect of POP, effect of culture, and effect of elastogenic treatment on the changes in elastin fiber characteristics were tested using vaginal tissues from wild type multiparous (WT), LOXL1 KO multiparous prolapsed (POP) and LOXL1 KO multiparous non-prolapsed (NP) mice. Our results show significantly higher mean aspect ratio, maximum diameter and perimeter length in POP compared to NP after 3 weeks of tissue culture. Further, treatment of POP tissues in culture with growth factors with previously documented elastogenic effects caused a significant increase in the mean area and perimeter length of elastic fibers. This technique thus appears to be useful in quantifying structural changes and can be used to assess the pathophysiology of POP and the effect of elastogenic treatments with potential for POP.
Key Terms: Extracellular Matrix, Elastin, Regenerative Repair, Elastogenesis, Mice, Lysyl oxidase, Female
Introduction
Pelvic organ prolapse (POP) is the the herniation, descent, and sometimes extrusion of pelvic organs in women, including the vagina, uterus, bladder, and rectum. It affects 30% of women within 15 years of a vaginal delivery, dramatically decreasing quality of life2. The mainstay of POP treatment had been pelvic mesh implantation. Recently, high complication and removal rates were exposed, the US Food and Drug Administration (FDA) issued several warnings, class action lawsuits ensued, and these mesh products were removed from the market10. New treatments are therefore greatly needed but improved knowledge of the pathology of POP is required to develop pathophysiologically based therapies.
Risk factors for POP include vaginal delivery, aging, and connective tissue disorders, such as Marfan’s syndrome or Ehlers-Danlos disorder37. Alterations in elastin metabolism have been demonstrated in women with POP and in animal models of POP11,19,25,31,36. Studies have shown that extracellular matrix changes occur in the prolapsed vaginal wall, with a decrease in elastin and collagen content34,39. Clinical studies have also demonstrated decreased expression of lysyl oxidase like1 (LOXL1), a monoamine oxidase which covalently crosslinks elastin and collagen and regulates elastic fiber remodeling40,41.
LOXL1 knockout (KO) mice demonstrate a POP phenotype striking similar to that in women: POP develops only after delivery of pups or with aging23,26,27. Although this mouse model is an extreme manifestation of POP, can be used to investigate the pathology of the condition and for preclinical testing of novel therapies for POP. To do so, methods to quantify elastin deposits and elastic fiber structures need to be developed since there is an absence of methods to characterize and hence assess the quality and quantity of elastic matrix. Most investigations report only the overall elastin protein content in the tissues measured with biochemical/colorimetric assays or an area fraction of elastic fibers in tissue sections measured from histological images18,24, without identification of conformal or structural abnormalities. Techniques to quantify elastic fiber structural characteristics such as diameter, angle/orientation, tortuosity, etc. will thus be useful to investigate structural changes to the elastic matrix.
In this study we present and validate a technique for quantitative morphometry of elastic matrix using Image Pro®-based morphometric analysis of modified Hart stained tissue sections from vaginal tissues of LOXL1 KO mice. We use this method to investigate changes in elastin morphometry with (a) LOXL1 KO, (b) with POP, (c) with tissue culture, and (d) with elastogenic factor treatment. To test elastogenic factor treatment, ex-vivo cultures of vaginal tissues isolated from LOXL1 KO mice with POP were treated with elastogenic factors (EFs): hyaluronan oligomers (HA-o) and transforming growth factors-β1 (TGF-β1), which we have previously shown to have pro-elastogenic effects on both non-epithelial vaginal cells (NEVCs; smooth muscle cells and fibroblasts) from LOXL1 KO mice with POP (4), and other cell types7.
Materials and Methods
Animal breeding techniques and tissue harvest
This study was approved by the Cleveland Clinic Institutional Animal Care and Use Committee and was consistent with guidelines in the Guide for the Care and Use of Laboratory Animals. LOXL1 KO female mice (established colony) were backcrossed with male wild type (WT) mice (Cat# 101043; B6129SF1/J, The Jackson Laboratory, Bar Harbor, ME). The heterozygote female and male offspring were then housed as single pairs and allowed to breed, resulting in LOXL1−/−, LOXL1+/−, and LOXL1+/+ mice. Genotype identification was done by PCR analysis23. Breeding pairs of genetically matched brother/sister WT and KO animals were established and allowed to breed ad libitum. The resultant animals were the experimental animals used in this study. To generate the multiparous females needed for this study, breeding pairs of genetically matched animals were established at 8–9 weeks old. The male mice in these pairs were removed 2 weeks after the first delivery. Multiparous mice were euthanized for this study at 30.1 – 33.1 weeks old.
POP in mice was characterized weekly using the validated mouse pelvic organ prolapse quantification (MOPQ) scale23,40. A MOPQ score of 2 or greater was considered to indicate POP in the mice. Six female LOXL1 KO multiparous non-prolapsed (Non-POP or NP) mice and six female LOXL1 KO multiparous mice with POP were used. Six age-matched multiparous wild type (WT) mice bred in-house were studied as controls. The experimental design is summarized in Fig 1.
Figure 1. Experimental design of the study.
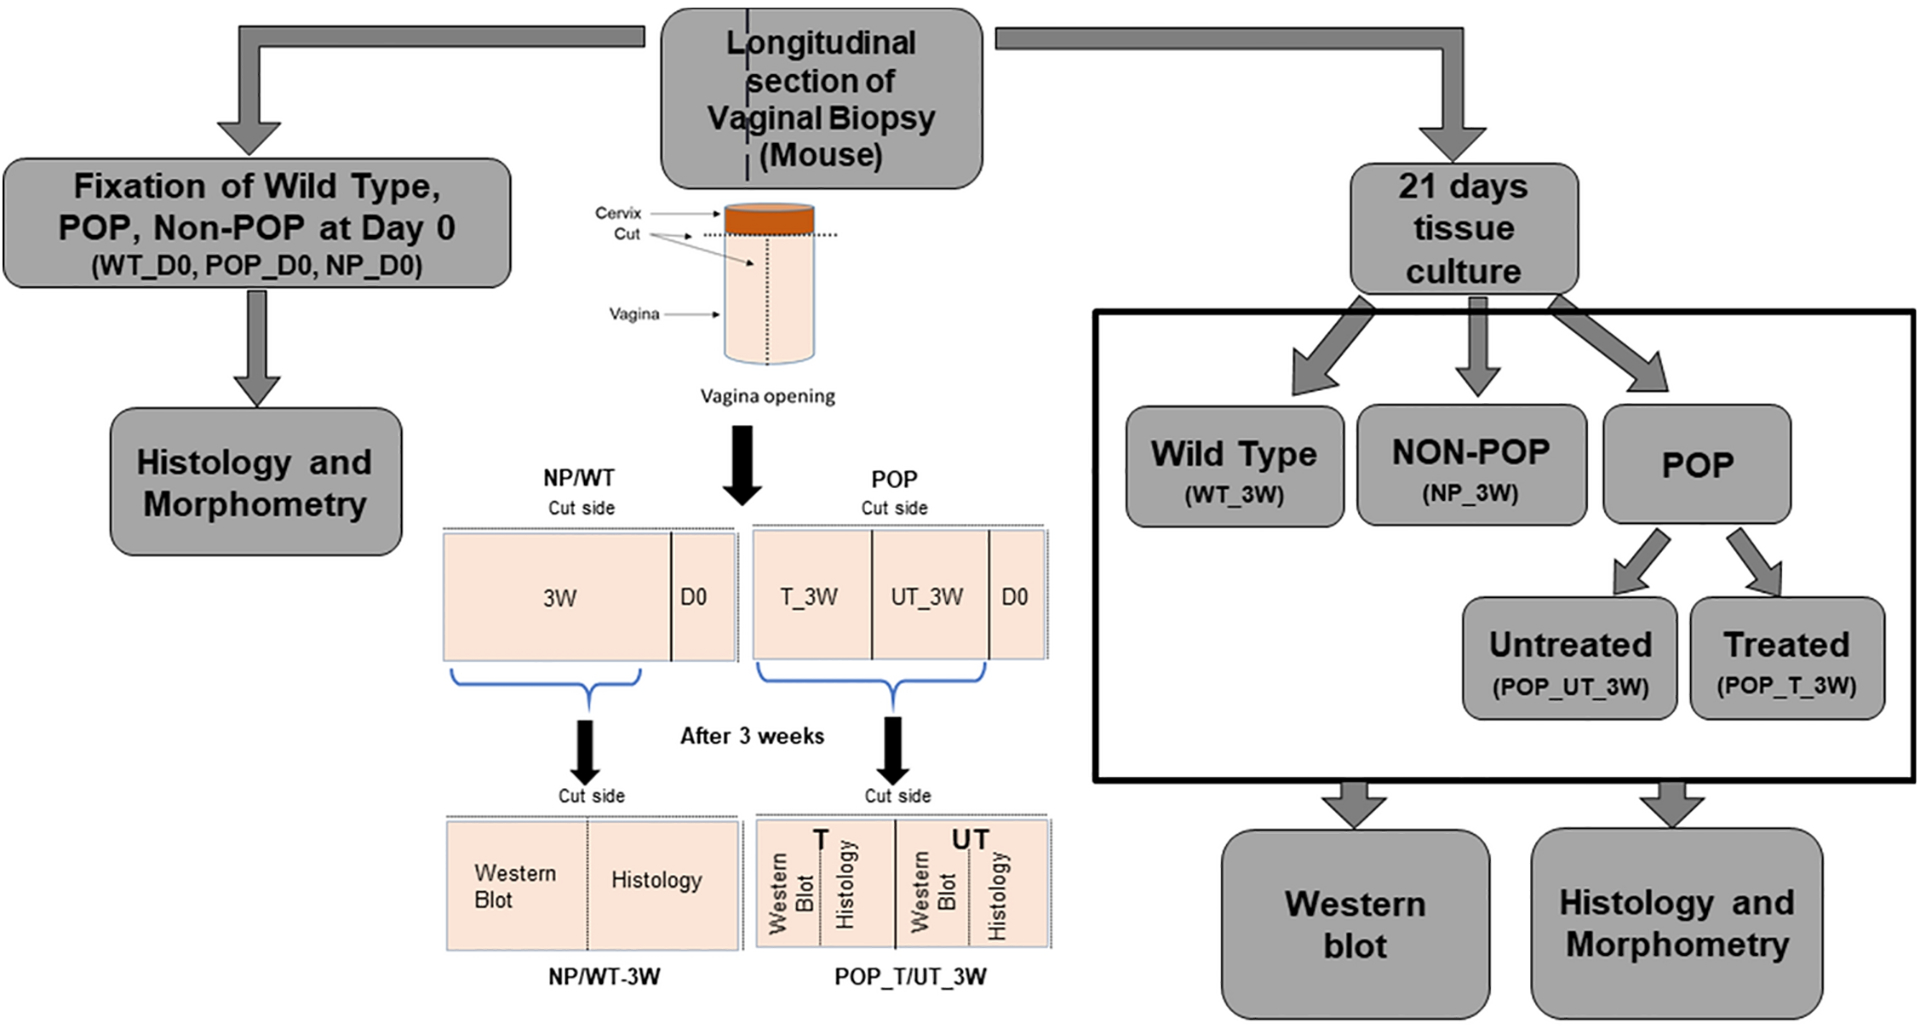
A segment of each longitudinal section of vaginal tissues was fixed immediately after euthanasia (day 0), for morphometric analysis. Vaginal tissues from wildtype (WT), multiparous non prolapsed (NP) and prolapsed (POP) mice with 0 days of culture (day 0) are represented as WT_D0, NP_D0, and POP_D0, respectively. The remainders of each vaginal tissue segment were cultured for three weeks with POP tissues further bisected and cultured without (control) or with (treatment) elastogenic factors (EFs). At the end of the culture period the tissues were processed for Western blot and morphometry. Wild Type, Non-POP, POP untreated and POP treated after three weeks are represented by WT_3W, NP_3W, POP_UT_3W, and POP_T_3W, respectively. The colored schematic in the center shows specimen orientation for sectioning and division of tissues for day 0 (D0) as well as three weeks (3W) culture. WT or NP tissues were handled similarly and are represented together, whereas POP tissues were prepared for tissue culture to enable both treated (T) and untreated (UT) tissue culture specimen.
For tissue processing, a segment of the harvested vaginal tissue was fixed immediately after tissue harvest (D0) for histology. The remainder of the vaginal tissue from mice in the WT and Non-POP groups was cultured as a whole for 3 weeks. The remaining vaginal tissue from mice in the POP group, after harvest of a segment for histology, was bisected and the respective halves cultured with and without EF treatment. Thus, at the end of the 3 weeks of culture, the POP tissue from each animal had 2 samples, one EF treated and the other untreated whereas WT and Non-POP tissues had a single untreated sample. At the end of the culture period, each of these tissues were bisected and the halves processed for histology and western blot, respectively. This process has been diagrammatically illustrated in Figure 1.
For extended culture, we used a simple static culture model that we have published earlier35 since the primary goal of this study is to develop a quantitative method to assess the morphological parameters of elastic fibers and the specific changes to the tissue elastic matrix with EF treatment. Hence, adopting a dynamic culture system would add an extra variable which would need precise control over biomechanical parameters complicating the system. Briefly, the tissues were pinned down in a rectangular cast silicone mold (3.8×2×1.5 mm) and cultured for 3 weeks in DMEM/F-12 medium containing 10% v/v FBS and 1% v/v penicillin-streptomycin (PS). The tissues were cultured in medium without (controls) and with supplements of TGF-β1 (5 ng/ml; Invitrogen, Carlsbad, CA) and HA-o (2 μg/ml). HA-o (MW~ 756 Da) was generated by hyaluronidase digestion of long chain HA as we have described previously12. Dosage of these EFs were based on that shown in a prior study to stimulate elastogenesis in cultures of NEVCs from LOXL1 KO mice20. In all cultures, the spent medium was changed every week with fresh addition of the treatments, where applicable. At the end of three weeks, a small piece of tissue from all groups was fixed, as mentioned above, for histology and the remaining tissues were biochemically assessed as decribed subsequently.
Western blots for matrix homeostasis proteins
Western blots were used to assess tissue inhibitor of metalloproteases-4 (TIMP-4), matrix metalloproteases-2 (MMP-2), matrix metalloproteases-9 (MMP-9) and lysyl oxidase (LOX) protein expression in tissues after 21 days in culture. The tissues were digested in a radio-immuno-precipitation assay (RIPA) buffer (Thermo Scientific) containing Halt™ protease inhibitor (Thermo Scientific). Samples (20 μl/lane) were loaded under reduced conditions into a 10% sodium dodecylsulfate polyacrylamide gel electrophoresis gel (SDS-PAGE) for analysis of MMP-2 and MMP-9 proteins, and into a 12% SDS-PAGE gel (Invitrogen, Carlsbad, CA) for analysis of LOX and TIMP-4 proteins. A BenchMark™ pre-stained molecular weight ladder (Invitrogen) and appropriate protein standards (positive controls) were also loaded onto the gels. The gels were wet transferred onto Immobilon-FL PVDF Membrane(Millipore, # IPFL20200), blocked for 1 h with Odyssey blocking buffer (LI-COR Biosciences, Lincoln, NE), and immunolabeled with primary antibodies (overnight at 4 °C), then secondary antibodies (1 h, 25 °C). Proteins were then detected using a LI-COR Odyssey scanning system. Commercial antibodies are shown in Table 1. Fluorescence intensities of the protein bands were quantified using Image Studio Lite software® (LI-COR Biosciences) and normalized to the intensities of their respective β-actin bands (housekeeping protein).
Table 1.
List of primary and secondary antibodies used for western analysis
| Antibody | Primary/Secondary | Dilution | Company/Catalog |
|---|---|---|---|
| TIMP-4 | Primary | 1:2000 | Abcam Ab58425 |
| MMP-2 | Primary | 1:2000 | Abcam Ab37150 |
| MMP-9 | Primary | 1:5000 | Millipore 04–1150 |
| LOX | Primary | 1:1000 | Santa Cruz SC-66948 |
| β actin | Primary | 1:5000 | Santa Cruz SC-47778 |
| Donkey anti-mouse | Secondary | 1:15000 | Li-Cor 926–68072 |
| Donkey anti-rabbit | Secondary | 1:15000 | Li-Cor 926–32213 |
Validation of morphometric method
For biochemical studies using elastase to validate our morphometry method, vaginal tissues were obtained from 6 additional 8 week old female WT mice. For validation study we were able to utilize animals as available even-if they were of different age than the ones used in main study because here degradation of the elastic matrix in the tissues was simulated in vitro by elastase treatment, and the effects compared to the same tissues prior to elastase treatment due to which the age of the animals was not relevant to our analysis. Each tissue piece was bisected longitudinally and lyophilized. The dry weights of both tissue halves were measured. One half of the lyophilized tissues was treated with 20 U/ml of porcine elastase (MP Biochemicals, LLC, Solon, OH) for 2 hours at 37 °C and the other half of the tissues was incubated (2 hours, 37 •C) with phosphate buffered saline (PBS; pH 7.4) as a control for elastase treatment. After 2 hours, the samples were spun down at 14000g for 10 minutes and the pelleted fraction digested with oxalic acid to solubilize the matrix elastin. The supernatants after each digestion were pooled together and the total elastin content within, measured. A colorimetric FASTIN assay (Accurate Chemical & Scientific Corporation, Westbury, NY) was performed to quantify the amount of elastin following the manufacturer’s protocol, as we have described previously20. An additional 6 17–20 week old female WT mice were euthanized to assess the effect of elastase on mophometry of vaginal tissues to validate the novel elastin morphometric method. Mice were euthanized and vaginas were harvested and halved longitudinally. As above, the tissues were pinned in a tissue culture mold and treated with elastase or PBS, as described above. Both elastase and PBS-treated tissues were fixed in 4% w/v PFA, embedded in paraffin, and cut into three 8-μm thick sections per slide to be stained for histology.
Morphometry for quantitative assessment of elastic fiber parameters
An Image-Pro Plus®-based morphometry method was used to quantify elastin content and elastic fiber parameters in the tissue sections. All the tissues collected either at day 0 or after 3 weeks of culture as described previously, were fixed in 4% w/v PFA, paraffin-embedded, and cut as 5-μm thick sections. The sections were stained with a modified Hart’s stain prepared only with 1 volume of Weigert’s iron resorcin fuschin and 9 volumes of 1% v/v hydrochloric acid in 70% v/v ethanol. This stain is different from the traditional Hart stain in that it has only two colors, yellow for cytoplasm and purple for elastin whereas in the former there are 4 colors, red for collagen, yellow for cytoplasm, blue for nuclei and purple for elastic fibers (Example images in Fig 3). Tissues from each of the 6 animals in each group were cut into three sections resulting in a total of 18 sections per group. For analysis, the slides were scanned using a Leica Aperio AT2 slide scanner at 20× magnification to obtain the image of each whole section in a .tiff format.
Figure 3. Examples of tissue sections.
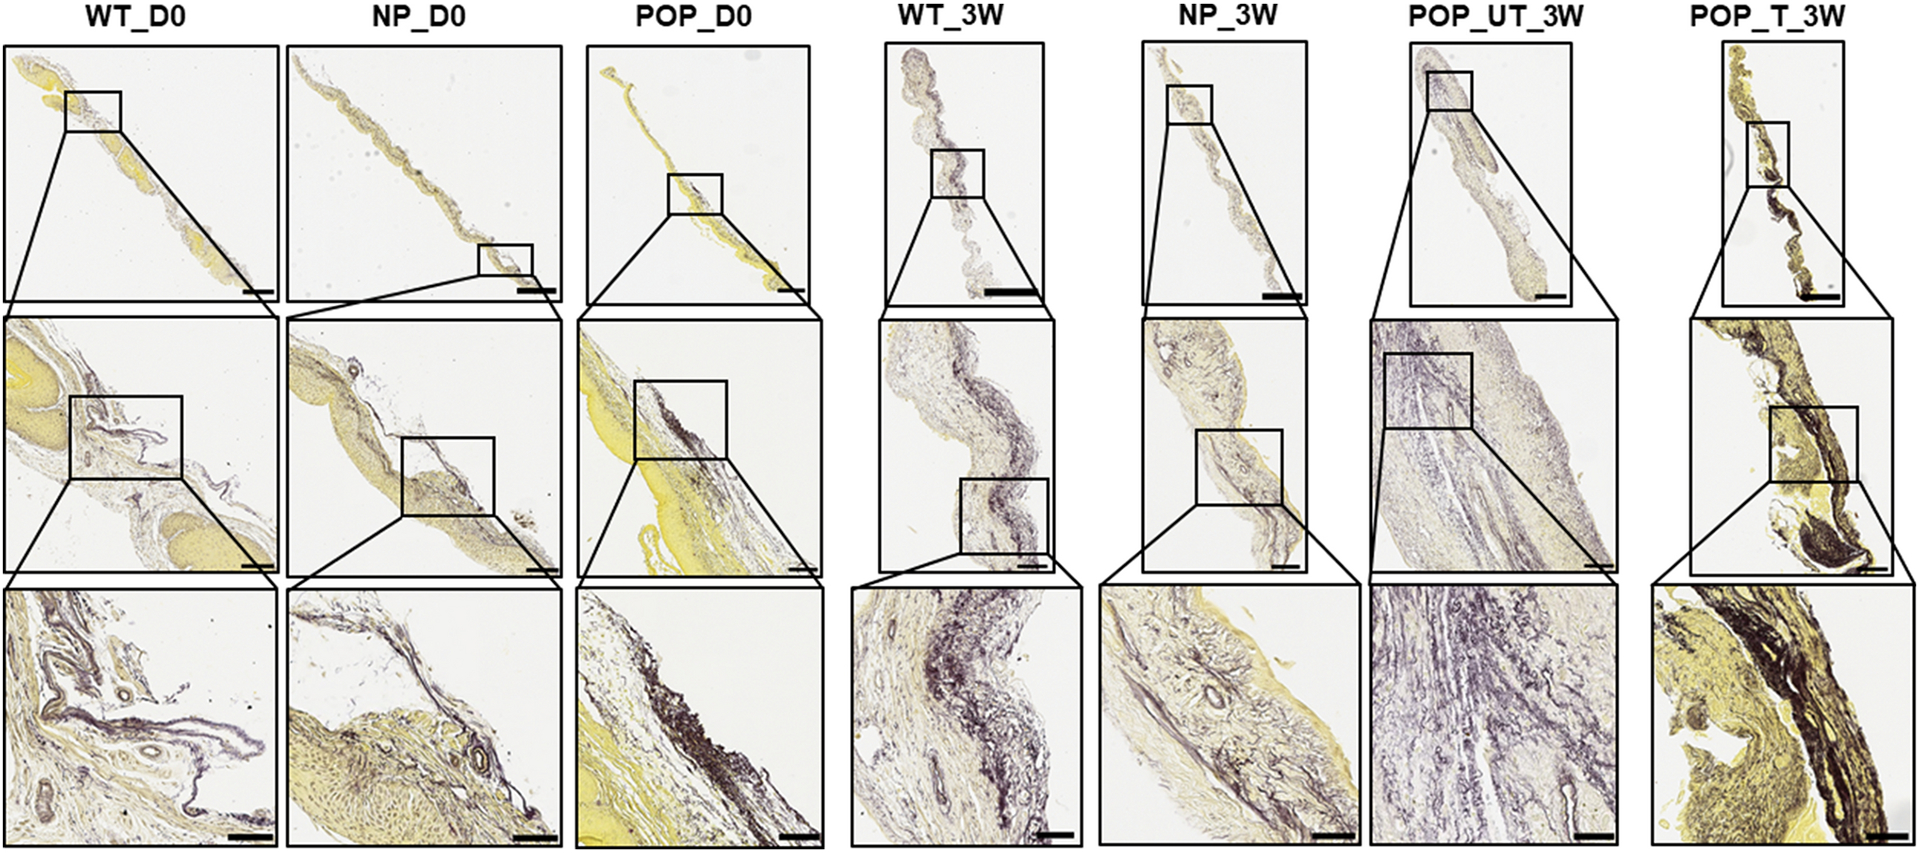
Example tissue cultures of transverse vaginal tissue sections (8 μm thick) of the mice groups listed in Figure 1 stained with modified Hart’s stain, and shown at different magnifications. Vaginal tissues from wildtype (WT), multiparous non-prolapsed (NP), and prolapsed (POP) mice with 0 days of tissue culture (D0) are represented as WT_D0, NP_D0, and POP_D0, respectively. WT, NP, POP untreated (UT) and POP treated (T) vaginal tissues after three weeks (3W) of tissue culture are represented by WT_3W, NP_3W, POP_UT_3W, and POP_T_3W, respectively. Yellow indicates cytoplasm and purple indicates elastin with black representing more dense elastin. In WT_D0 and NP_D0, continuous fibers are seen whereas in POP_D0 the fibers are seen to be more fragmented and clustered. After 3 weeks of culture, WT_3W and NP_3W do not change much. POP_UT_3W is seen to have even more fragmentation whereas POP_T_3W is seen to have thicker and more continuous fibers. Scale bar: top row: 500μm, middle row: 100μm, bottom row: 50μm. Images in rows 2 and 3 are the region inside the box in rows 1 and 2 respectively.
For morphometric analysis, each image was opened in Image-Pro Plus® (Fig 2A) and spatially calibrated. After calibration, a new region of interest (ROI) was identified for each image by selecting the entire tissue specimen in each image (Fig 2B). The software dropper tool was used to manually select pixels corresponding to elastin in each image to avoid any bias if it existed, due to variation in stain uptake by different specimens and due to this reason the final color range mask was not applied to all images in the set. A pixel size of 1×1 microns was selected to match the diameter of a typical mature elastic fiber. Pixels corresponding to modified harts-stained elastin (color range from dark purple to black) were identified and highlighted in red upon selection (Fig 2C & D). Similar pixels throughout the specimen were automatically highlighted by selecting in one location. Any pixels selected accidentally could be unselected using the undo tool. The red highlights disappeared upon subsequently saving the file.
Figure 2. Graphical methods of morphometric analysis.
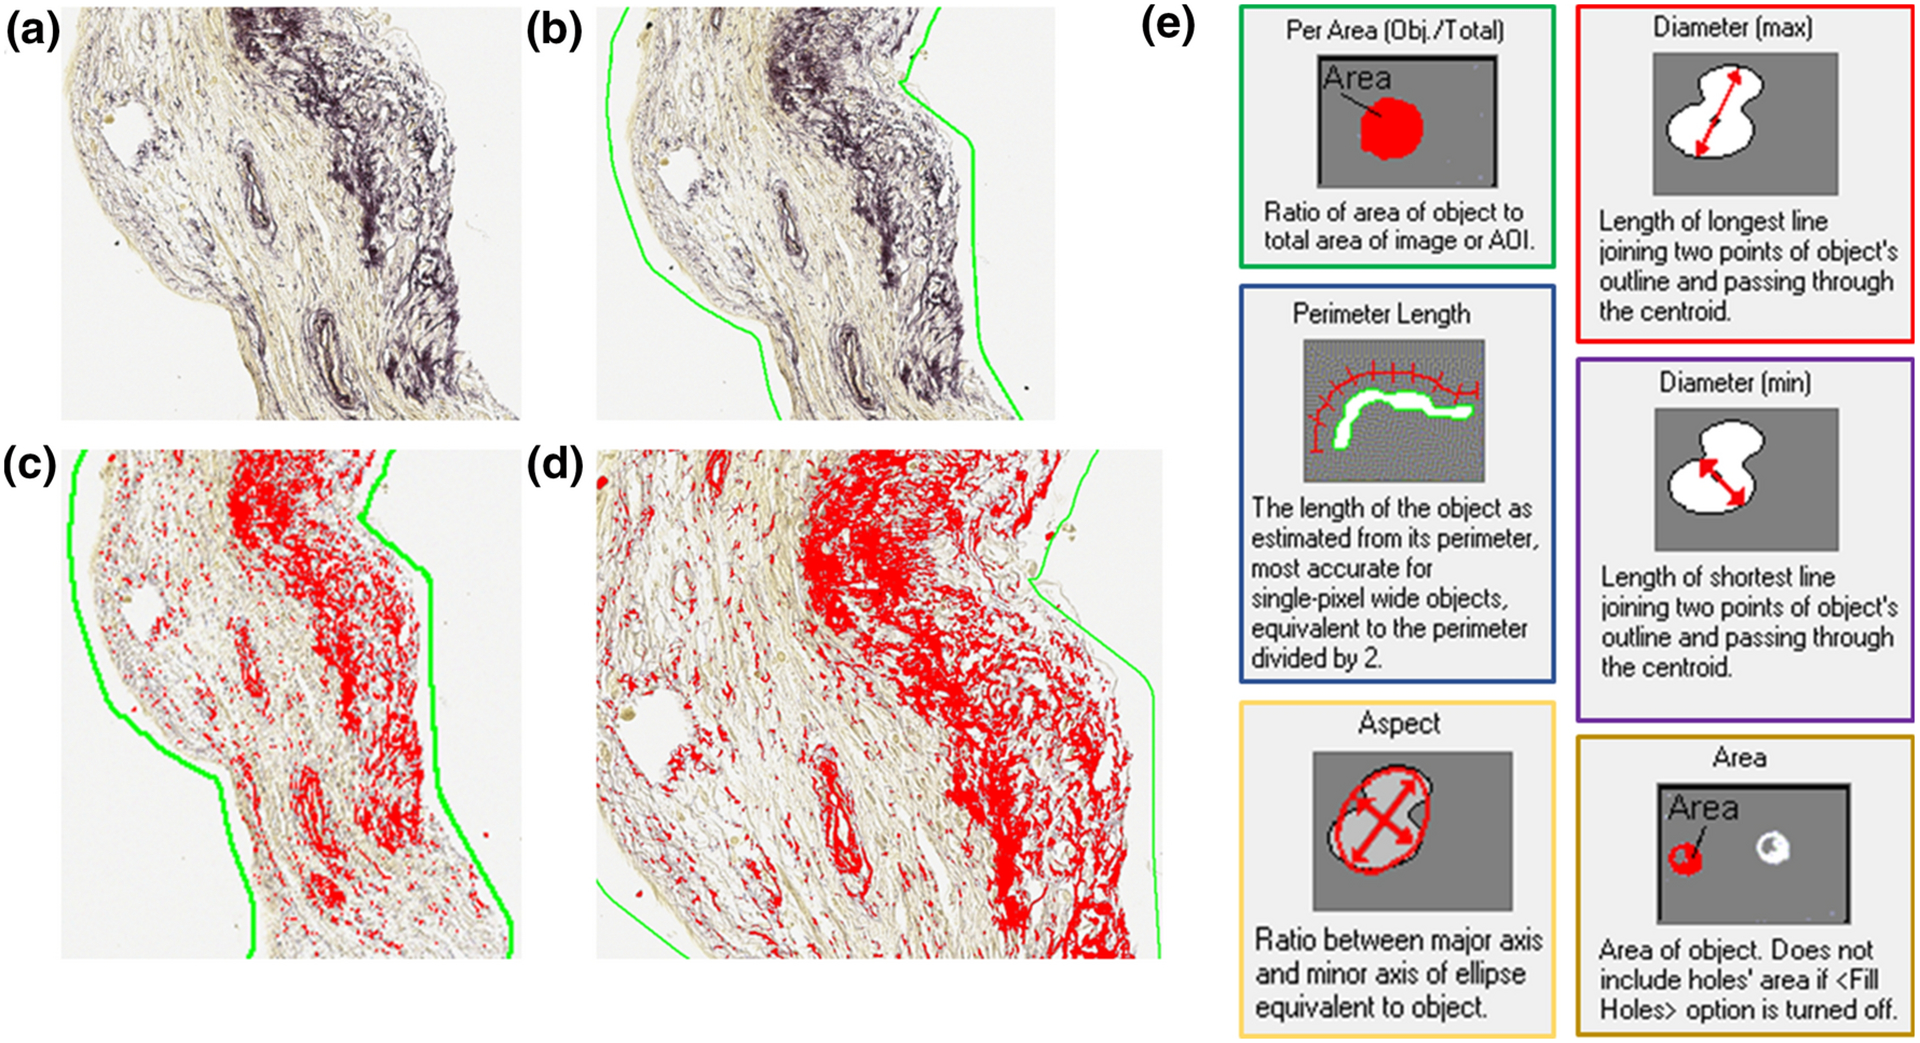
An example modified Hart’s stained transverse section of vaginal tissue. Yellow indicates the cytoplasm and dark blue/black indicates elastic fibers (A-D). The green line around the tissue section in B shows the area of interest (AOI) drawn around the tissue section. Red in C indicates elastin deposits automatically selected as objects, using Image-Pro Plus® software. A higher magnification view of images in C is shown in D, and indicates individual objects. Parameters calculated from morphometric analysis include density (Per Area), diameter (max), diameter (min), perimeter length, aspect ratio, and area of objects (E). In addition to these six parameters we also measured tortuosity of the objects, defined as the ratio of perimeter length to end-to-end distance or maximum diameter.
To quantify important aspects of elastin in the sections using the software, we focused on the following parameters: a) Area, defined as the area of each object identified as elastin, b) Percent Area, defined as the area of objects identified as elastin as a percentage of the total region of interest, c) Maximum Diameter, defined as length of longest line joining two points of an object’s outline and passing through the centroid, d) Perimeter Length, defined as the length of each object as estimated from its perimeter, equivalent to half the perimeter, e) Minimum Diameter, defined as the length of the shortest line joining two points of each object’s outline passing through the centroid, f) Tortuosity, defined as ratio of perimeter length to end-to-end distance and mathematically represented as the ratio of perimeter length to maximum diameter, g) Aspect Ratio of the fiber, defined as the ratio of the major to the minor axes of an ellipse equivalent to each object and h) Angle, defined as the angle between major axis and minor axis of elastin objects identified by the software. Size limitations (maximum and minimum allowed) for each parameter were defined to be within the range of values typical of mature elastic fibers (Table 2)16. Image-Pro Plus® software considered adjacent pixels of the same color as one object and returned the value of different parameters for each object within the region of interest. The parameters are automatically defined by the software as shown in Fig 2E. The number of objects was counted by the software. The values for each object were exported for statistical analysis. The repeatability of the results was confirmed by having different users perform analysis of the same section(s). The detailed protocol is available at https://figshare.com/s/41e75ff89e6f53e3bbef.
Table 2.
Size ranges for object selection
| Parameters | Start | End |
|---|---|---|
| Area | 1 μm2 | 1e+008 μm2 |
| Aspect ratio | 1 | 1,000,000 |
| Diameter (max) | 1 μm | 1,000,000 μm |
| Diameter (min) | 1 μm | 500,000 μm |
| Percent Area (Area of object/ Area of Region of Interest × 100) |
0 | 1 |
| Perimeter Length | 1 μm | 1,000,000 μm |
“Start” refers to the minimum allowed value for selection and “End” refers to the maximum allowed value for selection of the objects identified as elastin for each morphometric parameter. The values of these parameters for mature elastic fibers fall between “Start” and “End”.
Statistical Analysis
Statistical analysis was performed using SAS ver.9.4 software. The methods of mixed models regression were used to analyze differences in response means and variability for outcomes of interest as a function of mouse populations. Custom contrasts were constructed to examine differences in group means since only certain pairwise comparisons were needed to test the hypotheses regarding differences in elastin morphometry parameters with LOXL1 KO, with POP, with EF treatment, and with tissue culture (Table 3). In each instance Bonferroni corrections were made to adjust for multiple comparisons within an outcome. The mean of object area, aspect ratio, maximum diameter, minimum diameter, and perimeter length were analyzed (Table 4). The large data set for assessing differences in means required a random effects statement for animals and a nesting of repeated measures for objects within each animal. In all cases p < 0.05 indicated a stastically significant difference between groups.
Table 3.
Specific pairwise comparisons used to test hypotheses
| Outcomes | Comparisons |
|---|---|
| Effect of Elastogenic Factor (EF) Treatment | POP_UT_3W vs POP_T_3W |
| Effect of Prolapse | NP_D0 vs POP_D0 NP_3W vs POP_UT_3W |
| Effect of LOXL1 Knock Out | WT_D0 vs NP_D0 WT_3W vs NP_3W |
| Effect of Culture | WT_D0 vs WT_3W NP_D0 vs NP_3W POP_D0 vs POP_3W |
Vaginal tissues from wildtype (WT), multiparous non prolapsed (NP) and multiparous prolapsed (POP) mice with 0 days of culture (D0) are represented as WT_D0, NP_D0, and POP_D0, respectively. WT, NP, POP untreated (UT) and POP treated (T) after three weeks (3W) of culture are represented by WT_3W, NP_3W, POP_UT_3W, and POP_T_3W, respectively.
Table 4.
Types of statistical comparisons made for different parameters
| Statistical Comparison | |||
|---|---|---|---|
| Parameters | Average | Total | Variability |
| Area | ✓ | ✓ | |
| Aspect Ratio | ✓ | ||
| Maximum Diameter | ✓ | ✓ | |
| Minimum Diameter | ✓ | ✓ | |
| Percent Area | ✓ | ||
| Perimeter length | ✓ | ||
| Tortuosity | ✓ | ✓ | |
The variability in angles was analyzed an taken as a measure of anisotropy of arrangement of elastic fibers (Table 4). Variability of maximum and minimum diameters were also analyzed to assess the range of sizes of elastin fibers (Table 4). Total percent area of elastin was analyzed as a measure of total elastin quantity normalized to the region of interest. The smaller size of the data for variability and total percent area allowed the use of repeated measures mixed models with compound symmetry defining the covariance structure of the data. As above, custom contrasts with Bonferroni corrections were used to evaluate only those mouse group differences which were considered physically meaningful. In all cases adjusted p value of < 0.05 indicated a statistically significant difference between groups.
Western Blot data consisted of a single measure for each protein per mouse. The data was analyzed using mixed models regression methods. Custom contrasts with Bonferroni corrections were used to assess those pairwise comparisons of interest. For all comparisons, statistically significant differences were determined by p < 0.05.
Results
Validation of morphometry method
The FASTIN assay indicated significantly decreased elastin content (μg of elastin/mg of dry weight) in tissues treated with elastase vs PBS treated controls (p = 0.002; Fig 4B). Consistent with the results of the FASTIN assay, the total percent area values from morphometry were significantly decreased (p = 0.002) in elastase-treated tissues (Fig 4E). Morphometric analysis also showed maximum diameter (p = 0.04; Fig 4C) and perimeter length of elastin fibers (p = 0.03; Fig 4D) to be significantly increased in elastase-treated tissues. The mean area occupied by elastic fibers was significantly increased (p = 0.02; Fig 4F) while the number of elastic fibers was significantly decreased(Fig 4G) in elastase-treated tissues compared to PBS-treated controls.
Figure 4. Validation of morphometry method with elastase and saline treated specimen.
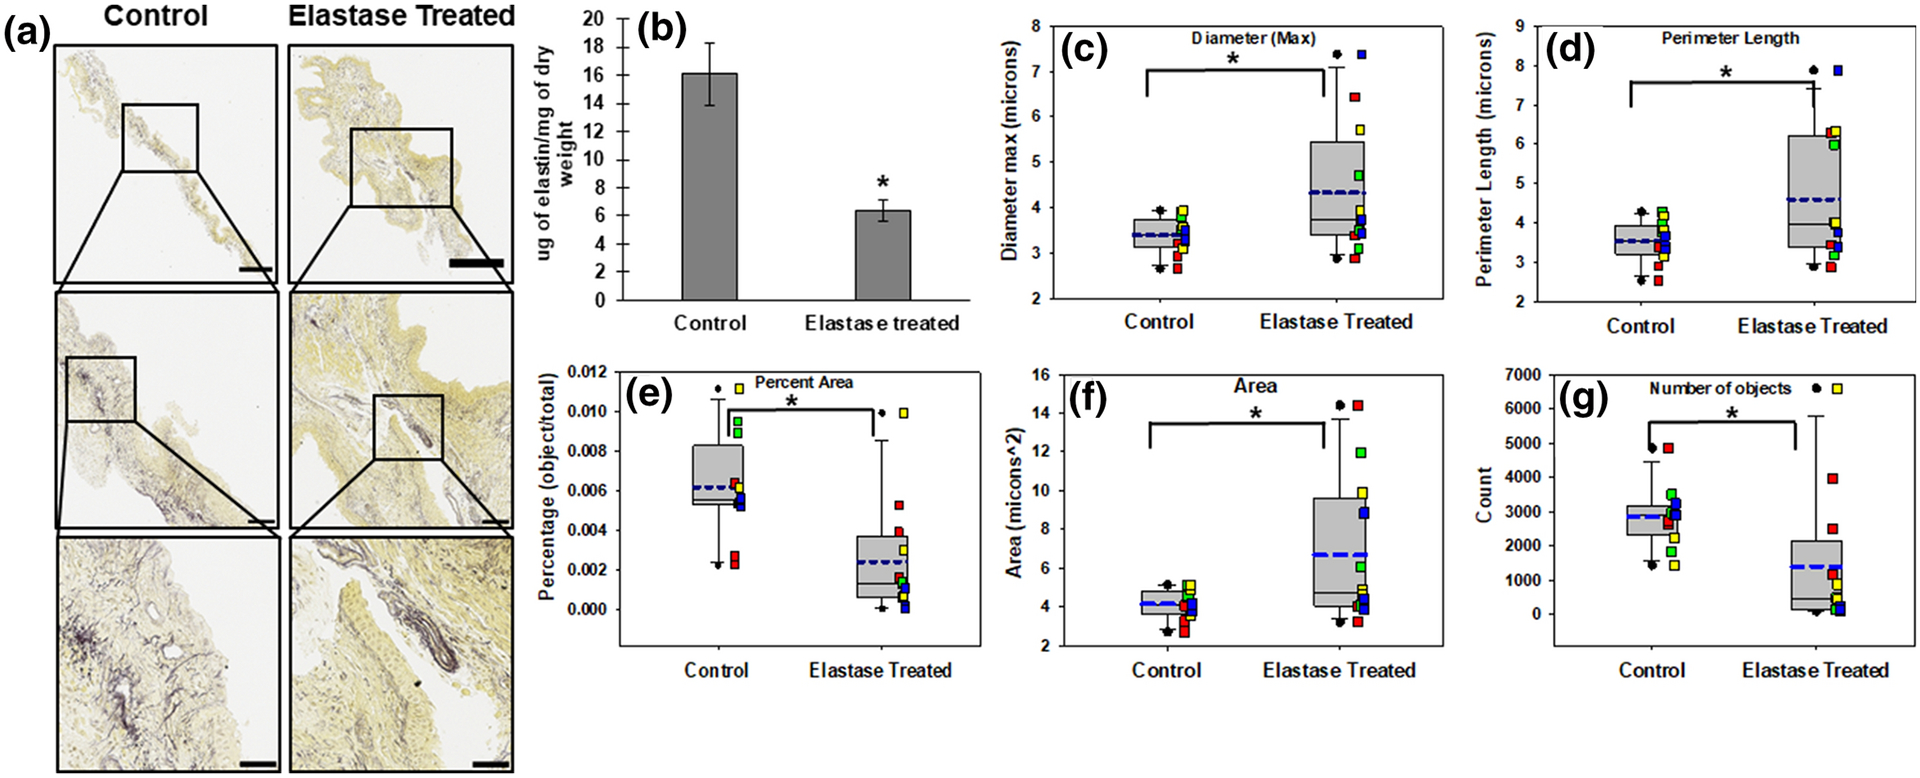
Example of transverse vaginal tissue sections (8 μm thick) stained with modified Hart’s stain, and shown at different magnifications (A). Yellow stain indicates cytoplasm and blue/black indicates elastin with black representing denser elastin. Scale bar in the top row: 500μm, middle row: 100μm, bottom row: 50μm. Images in rows 2 and 3 are the area in the box in rows 1 and 2 respectively. Quantity of matrix elastin as measured by FASTIN assay (B). Each bar in B represents mean ± SE of data from four animals. As detailed in the Methods section, morphometric analysis quantified maximum elastin fiber diameter (C), perimeter length of elastin fibers (D), percent area of elastin (E), mean area of elastin fibers (F) and number of elastin fiber objects (G). Box plots in C-G represent median (solid line) with 25/75% confidence interval; whiskers indicate 5/95% confidence interval; black circles indicate outliers; blue dashed lines indicate the mean. Data was collected from 4 animals in each group with 3 histological sections per animal for a total of 12 sections. Each colored square corresponds to sections from same animal. * indicates a statistically significant difference (p < 0.05) in mean between the groups connected by the bar above the box plots.
Expression of Proteins Involved in Elastin Homeostasis
Western Blot analysis of the expression of elastin homeostasis proteins after 3 weeks of tissue culture did not show statistically significant differences between the mouse groups for any of the comparisons made (Table 5).
Table 5.
Western Blot results for expression of elastin homeostasis proteins
| Elastin Homeostasis Proteins | Intensity normalized to β-actin (mean ± SD) | |||
|---|---|---|---|---|
| WT_3W | NP_3W | POP_UT_3W | POP_T_3W | |
| LOX Zymogen (50kDa) | 0.07 ± 0.03 | 0.06 ± 0.03 | 0.07 ± 0.07 | 0.09 ± 0.02 |
| LOX Active (28 kDa) | 0.001 ± 0.001 | 0.001 ± 0.001 | 0.003 ± 0.003 | 0.01 ± 0.01 |
| MMP2 Zymogen (72 kDa) | 0.46± 0.11 | 0.45 ± 0.1 | 0.62 ± 0.31 | 0.73± 0.51 |
| MMP2 Active (66 kDa) | 0.92 ± 0.24 | 0.70 ± 0.17 | 1.43 ± 1.19 | 0.98 ± 0.56 |
| Total MMP2 (72+66 kDa) | 1.31 ± 0.24 | 1.16 ± 0.27 | 2.05 ± 1.49 | 1.77 ± 0.80 |
| MMP9 (82 kDa) | 0.01 ± 0.002 | 0.01 ± 0.002 | 0.01 ± 0.003 | 0.02± 0.01 |
| TIMP 4 (26 kDa) | 5.79 ± 1.24 | 5.77 ± 1.35 | 3.36 ± 2.58 | 2.12 ± 0.91 |
Vaginal tissues from wildtype (WT), multiparous non prolapsed (NP), and multiparous prolapsed (POP) mice, which were either treated (T) or untreated (UT) for three weeks (3W) of tissue culture are represented by WT_3W, NP_3W, POP_UT_3W, and POP_T_3W, respectively.
Effect of treatment
Treatment of POP tissues in tissue culture with exogenous EFs resulted in significant increases in the mean (p < 0.0001) and variability of the area (p = 0.004; Fig 5A) occupied by elastic fibers compared to untreated tissues. Total percent area also increased with treatment (p = 0.006; Fig 5B). Variability in the maximum (p = 0.006) and minimum (p < 0.001) diameters (Fig 6) decreased whereas mean perimeter length (p < 0.0001; Fig 6B) of elastin fibers also increased in the treated vs untreated POP tissues.
Figure 5. Total area (A) and Percent area (B) of elastin in the mouse groups and with and without treatment with elastogenic factors.
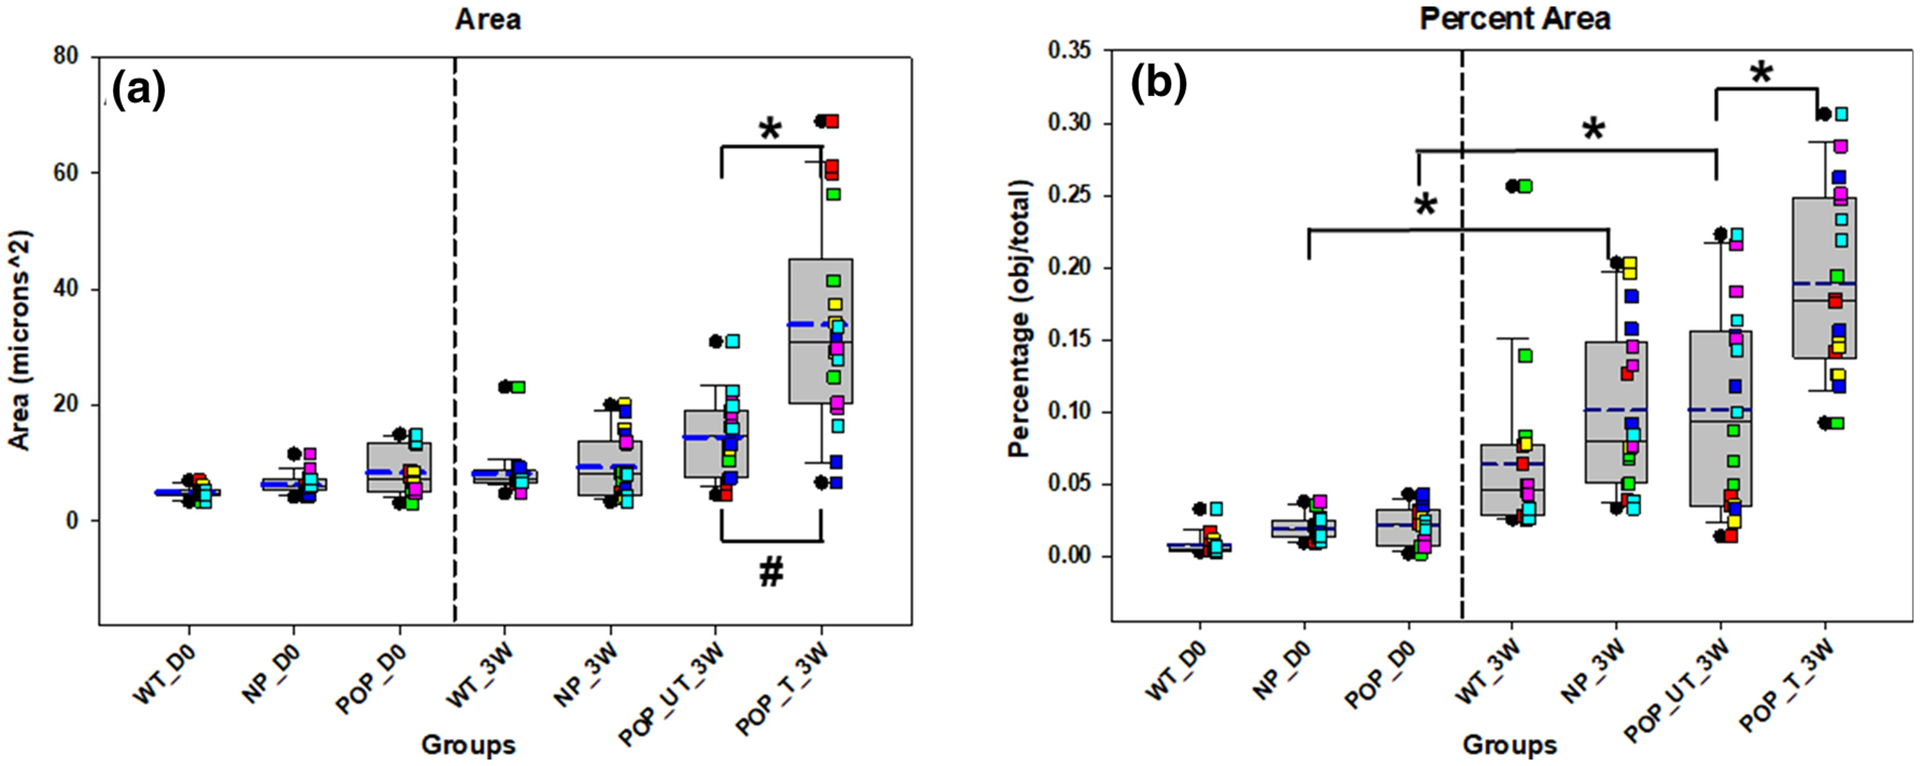
Each box plot represents median (solid line) with 25/75% confidence intervals; whiskers indicate 5/95% confidence intervals; black circles indicate outliers and blue dashed lines indicate the mean. Data was collected from 6 animals in each group with 3 histological sections per animal for a total of 18 sections. Each colored square corresponds to sections from same animal. Vaginal tissues from wildtype (WT), multiparous non prolapsed (NP), and prolapsed (POP) mice with 0 days of tissue culture (D0) are represented as WT_D0, NP_D0, and POP_D0, respectively. WT, NP, POP untreated (UT) and POP treated (T) vaginal tissues after three weeks (3W) of tissue culture are represented by WT_3W, NP_3W, POP_UT_3W, and POP_T_3W, respectively. * indicates a statistically significant difference in mean between the groups indicated by the bar and # indicates a statistically significant difference in variability between the two groups indicated by the bar (p < 0.05).
Figure 6. Maximum Diameter (A), perimeter length (B) and Minimum Diameter of elastin in the mouse groups and with and without treatment with elastogenic factors.
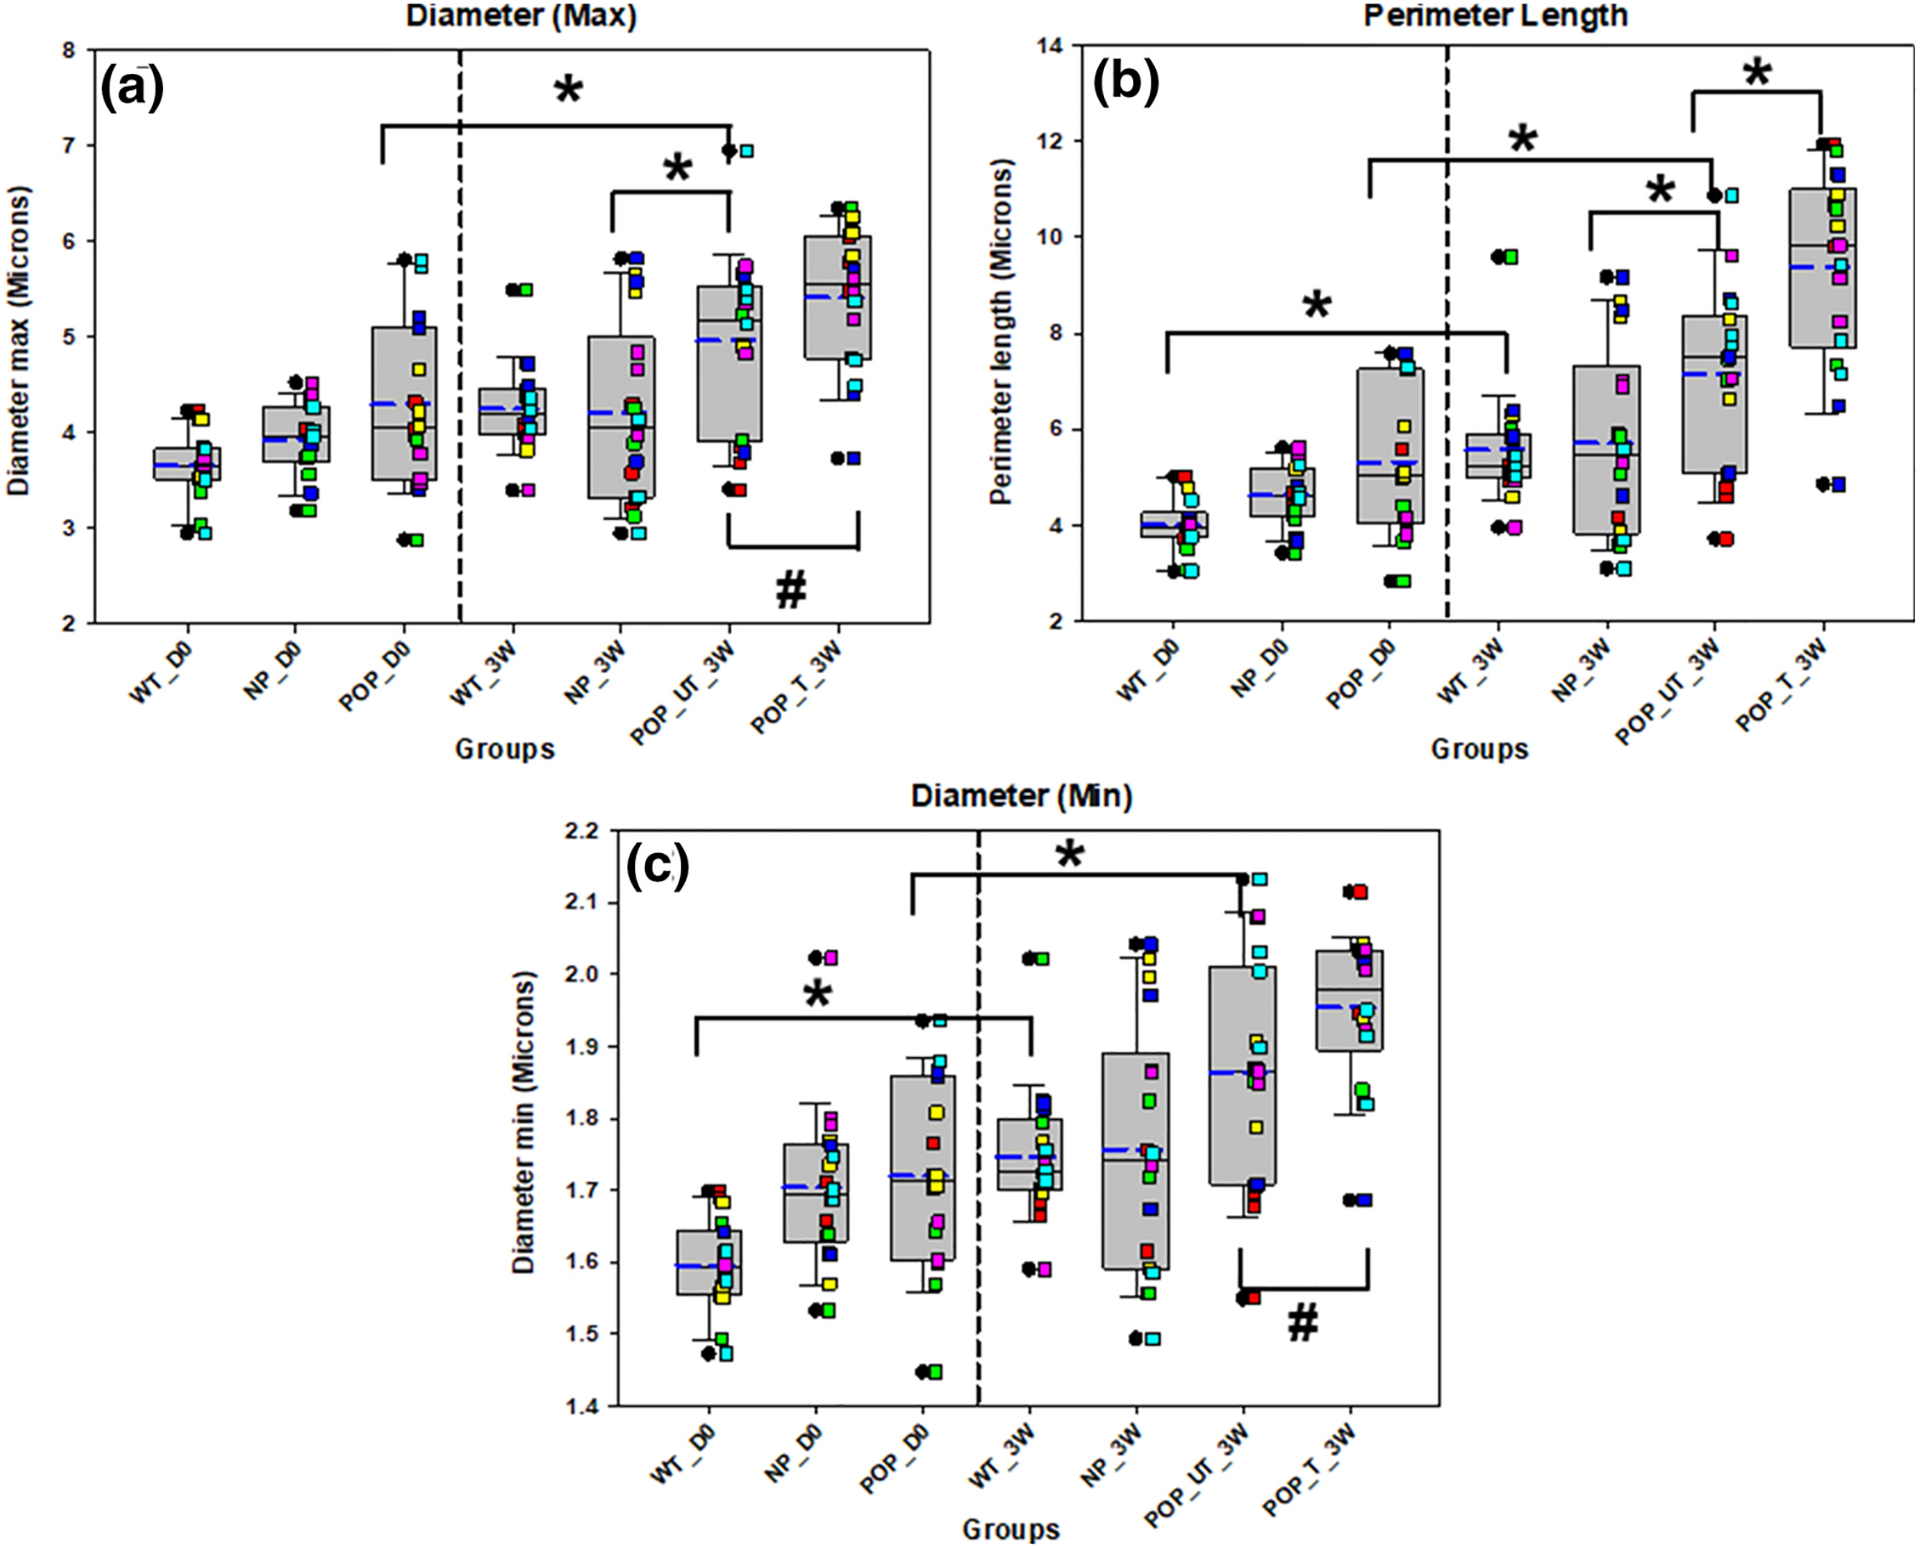
* indicates a statistically significant difference in mean between the groups indicated by the bar and # indicates a statistically significant difference in variability between the groups indicated by the bar (p < 0.05). Each bar represents mean ± SE of data from six animals. The box plot represents median (solid line) with 25/75% confidence interval; whiskers indicate 5/95% confidence interval; black circles indicate outliers and blue dashed lines indicate the mean. Data was collected from 6 animals in each group with 3 histological sections per animal for a total of 18 sections. Each colored square corresponds to sections from same animal. Vaginal tissues from wildtype (WT), multiparous non prolapsed (NP), and prolapsed (POP) mice with 0 days of tissue culture (D0) are represented as WT_D0, NP_D0, and POP_D0, respectively. WT, NP, POP untreated (UT) and POP treated (T) vaginal tissues after three weeks (3W) of tissue culture are represented by WT_3W, NP_3W, POP_UT_3W, and POP_T_3W, respectively.
Effect of KO
Tissues harvested from mice and assessed without culture (D0) demonstrated no significant differences in morphometric outcomes with the absence of LOXL1, when tissues from nonprolapsed LOXL1 KO and WT mice were compared. After 3 weeks of tissue culture, the mean aspect ratio of elastin fibers was significantly decreased in tissues from nonprolapsed LOXL1 KO mice compared to WT mice (p = 0.015; Fig 7).
Figure 7. Tortuosity (A) and aspect ratio (B) of elastin in the mouse groups and with and without treatment with elastogenic factors.
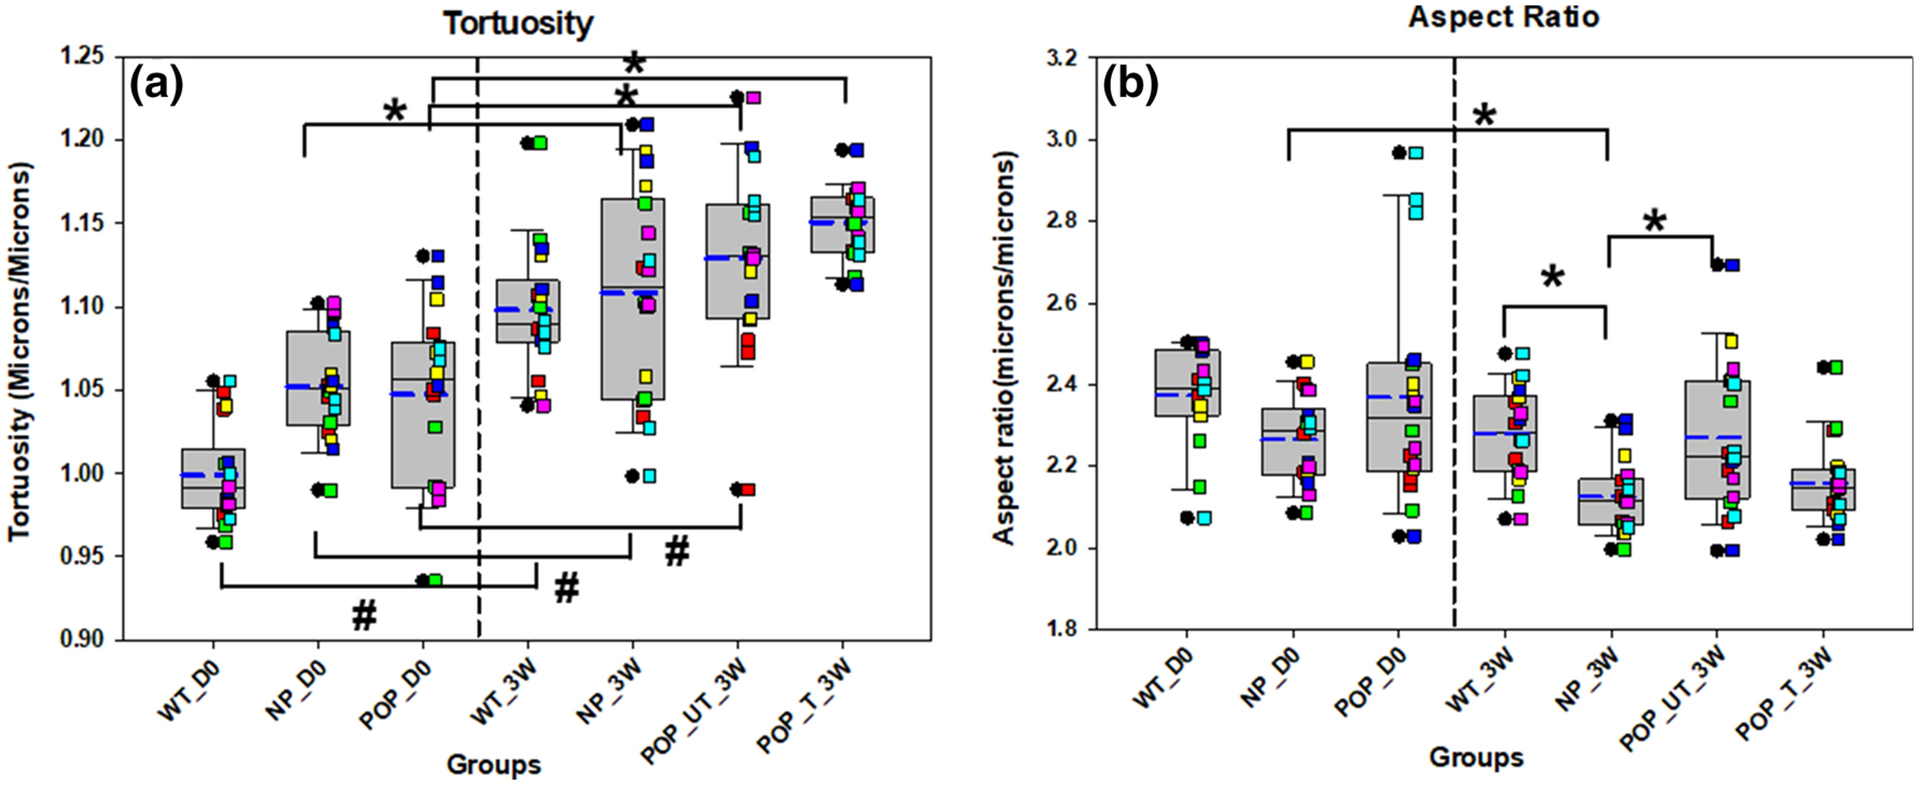
* indicates a statistically significant difference in mean between the groups indicated by the bar and # indicates a statistically significant difference in variability between the groups indicated by the bar deemed for p < 0.05. Each bar represents mean ± SE of data from six animals. The box plot represents median (solid line) with 25/75% confidence interval; whiskers indicate 5/95% confidence interval; black circles indicate outliers and blue dashed lines indicate the mean. Data was collected from 6 animals in each group with 3 histological sections per animal for a total of 18 sections. Each colored square corresponds to sections from same animal. Vaginal tissues from wildtype (WT), multiparous non prolapsed (NP), and prolapsed (POP) mice with 0 days of tissue culture (D0) are represented as WT_D0, NP_D0, and POP_D0, respectively. WT, NP, POP untreated (UT) and POP treated (T) vaginal tissues after three weeks (3W) of tissue culture are represented by WT_3W, NP_3W, POP_UT_3W, and POP_T_3W, respectively.
Effect of prolapse
Tissues harvested from LOXL1 KO mice and assessed without culture (D0) demonstrated no significant differences in morphometric outcomes with prolapse. In contrast, there was a significant increase in mean maximum elastic fiber diameter (p = 0.010), perimeter length (p = 0.039), and aspect ratio (p = 0.031), after 3 weeks of culture (Fig 6, 7).
Effect of culture
Fiber perimeter length (p = 0.015), mean minimum diameter (p = 0.002), and mean (p < 0.0001) and variability (p < 0.0001) of tortuosity were significantly increased with 3 weeks of culture in WT mice (Figs 6 & 7). Mean (p < 0.0001) and variability (p = 0.001) of tortuosity, as well as total percent area (p = 0.014) were significantly increased with 3 weeks of culture in NP mice (Figs 5 & 7). In contrast, mean aspect ratio (p = 0.042) was significantly decreased with 3 weeks of culture in NP mice (Fig 7). There were also significant increases in the total percent area of elastin (p = 0.015), mean maximum diameter (p = 0.042), mean minimum diameter (p = 0.005), mean perimeter length (p = 0.004), and mean (p < 0.0001) and variability (p = 0.001) of tortuosity with 3 weeks of culture in POP mice (Figs 5–7).
Discussion
The extracellular matrix (ECM), which provides a structural framework to connective tissues, also intimately regulates biomechanical properties 6. Disrupted ECM or aberrations of ECM neoassembly and repair can critically impact tissue pathophysiology in proteolytic disorders, such as POP22. Collagen and elastin are the primary components of the structural ECM, which provide tissues stiffness, and stretch and recoil properties, respectively21,42. ECM remodeling is a dynamic process involving both synthesis of matrix components and their degradation by MMPs, with the latter processes regulated by TIMPs3. Previous studies have shown the elastin crosslinker protein, desmosine, to be an indicator of fiber maturation33 and have used desmosine content as a measure to deduce degenerative or regenerative changes to elastic tissues including in response to stimulation27. Assessing ECM compositional changes is challenging since both collagen and elastic matrix assembly are complex, and because elastin is highly insoluble22 due to its hydrophobicity and crosslinked nature17,29,32, thus rendering it difficult to extract for analysis. Thus, estimating elastin from desmosine and isodesmosine crosslink content can be misleading if the matrix is incompletely solubilized, or if elastin crosslinking is altered in POP22. Moreover, changes to tissue mechanics are also critically influenced by independent alterations in structure and characteristics of the elastic fibers themselves, which a desmosine assay does not provide any insight about. Hence, there is value in developing a complementary assessment technique to desmosine analysis. While gene expression can highlight changes in cell metabolic activity, the trends are highly transient and do not indicate protein synthesis/content, fiber properties and post translational modification of the elastic fibers, or trace long-term disease history22.
In this scenario, histological and immunohistochemical analysis involving semi-quantitative assessments of changes to different ECM components in POP and tissues obatained from other proteolytic conditions, are promising22. To date, histology has shown increased elastic fiber thickness and amount of elastin in vaginas of women with POP13. Inferences have been primarily drawn from discernable visual assessments of changes to matrix content, distribution, and form and their classification with arbitrary grading scales30. Morphometric techniques to quantitatively estimate content and structural aspects of elastic fibers have the potential to elucidate the mechanisms and consequences of POP and more broadly, the pathophysiologic processes in proteolytic disorders.
Impaired elastic matrix remodeling after vaginal delivery has been commonly linked with POP development 26. No pharmacotherapy currently exists for POP 20,26. Previously, we have shown that HA-o and TGF-β1 significantly stimulate elastic fiber assembly and crosslinking of elastogenically deficient cell types such as aneurysmal vascular smooth muscle cells (SMCs)7 and by NEVCs from a LOXL1 KO mouse model of POP20. Since we showed that tropoelastin (elastin precursor) synthesis is unaffected by these EFs, increased elastic matrix was attributed to possible changes in one or more steps in the process of elastic fiber assembly and maturation. In the absence of robust tools to quantitatively assess elastic fiber characteristics, we have developed a morphometric technique applicable to elastin-stained histological tissue sections and validated it by assessing stimulated elastic fiber assembly in EF-treated cultures of prolapsed vaginal wall tissue from the LOXL1 KO mouse model of POP7,20. In this study, our tissues were cultured in a static culture system we have described previously35. While dynamic flexure of the tissue constructs can influence fiber alignment and orientation, adoption of a dynamic culture system in this study would need precise control over biomechanical regimens to ensure that these do not confound and introduce variability in our results. Pursuing this would detract from the primary goal of this study, which is to develop a method to quantitatively assess the morphological parameters of elastic fibers and see the specific changes to the tissue elastic matrix with EF treatment. Since LOXL1 gene KO, manifestation of POP, and tissue culture may also impact elastic matrix homeostasis, we determined in a hierarchical manner, these effects on elastic fiber characteristics.
As might be expected, the percentage area of elastin and number of objects identified as elastin in our histological images was consistent with FASTIN analysis, which indicated lower elastic matrix content in elastase-digested tissues. While morphometry indicated larger elastin deposits in the elastase-treated sections, which might be deemed contrary to expected fragmentation of elastic fibers upon elastase digestion, the size of these deposits (mean diameter >4 microns) suggests that they are not fibers (typical diameter ~0.5–2.5 microns) but rather larger clusters of elastin deposits. The re-clustering of elastin into these aggregates may be incited by abnormal accumulation of glycoprotein (fibrillin) microfibrils (pre-scaffolds onto which crosslinked elastin aggregates coalesce to form fibers) during elastolysis, as has been reported in literature14,23.
The diameter, perimeter length and aspect ratios of elastin deposits in freshly isolated NP tissues (NP_D0) from the KO animals vs WT_D0 were not statistically significant. The aspect ratios of elastin deposits in the NP_3W tissues were however, significantly smaller that in WT_3W tissues, consistent with the increased presence of shorter, fragmented elastic fibers. This is suggestive of continued elastolytic activity in cultured tissues from KO animals.
Significantly higher values for the maximum diameter and perimeter of elastin deposits were observed in POP_UT_3W tissues versus the POP_D0 and NP_3W tissues, although there were no differences in the extent of variability in these parameter values. This mimics the effect of elastase treatment on NP tissues in our validation studies and suggests continued proteolytic activity within the POP tissues. The increases in these parameters for the POP tissues (i.e., POP_UT_3W vs. POP_D0) are significantly greater than in the NP tissues, suggesting significantly greater elastolytic activity in POP over the baseline activity in the NP tissues from KO animals. While our Western blot results indicate no significant differences in MMP2/TIMP4 ratios between POP_UT_3W tissues and NP_3W and WT_3W tissues, data shown in Figure 8A suggests that this is due to high data variability and the result of power analysis reveals that the sample size should be 35 and 68, to see the difference between POP_UT vs WT_3W and NP_3W, respectively. That said, greater elastolytic activity can also be associated with the increased expression of other cysteine and serine proteases in POP4,5, which we did not investigate. We also saw a trend in differences in some parameters such as diameter (max), diameter (min) and perimeter length between the D0 groups (Figure 6), although these differences did not demonstrate statistical significance. We propose a hypothesis that the statistical significance of groupwise differences in parameters in the 3 weeks tissue specimens are due to increased and continued proteolytic activity in the POP cultures but not in the WT. This could have exaggerated the morphometry outcomes towards achieving statistical significance in the differences between groups.
Figure 8.
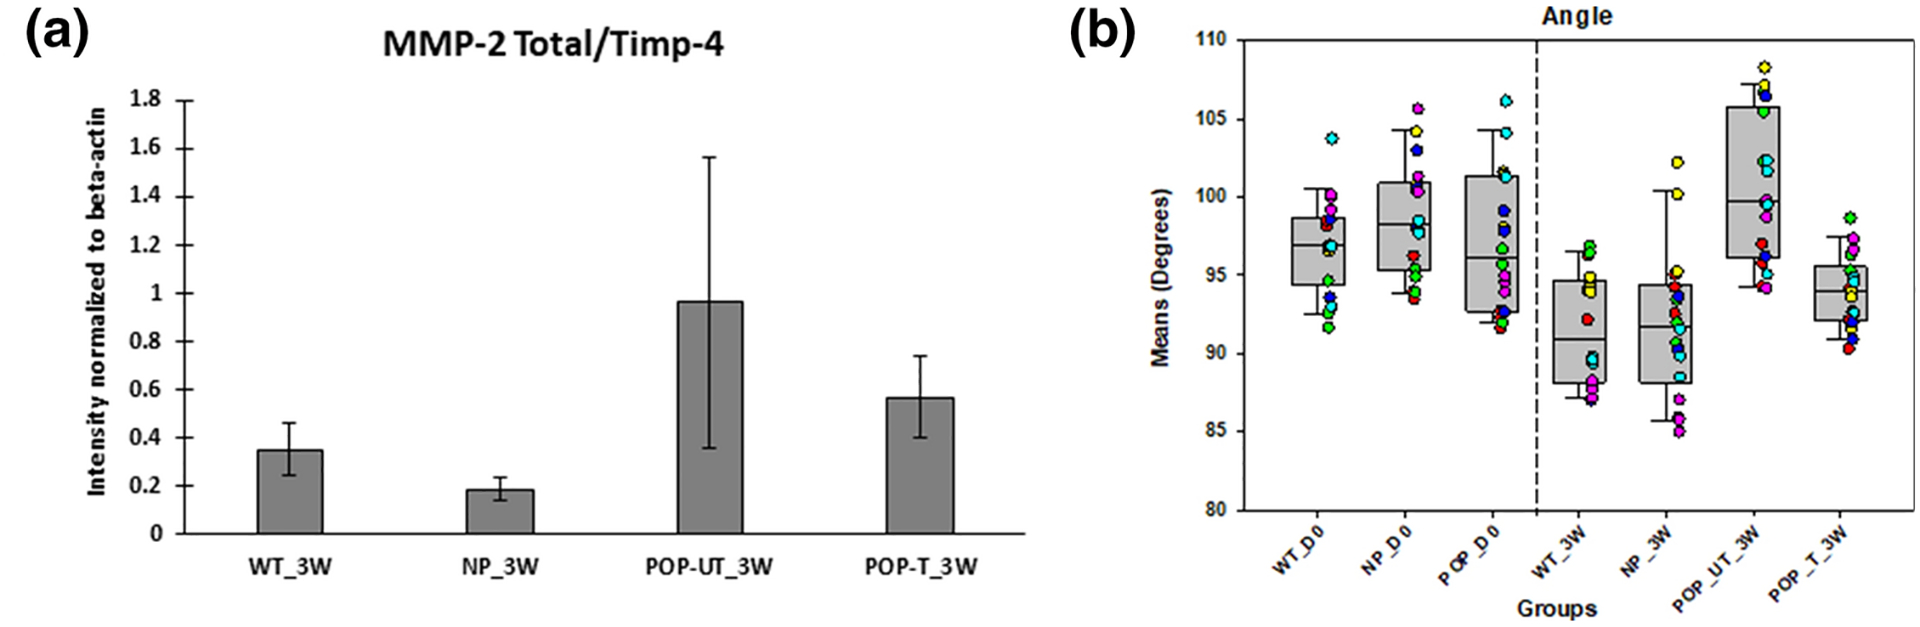
(A) MMP-2 total to TIMP-4 ratio obtained by western blot on tissues from all the groups at 3 weeks of culture. The bar chart represents mean ± standard error of mean. (B) Angle of elastic fibers in the mouse groups and with and without treatment with elastogenic factors. Each bar represents mean ± SE of data from six animals. The box plot represents median (solid line) with 25/75% confidence interval; whiskers indicate 5/95% confidence interval; black circles indicate outliers and blue dashed lines indicate the mean. Data was collected from 6 animals in each group with 3 histological sections per animal for a total of 18 sections. Each colored square corresponds to sections from same animal. Vaginal tissues from wildtype (WT), multiparous non prolapsed (NP), and prolapsed (POP) mice with 0 days of tissue culture (D0) are represented as WT_D0, NP_D0, and POP_D0, respectively. WT, NP, POP untreated (UT) and POP treated (T) vaginal tissues after three weeks (3W) of tissue culture are represented by WT_3W, NP_3W, POP_UT_3W, and POP_T_3W, respectively.
Elastin deposits in POP_UT_3W tissues showed higher aspect ratios vs. NP_3W tissues. This may be attributed to the presence of long and more slender fibers in POP tissues13, which likely represent a stage prior to fragmentation of mature, pre-existing elastic fibers. Since intact elastic fibers are important as nucleation sites for new fiber formation and because new elastin deposits coalesce onto clustered microfibrillar proteins in the absence of LOXL114,23 , these tissues are likely unable to regenerate mature elastin fibers in the reproductive tract, post-parturition, thus contributing to development of the prolapse condition15.
While the higher mean perimeter length and variability in maximum diameter in POP_T_3W vs. POP_UT_3W is suggestive of homeostatic restoration of elastic fibers with EF treatment because as seen in Figure 6, we observed an upward trend in maximal diameter of elastic fibers (i.e., larger, more mature fibers) with treatment of POP tissues although mean max diameter values were not significantly different. That said, this trend together with data indicating significantly smaller variability in max. elastic fiber diameters with treatment, suggest that the treated tissues contain fewer number of smaller, less mature elastic fibers, providing some evidence of homeostatic restoration of elastic fibers with EF treatment. However, this requires further validation. Significantly, increases were noted in total percent area (density) of elastin in POP_T_3W vs. POP_UT_3W tissues, recapitulating the higher percentage area and amount of total matrix elastin per mg dry weight of tissues in the control vs. elastase-treated tissues we observed in our earlier validation studies. This finding also agrees with our previously published studies in which we demonstrated significantly more dense elastic matrix and also increased elastin mRNA in LOXL1 KO mouse NEVC cultures treated with EFs20. That said, age, parity and stages of prolapse can also significantly impact fiber characteristics and orientation, as can EF dose and culture time, both factors that were not evaluated in this study. This represents a limitation in our study since we did not investigate age,- parity-, and prolapse stage-matched animals. Also, based on the findings in other animal models1,28, the difference in vaginal microstructure and mechanical function in anterior and posterior vaginal wall might also affect the outcomes of our study however, differences in vaginal wall microstructure and mechanics between the anterior and posterior regions of the healthy and prolapsed vaginal canal in LOXL1 KO mice are inadequately known so in this study, we limited our tissue collection and thus assays to the dorsal wall of the vaginal canal and since the tissues analyzed across groups are all derived from the same anatomical region, we expect variability in our data to be minimized.
Increases in mean values of, and variability in tortuosity were noted in WT_3W vs. WT_D0, NP_3W vs. NP_D0, POP_UT_3W vs. POP_D0 and POP_T_3W vs POP_D0 tissues. Decreases in linearity of elastic fibers (i.e., increased tortuosity) has been associated with matrix degeneration and aging, and loss of tissue elasticity8,9. The increased variability in fiber tortuosity, is thus probably result of increased elastic fiber breakdown as well as aberrant new fiber formation. Since we did not observe any significant change in the overall dimensions of the tissue samples before and after culture so it is unlikely that the increased tortuosity of fibers post-culture is a result of the overall contraction of the tissue. Moreover, if this were to be the case, we would also expect to see consistent decrease in aspect ratio for all groups from D0 to 3W since aspect ratio is the ratio of major axis to minor axis of the object, it reflects the size of the object. With overall contraction of tissue we would assume the size of the object would also decrease. Contrary to this, we observed on changes in the fiber aspect ratio for NP_D0 vs NP_3W). While cell traction forces and applied mechanical stimuli/constraints influence orientation and alignment of elastic fibers, we have not applied dynamic conditioning to our ex vivo tissue cultures. Thus, it is expected that new fibers that form will not show any preferred orientation or alignment and will exhibit more tortuous behavior when cultured for longer periods of time. This is also echoed by our data of mean angle of elastin objects Table 6 and Figure 8B which did not show any difference between the groups. Differences in mean angles of elastin objects would suggest critical differences in the shape of elastin objects within our tissue sections and also in the corresponding bulk tissues. The lack of difference in shape of elastin objects between the groups is possibly because of (a) the sourcing of the tissues from the same anatomincal region of the vaginal canal and (b) the absence of biomechanical stimulation of tissue contructs in culture as mentioned above.
Table 6.
Fiber angle measurement data
| Group | Mean fiber angle(degrees) | Standard Deviation |
|---|---|---|
| WT_D0 | 97.02 | 2.33 |
| NP_D0 | 98.68 | 3.46 |
| POP_D0 | 97.04 | 4.30 |
| WT_3W | 91.60 | 3.66 |
| NP_3W | 91.85 | 4.49 |
| POP_UT_3W | 100.62 | 4.62 |
| POP_T_3W | 93.97 | 1.98 |
While 3D structural evaluation using other tomographic methods are becoming new standards in tissue imaging, they are not appropriate for reliable and representative morphometric assessment of elastin deposits and elastic fibers. For e.g. confocal microscopy images only a small, microscopic area of the tissue section and not the whole tissue section and hence will rigorous image acquisition and post process ‘stitching’ of images of ROIs to generate information of the whole tissue section. Our technique on the other hand efficiently assesses the elastic fiber structural changes over an entire tissue section, and hence generates more reliable and representative outcomes. Differently, MicroCT and other tomographic techniques are useful to provide broad changes to tissue structure and dimensions, and do not have the necessary resolution to visualize the individual fibers like the histological staining does. Our methodology thus adds significant value in the field.
There were some limitations with this study. The stain uptake by tissues varied, so elastin appeared in different shades, which might have caused over- or under - estimation of the pixels selected. Although this method relies on training the software to recognize pixels corresponding to elastin based on initial selection, it is only semi-automatic and training the software depends on the best judgement call of the person doing the experiment. However, variability due to this error should be equally and randomly distributed between the groups and should not contribute to the differences between them. We also did not assess elastin in blood vessels independently from other tissue elastin. Therefore, changes in elastin in blood vessels may account for some of the differences between groups. However, elastin in blood vessels is also indicative of treatment effects on elastin in general and is unliklely to be reflective of the entirety of changes in elastin with treatment or with prolapse. Since the fibers are observed from a single plane in an 8 μm thick section, the parameters measured are somewhat arbitrary. Despite these limitations, this technique appears to be useful in describing the general characteristics of elastic fibers and the changes that occur in them subjected to different scenarios. This technique can be useful in tissue engineering to assess structural changes of the tissue. Moreover, this new technique is not limited to measurement of elastin and the parameters we have described. It can be used to measure other structures in different histological samples and other parameters, depending on the research question, hypothesis and experimental design.
Acknowledgements
This project was supported research funding from the National Institutes of Health (HD078820, HD095521) awarded to A.R. and M.D.
References
- 1.Berger MB, Kolenic GE, Fenner DE, Morgan DM, and DeLancey JOL. Structural, functional, and symptomatic differences between women with rectocele versus cystocele and normal support. Am. J. Obstet. Gynecol 218:510.e1–510.e8, 2018. [DOI] [PMC free article] [PubMed] [Google Scholar]
- 2.Blomquist JL, Muñoz A, Carroll M, and Handa VL. Association of Delivery Mode with Pelvic Floor Disorders after Childbirth. JAMA - J. Am. Med. Assoc, 2018.doi: 10.1001/jama.2018.18315 [DOI] [PMC free article] [PubMed] [Google Scholar]
- 3.Bonnans C, Chou J, and Werb Z. Remodelling the extracellular matrix in development and disease. Nat. Rev. Mol. Cell Biol 15:786–801, 2014. [DOI] [PMC free article] [PubMed] [Google Scholar]
- 4.Budatha M, Silva S, Montoya TI, Suzuki A, Shah-Simpson S, Wieslander CK, Yanagisawa M, Word RA, and Yanagisawa H. Dysregulation of Protease and Protease Inhibitors in a Mouse Model of Human Pelvic Organ Prolapse. PLoS One 8:e56376, 2013. [DOI] [PMC free article] [PubMed] [Google Scholar]
- 5.Chen B, Wen Y, and Polan ML. Elastolytic activity in women with stress urinary incontinence and pelvic organ prolapse. Neurourol. Urodyn 23:119–126, 2004. [DOI] [PubMed] [Google Scholar]
- 6.Frantz C, Stewart KM, and Weaver VM. The extracellular matrix at a glance. J. Cell Sci 123:4195–4200, 2010. [DOI] [PMC free article] [PubMed] [Google Scholar]
- 7.Gacchina CE, and Ramamurthi A. Impact of pre-existing elastic matrix on TGFβ1 and HA oligomer-induced regenerative elastin repair by rat aortic smooth muscle cells. J. Tissue Eng. Regen. Med 5:85–96, 2011. [DOI] [PMC free article] [PubMed] [Google Scholar]
- 8.Imayama S, Nakamura K, Takeuchi M, Hori Y, Takema Y, Sakaino Y, and Imokawa G. Ultraviolet-B irradiation deforms the configuration of elastic fibers during the induction of actinic elastosis in rats. J. Dermatol. Sci 7:32–38, 1994. [DOI] [PubMed] [Google Scholar]
- 9.Imokawa G, Takema Y, Yorimoto Y, Tsukahara K, Kawai M, and Imayama S. Degree of ultraviolet-induced tortuosity of elastic fibers in rat skin is age dependent. J. Invest. Dermatol 105:254–258, 1995. [DOI] [PubMed] [Google Scholar]
- 10.Iyer S, and Botros SM. Transvaginal mesh: a historical review and update of the current state of affairs in the United States. Int. Urogynecol. J 28:527–535, 2017. [DOI] [PubMed] [Google Scholar]
- 11.Jameson SA, Swaminathan G, Dahal S, Couri B, Kuang M, Rietsch A, Butler RS, Ramamurthi A, and Damaser MS. Elastin homeostasis is altered with pelvic organ prolapse in cultures of vaginal cells from a lysyl oxidase-like 1 knockout mouse model. Physiol. Rep 8:e14436, 2020. [DOI] [PMC free article] [PubMed] [Google Scholar]
- 12.Joddar B, and Ramamurthi A. Elastogenic effects of exogenous hyaluronan oligosaccharides on vascular smooth muscle cells. Biomaterials 27:5698–5707, 2006. [DOI] [PubMed] [Google Scholar]
- 13.Karam JA, Vazquez DV, Lin VK, and Zimmern PE. Elastin expression and elastic fibre width in the anterior vaginal wall of postmenopausal women with and without prolapse. BJU Int. 100:346–350, 2007. [DOI] [PubMed] [Google Scholar]
- 14.Katsuda S, Okada Y, and Nakanishi I. Abnormal accumulation of elastin-associated microfibrils during elastolysis in the arterial wall. Exp. Mol. Pathol 52:13–24, 1990. [DOI] [PubMed] [Google Scholar]
- 15.Kerkhof MH, Hendriks L, and Brölmann HAM. Changes in connective tissue in patients with pelvic organ prolapse - A review of the current literature. Int. Urogynecol. J 20:461–474, 2009. [DOI] [PubMed] [Google Scholar]
- 16.Kielty CM Elastic fibres in health and disease. Expert Rev. Mol. Med 8:1–23, 2006. [DOI] [PubMed] [Google Scholar]
- 17.Kielty CM, Sherratt MJ, and Shuttleworth CA. Elastic Fibres. J. Cell Sci 115:2817–2828, 2002. [DOI] [PubMed] [Google Scholar]
- 18.Kökçü A, Yanik F, Çetinkaya M, Alper T, Kandemir B, and Malatyalioglu E. Histopathological evaluation of the connective tissue of the vaginal fascia and the uterine ligaments in women with and without pelvic relaxation. Arch. Gynecol. Obstet 266:75–78, 2002. [DOI] [PubMed] [Google Scholar]
- 19.Kow N, Ridgeway B, Kuang M, Butler RS, and Damaser MS. Vaginal Expression of LOXL1 in Premenopausal and Postmenopausal Women with Pelvic Organ Prolapse. Female Pelvic Med. Reconstr. Surg 22:229–235, 2016. [DOI] [PubMed] [Google Scholar]
- 20.Venkataraman L, Lenis AT, Couri BM, Damaser MS, R. A Induced Regenerative Elastic Matrix Repair in LOXL1 Knockout Mouse Cell Cultures: Towards Potential Therapy for Pelvic Organ Prolapse. J. Tissue Sci. Eng 03:, 2012. [DOI] [PMC free article] [PubMed] [Google Scholar]
- 21.de Landsheere L, Brieu M, Blacher S, Munaut C, Nusgens B, Rubod C, Noel A, Foidart JM, Nisolle M, and Cosson M. Elastin density: Link between histological and biomechanical properties of vaginal tissue in women with pelvic organ prolapse? Int. Urogynecol. J 27:629–635, 2016. [DOI] [PubMed] [Google Scholar]
- 22.De Landsheere L, Munaut C, Nusgens B, Maillard C, Rubod C, Nisolle M, Cosson M, and Foidart JM. Histology of the vaginal wall in women with pelvic organ prolapse: A literature review. Int. Urogynecol. J. Pelvic Floor Dysfunct 24:2011–2020, 2013. [DOI] [PubMed] [Google Scholar]
- 23.Lee UJ, Gustilo-Ashby AM, Daneshgari F, Kuang M, Vurbic D, Dan LL, Flask CA, Li T, and Damaser MS. Lower urogenital tract anatomical and functional phenotype in lysyl oxidase like-1 knockout mice resembles female pelvic floor dysfunction in humans. Am. J. Physiol. - Ren. Physiol 295:F545–55, 2008. [DOI] [PubMed] [Google Scholar]
- 24.Liang R, Abramowitch S, Knight K, Palcsey S, Nolfi A, Feola A, Stein S, and Moalli PA. Vaginal degeneration following implantation of synthetic mesh with increased stiffness. BJOG An Int. J. Obstet. Gynaecol 120:233–234, 2013. [DOI] [PMC free article] [PubMed] [Google Scholar]
- 25.Liu X, Zhao Y, Gao J, Pawlyk B, Starcher B, Spencer JA, Yanagisawa H, Zuo J, and Li T. Elastic fiber homeostasis requires lysyl oxidase-like 1 protein. Nat. Genet 36:178–82, 2004. [DOI] [PubMed] [Google Scholar]
- 26.Liu X, Zhao Y, Pawlyk B, Damaser M, and Li T. Failure of elastic fiber homeostasis leads to pelvic floor disorders. Am. J. Pathol 168:519–528, 2006. [DOI] [PMC free article] [PubMed] [Google Scholar]
- 27.Luisetti M, Ma S, Iadarola P, Stone PJ, Viglio S, Casado B, Lin YY, Snider GL, and Turino GM. Desmosine as a biomarker of elastin degradation in COPD: Current status and future directions. Eur. Respir. J 32:1146–1157, 2008. [DOI] [PubMed] [Google Scholar]
- 28.Martins P, Lopes Silva-Filho A, Fonseca A. M. Rodrigues Maciel da, Santos, Santos L, Mascarenhas T, Natal Jorge RM, and Ferreira AJM. Biomechanical Properties of Vaginal Tissue in Women with Pelvic Organ Prolapse. Gynecol. Obstet. Invest 75:85–92, 2013. [DOI] [PubMed] [Google Scholar]
- 29.Mecham RP, and Heuser JE. The Elastic Fiber. 2011, 79–109 pp.doi: 10.1007/978-1-4615-3770-0_4 [DOI] [Google Scholar]
- 30.Meijerink AM, Van Rijssel RH, and Van Der Linden PJQ. Tissue composition of the vaginal wall in women with pelvic organ prolapse. Gynecol. Obstet. Invest 75:21–27, 2013. [DOI] [PubMed] [Google Scholar]
- 31.Moon YJ, Choi JR, Jeon MJ, Kim SK, and Bai SW. Alteration of elastin metabolism in women with pelvic organ prolapse. J. Urol 115:953–961, 2011. [DOI] [PubMed] [Google Scholar]
- 32.Rosenbloom J, Abrams WR, and Mecham R. Extracellular matrix 4: the elastic fiber. FASEB J. 7:1208–18, 1993. [PubMed] [Google Scholar]
- 33.Sato F, Wachi H, Ishida M, Nonaka R, Onoue S, Urban Z, Starcher BC, and Seyama Y. Distinct Steps of Cross-linking, Self-association, and Maturation of Tropoelastin Are Necessary for Elastic Fiber Formation. J. Mol. Biol 369:841–851, 2007. [DOI] [PubMed] [Google Scholar]
- 34.Sharma AK, Lu G, Jester A, Johnston WF, Zhao Y, Hajzus VA, Reza Saadatzadeh M, Su G, Bhamidipati CM, Mehta GS, Kron IL, Laubach VE, Murphy MP, Ailawadi G, and Upchurch GR. Experimental abdominal aortic aneurysm formation is mediated by IL-17 and attenuated by mesenchymal stem cell treatment. Circulation 126:, 2012. [DOI] [PMC free article] [PubMed] [Google Scholar]
- 35.Venkataraman L, and Ramamurthi A. Induced elastic matrix deposition within three-dimensional collagen scaffolds. Tissue Eng. - Part A 17:2879–2889, 2011. [DOI] [PMC free article] [PubMed] [Google Scholar]
- 36.Wang H, Kira Y, Hamuro A, Takase A, Tachibana D, and Koyama M. Differential gene expression of extracellular-matrix-related proteins in the vaginal apical compartment of women with pelvic organ prolapse. Int. Urogynecol. J, 2019.doi: 10.1007/s00192-018-3637-z [DOI] [PubMed] [Google Scholar]
- 37.Weintraub AY, Glinter H, and Marcus-Braun N. Narrative review of the epidemiology, diagnosis and pathophysiology of pelvic organ prolapse. Int. Braz J Urol, 2020.doi: 10.1590/S1677-5538.IBJU.2018.0581 [DOI] [PMC free article] [PubMed] [Google Scholar]
- 38.Wieslander CK, Rahn DD, Mclntire DD, Acevedo JF, Drewes PG, Yanagisawa H, and Word RA. Quantification of pelvic organ prolapse in mice: Vaginal protease activity precedes increased MOPQ scores in fibulin 5 knockout Mice 1. Biol. Reprod, 2009.doi: 10.1095/biolreprod.108.072900 [DOI] [PMC free article] [PubMed] [Google Scholar]
- 39.Wong MY, Harmanli OH, Agar M, Dandolu V, Grody MHT, and Diamond MP. Collagen content of nonsupport tissue in pelvic organ prolapse and stress urinary incontinence. Am. J. Obstet. Gynecol 189:1597–1599, 2003. [DOI] [PubMed] [Google Scholar]
- 40.Yang Zhou OL Expression and significance of lysyl oxidase-like 1 and fibulin-5 in the cardinal ligament tissue of patients with pelvic floor dysfunction. J. Biomed. Res 27:23–28, 2013. [DOI] [PMC free article] [PubMed] [Google Scholar]
- 41.Zhao BH, and Zhou JH. Decreased expression of elastin, fibulin-5 and lysyl oxidase-like 1 in the uterosacral ligaments of postmenopausal women with pelvic organ prolapse. J. Obstet. Gynaecol. Res, 2012.doi: 10.1111/j.1447-0756.2011.01814.x [DOI] [PubMed] [Google Scholar]
- 42.Zhou L, Lee JH, Wen Y, Constantinou C, Yoshinobu M, Omata S, and Chen B. Biomechanical properties and associated collagen composition in vaginal tissue of women with pelvic organ prolapse. J. Urol 188:875–880, 2012. [DOI] [PubMed] [Google Scholar]