

Abstract
We propose a new epidemic model considering the partial mapping relationship in a two-layered time-varying network, which aims to study the influence of information diffusion on epidemic spreading. In the model, one layer represents the epidemic-related information diffusion in the social networks, while the other layer denotes the epidemic spreading in physical networks. In addition, there just exist mapping relationships between partial pairs of nodes in the two-layered network, which characterizes the interaction between information diffusion and epidemic spreading. Meanwhile, the information and epidemics can only spread in their own layers. Afterwards, starting from the microscopic Markov chain (MMC) method, we can establish the dynamic equation of epidemic spreading and then analytically deduce its epidemic threshold, which demonstrates that the ratio of correspondence between two layers has a significant effect on the epidemic threshold of the proposed model. Finally, it is found that MMC method can well match with Monte Carlo (MC) simulations, and the relevant results can be helpful to understand the epidemic spreading properties in depth.
Keywords: Epidemic spreading, Information dissemination, Time-varying two-layered networks, Partial mapping, Correspondence rate, MMC method
Introduction
Emerging epidemics can create the heavy harm to human health [1, 2], such as SARS [3], Ebola [4] and COVID-19 [5]. How to prevent large-scale outbreaks of infectious diseases has always been a challenging topic in the area of disease intervention and public health [6]. Therefore, it is particularly important to use effective methods to prevent and control the diffusion of infectious epidemics. For that matter, experts in various fields begin to focus on the spread of infectious diseases by establishing infectious disease models [7–9], which try to characterize the spreading law and present some effective measures to fight against large-scale pandemics.
Some classical propagation dynamical models were proposed [10], such as susceptible–infective (SI), susceptible–infective–susceptible (SIS) and susceptible–infective–recovery (SIR) models. An important indicator of epidemic transmission is the critical threshold for the epidemic spreading, which denotes the minimum transmission rate to induce an extensive outbreak [11, 12]. Among them, Parshani et al. [13] presented an analytic expression of threshold for (SIS) model over a random network. To be notable, multiple factors may affect the threshold of epidemic spreading process within the population. As an example, Wu et al. [14] investigated the effect of global, local and contact awareness on the propagation threshold of the SIS model in scale-free network. They proved that the global awareness decreased the epidemic prevalence, while the other two types of awareness increased the epidemic threshold.
After more than 20 years of development, complex network theory has made great achievements [15–19], which provides a new framework to favor the study of epidemic transmission. In the epidemic dynamics, the multilayer network structure offers a novel topology foundation to model the epidemic spreading since the spread of epidemic is often coupled with the diffusion of epidemic-related information, such as rumors and knowledges [20–22], risk perception [23, 24] and fear [25, 26], which is usually spread by means of online social networking platforms, (e.g., WeChat, QQ and Twitter) [27, 28]. Any individual will take preventive steps to prevent themselves from being infected after they know the relevant information of the epidemics, for instance, wearing masks, reducing outdoor activities and paying attention to the personal hygiene. Infected individuals also spread information on social networks. Thus, epidemic-related information plays a significant role in the spread of epidemics. For example, individuals who are aware of the epidemics may reduce the probability of being infected, and infected individuals who spread information facilitate the diffusion of information, and thereby, the probability of susceptible individuals being infected is reduced. Some studies have shown that epidemic information can greatly affect epidemic outbreaks, such as reducing the size of outbreaks and raising the epidemic threshold [29–34]. In particular, Granell et al. [35] put forward a novel UAU-SIS (unaware/aware/unaware–susceptible/infected/susceptible) model to investigate the coupling characteristics between information diffusion and spread of epidemic dynamics, and they found that epidemic threshold is correlated with the information transmission property on the diffusion layer as well as the network topology of epidemic propagation layer. Also, there is a critical value of information transmission rate; starting from this point, the threshold increases and the outbreak size is reduced. Furthermore, they improved their model [36] to take into account the impact of mass media on epidemic transmission, and the tipping point that had appeared in previous studies disappeared under the influence of mass media. Xia et al. [37] further explored the characteristics of the coupled transmission of information and SIR-type epidemics under the influence of mass media, and they found that the increase of the transmission rate of mass media could significantly reduce the size of epidemic outbreak and increase the epidemic threshold. In addition, Wang et al. [38] discussed the epidemic transmission behaviors under positive and negative prevention information, and they proved that the coexistence of positive and negative prevention information can substantially modify the epidemic outbreak size and the critical threshold giving rise to the large-scale diffusion of epidemics. As a further step, they improved the model to explore the influence of mass media on the spread of the epidemic, indicating that mass media has an impact on the size and threshold of the epidemics [39].
However, in the related studies mentioned above, it is usually assumed that each node in one layer precisely corresponds to one node in the other layer; that is, there exists one-to-one mapping relationship between two layers for any node pair. It is also hypothesized that any individual can effectively avoid being infected once he obtains the epidemic-related information; at the same time, infected individuals will carry out the information transmission in the information layer. Nevertheless, during the real outbreaks, infected agents may not transmit epidemic messages in time due to various reasons. As an example, AIDS patients are usually not willing to actively report their sexual partners of their HIV infection [40]. Meanwhile, there may exist some individuals who have the information about epidemics, while they are still reluctant to adopt the effective prevention measures, which renders the infectious diseases to be further spread. Taking an example, a considerable number of students in a university in South Africa have knowledge about HIV, but most of them have not adopted the preventive measures to protect themselves [41]. Henceforth, it is necessary to investigate the impact of the mapping relationship between partial node pairs on epidemic transmission, in which epidemics and epidemic-related information are considered simultaneously. It is worth mentioning that we have firstly discussed the impact of partial mapping of node pairs between two-layered networks based on the static multiplex network topology [42], and it is indicated that ratio of correspondence between two layers of networks has greatly influenced the critical threshold of proposed epidemic model. However, information diffusion and epidemic transmission usually occur in time-varying networks in reality, and then, the static networks often ignore the time-varying characteristics of individual connection patterns. In order to more reasonably describe the transmission dynamics of epidemics in the real world, time-varying networks need to be considered in the modeling of epidemic spread [43–46].
For this reason, we try to utilize the activity-driven network to describe the network structure of information diffusion and epidemic propagation. Furthermore, beginning from the framework of two-layered networks, we put forward one coupled epidemic model to delineate the interaction between epidemics and information associated with epidemics, where one layer stands for the epidemic-related information diffusion network, while another one is used as the underlying network for the epidemic transmission. However, different from previous works [35–39], we only consider that there exists the mapping relationship for partial node pairs between two layers. On the contrary, they will propagate independently if the corresponding nodes have no such mapping relationships. Particularly, we take use of the microscopic Markov chain (MMC) method to analytically acquire the critical threshold of epidemics for the proposed model. Meanwhile, large quantities of MC simulations are used to demonstrate the efficacy of MMC approach.
The remaining sections of this paper are organized as follows. First of all, the proposed epidemic model is introduced in detail in Sect. 2. Secondly, in Sect. 3, MMC method is used to analyze the model and derive the analytical expression of the epidemic threshold, and then, extensive simulations are conducted to explore the influence of correspondence rate on the epidemic spreading dynamics. Finally, we conclude the paper and perform some outlooks in Sect. 4.
The UAU-SIS epidemic model
In this work, starting from an activity-driven network model, time-varying network is used to characterize the coupling transmission and interaction of information diffusion and epidemics transmission. In order to make our introduction to the proposed epidemic model clearer, we list the definitions of key quantities or parameters of the epidemic model in Table 1. As shown in Fig. 1, Layer () denotes the diffusion of epidemic-related information on virtual online social networking platforms (e.g., WeChat and Weibo), and Layer () describes the epidemic transmission in real social networks (say, friends and family) [47]. There is a mapping relationship between partial node pairs, which indicates that only some individuals will change their behavior once they are infected or receive the epidemic-related information. At each layer, the network is generated by the actively driven model [48], which includes N nodes. Each node has a fixed activity level, denoting the probability of this node being activated to build links with other ones at each time step. On the upper layer (i.e., Layer ), the activity level for every node is expressed as ; while for the lower layer (that is, Layer ) the activity level of each node is assumed to be , where and are a set of sequences following the power-law distribution and , that is and , and meanwhile, they satisfy the conditions and , where represents the minimum value of or , we set , and and represent the activity index of Layer () and Layer (), respectively. The smaller activity index or means the more heterogeneous node activity distribution on Layer or Layer .
Table 1.
Definitions of some key quantities or parameters in the proposed epidemic model
| Symbol | Definition |
|---|---|
| N | Network size on each layer in the proposed epidemic model |
| t | Time step |
| Probability of an unaware agent receiving information from one of his neighbors | |
| Probability of an aware individual forgetting information | |
| Probability of a susceptible agent being infected by one of his neighbors | |
| Probability of an infected individual recovering to susceptible state | |
| Probability of an unaware susceptible agent being infected by one of his infected neighbors | |
| Probability of an aware susceptible agent being infected by one of his infected neighbors | |
| Number of links built by an active node on Layer () | |
| Number of links built by an active node on Layer () | |
| Node i’s activity potential on Layer () | |
| Node i’s activity potential on Layer () | |
| Node i’s activity level on Layer () | |
| Node i’s activity level on Layer () | |
| Rescaling factor on Layer () | |
| Rescaling factor on Layer () | |
| Distribution of activity potential for nodes on Layer () | |
| Distribution of activity potential for nodes on Layer () | |
| Exponent of activity level on Layer () | |
| Exponent of actively level on Layer () | |
| The lower limit of activity potential distribution | |
| Average degree of nodes on Layer () | |
| Average degree of nodes on Layer () | |
| Mapping relationship between Layer () and Layer () | |
| Attenuation coefficient when an individual is aware of epidemic-related information | |
| Correspondence rate between two layers | |
| Probability of individual i is X-state | |
| Probability that an individual i on Layer () is not informed by his neighbors at time step t | |
| Probability that an aware individual i is not infected by his neighbors at time step t | |
| Probability that an unaware individual i is not infected by his neighbors at time step t |
Fig. 1.

The UAU-SIS epidemic model with partial node pairs mapping in time-varying network. Layer () denotes the epidemic-related information diffusion network, and there are two kinds of node states including aware (A) and unaware (U); Layer () network represents the spread of epidemics, and there are susceptible (S) and infected (I) states in the Layer (). A virtual connection between two layers means that partial node pairs hold the mapping relationship. Individuals in Layer () are represented by a circle, while individuals in Layer () are represented by a square. The size of the circle and the square indicates the level of individual activity. The larger the size, the higher the level of activity. Firstly, in panel a, two layers are, respectively, composed of N isolated nodes. As an example, node 6 is in the aware state on Layer () , and infected state on Layer (). Secondly, in panel b, nodes 2, 7 and 10 in Layer () are active nodes, and they randomly select nodes at Layer () to establish two links (). In addition, nodes 1, 6 and 9 in Layer () are active, and they randomly select nodes at Layer () to establish two links (). At this step, node 5 in Layer () is infected by neighbor node of 6, and the corresponding node in Layer () becomes aware. At the same time, node 4 is also infected by neighbor node 6, while the state of node 4 in Layer () remains unaware since there is no mapping relationship between layers. In Layer (), node 10 becomes aware by acquiring the information from its neighbor of node 6. At the next step, all links are deleted and each layer is still composed of N independent nodes, and then, the processes in panel b are repeated until the diffusion dynamics in the two layers tend to be stable
Figure 1 depicts one basic step of time-varying network construction on Layer () or Layer (), which are divided into the following three steps. 1) At the beginning of time step t, both Layer () and Layer () are composed of N isolated nodes, and there just exist the mapping relationships between partial node pairs for two-layered networks; 2) the node at layer () becomes the active state with probability () and randomly selects other () nodes to establish the links; and 3) at the next time step , all links on Layer () or Layer () are removed, the corresponding layer is restored to N separated nodes, and repeat the previous two steps until the propagation of the two layers reaches a stable state. At each iterating time step, the average degree of Layer () and Layer () is and , respectively.
Next, the epidemics and information spreading model is defined in detail. The process of information transmission on Layer () is described by UAU-type dynamics, in which individuals may be at the unaware (U) or aware (A) state. Among them, an unaware agent will acquire the epidemic-related information with the probability from his neighbors, and an aware individual will forget the related information with probability . In addition, the classical SIS-type model is used to describe the epidemic transmission at Layer (), where each individual may be susceptible (S) or infected (I). A susceptible individual is transformed into an infected one with probability , and the infected individual returns to the susceptible state with probability . Different from the classic SIS model, information transmission will affect the probability of being infected when the two-layered network is coupled. Accordingly, under the case of two-layered network and partial node-pair mapping, there exist 4 possible states for any node pair in the current model, which include US, UI, AS and AI. Furthermore, any one of 4 states can be transformed into other possible ones with a certain probability, and corresponding state transition can be shown in Fig. 2.
Fig. 2.

The probability transition tree for four states (US, AS, AI and UI). Nodes that are unaware of the information will not be transmitted by their neighbors with probability , and individuals that are aware of the information will forget the information with probability . The probability that the node i is unaware of the information will not be infected by its neighbors which is , while the probability is if the individual is aware of information. In addition, the infected node returns to the susceptible state with probability . denotes whether the node pairs on two layers of networks correspond to each other; when the nodes in two layers correspond to each other, ; on the contrary, there is no correspondence between the node pairs, and information diffusion and epidemic transmission are independent of each other and so
In this model, in order to characterize the partial mapping of node pairs between layers, we use the vector to describe the mapping relationship: If there is no mapping between a pair of nodes, ; otherwise, . The rate of infection () will decay with an attenuation factor when a susceptible individual i obtains the information related to epidemics, that is, , where can be defined in the following way,
| 1 |
In the model, is used to denote the rate of infection for an unaware susceptible to be one infected neighbor. In addition, when , we assume that the epidemic-related information will be immediately spread once a US-type individual is infected. However, the individual state on the Layer () will not be infected if there is no mapping between node pairs (i.e., ).
At any time step t, , , and can be used to denote the probabilities for an individual i at the states of US, UI, AS and AI, respectively. For each node i, the normalized condition must be satisfied. The activity levels of nodes in Layer () and Layer () are represented by vectors and , respectively. Furthermore, denotes the probability that any unaware node i at Layer () will not propagate the information at time step t. Similarly, for the node in Layer (), if the state of this node in Layer () is unaware, then the probability that the individual will not be infected by any infected neighbor at step t is ; Otherwise, the probability is . Thus, we can get the following equations,
| 2 |
where , .
Starting from the state transition trees in Fig. 2, the dynamical equations of four states for the propose model are obtained as Eq. (3).
| 3 |
When the system arrives at the steady state, the following equations can be obtained:
| 4 |
Analytical and experimental results
Analytical results from MMC method
Epidemic outbreak threshold is an important indicator to characterize whether the disease outbreaks can happen in the field of infection disease modeling. In this section, the dynamic process of Eq. (3) is analyzed by MMC method, and we deduce the epidemic threshold of the proposed model by using Theorem 1.
Theorem 1
Suppose that the actively level vectors of two-layered networks are and , and the formulas of epidemic and related information dynamics are shown in Eq. (3). The threshold of epidemic outbreak can be expressed as , where is the maximum eigenvalue of matrix H. Among then, matrix H is going to be , where , and .
Proof
When is near the threshold, the probability that the node is infected is almost 0. Hence, let , then Eq. (2) can be approximated as
| 5 |
where , . When is near epidemic threshold, Eq. (3) at the steady state can be further simplified as follows,
| 6 |
Since , we can assume and . After that, the first and second equations in Eq. (6) can be further approximated by removing the higher-order terms as
| 7 |
Henceforth, we can further simplify the last term in Eq. (6) into the following equation,
| 8 |
Since , we can reconstruct Eq. (8) as follows,
| 9 |
Taking the average value of all nodes into account, we calculate the infection density to be . Then, Eq. (9) can be written as follows,
| 10 |
Multiply both sides of Eq. (9) by and take the average value of all nodes to obtain the following equation:
| 11 |
where , and .
Thus, we can rewrite Eq. (10) and (11) into the matrix form as follows,
| 12 |
where
| 13 |
The network system satisfies when the epidemic is greatly transmitted. When the epidemic breaks out in a networked system, is the minimum value satisfying the formula Eq. (12) such that is equal to , which is the maximum eigenvalue of matrix H and can be defined as
| 14 |
As a consequence, we can characterize the epidemic threshold as
| 15 |
It is worth noting that in Eq. (15), the epidemic threshold is related to the diffusion of the information, the rate of epidemic recovery, the correspondence rate between the Layer () and Layer () and attenuation factor . In addition, the level of node activity and connectivity in the Layer () and Layer () will also vary threshold according to Eq. (15).
Experimental results based on Monte Carlo simulations
In this subsection, extensive Monte Carlo simulation experiments are carried out to validate the theoretical predictions in Theorem 1. For all experiments, the number of nodes at each layer is set to be , and the vector is used to describe whether there exists the mapping relationship between corresponding pairs. Once the vector is determined, it will remain unchanged in subsequent experiments. Therefore, we define the mapping rate between two layers as , where . In addition, represents the proportion of infected individuals at the stable state. In the iterative calculation of MMC, the proportion of I-state is written as , while it can be denoted as in the numerical simulation of MC, where and represent the number of UI and AI agent pairs at the steady state. In addition, is initialized to be 0.01 when . To be specific, at the beginning of MC simulations, we randomly select 100 node pairs to initialize to AI-state. That is to say, the number of initial node pairs states in US, UI, AS and AI is 9900, 0, 0 and 100, respectively. In addition, in the calculation of MMC, the state of each node pair is and when , respectively.
Firstly, the results of the MMC are compared with the MC simulation results to verify the effectiveness of the analysis based on MMC. Figure 3 depicts the results of the number of I-state individuals changing with the probability of infection at different correspondence rates in MMC and MC. The average relative error between MMC and MC can be calculated as . In Fig. 3, the relative error is 4.1% when ; similarly, they are 3.7%, 3.5% and 4.5% when mapping rates are 60%, 80% and 100%, respectively. Therefore, MMC method can be accurately used to depict the epidemic spreading behaviors of the model described above.
Fig. 3.

Comparing the results obtained from MMC and MC with for different . denotes the density of infected individuals at the steady state. In the figure, solid nodes denote the simulation results of MC, while hollow nodes represent the experimental results of MMC. The remaining parameters are set to be as follows: . Each group of obtained through MC and MMC is averaged over 50 independent runs
Secondly, in Fig. 4 we consider the effect of on in the case of different combinations of and . There is no doubt that the value of increases with the rise of when is constant. However, this increasing tendency weakens when is varied from to . This is because when the value of is larger, the disease propagation may play a significant role so as to promote the information diffusion. In the case of the higher corresponding rate, more individuals have opportunities to take the preventive measures to avoid being infected once they receive the disease-related information. Meanwhile, larger leads to the reduction of , but the level of reduction is not obvious. For example, in the case of , the value of changes from 0.5164 to 0.4124 when changes from 0 to 1, while it declines from 0.3886 to 0.015 when . In addition, the effect on by increasing is inferior to change the value of . For instance, the value of in Fig. 4a is around 0.4831, 0.4562, 0.4349 and 0.4234 for different values of and 0.8 when we fix the infection rate . However, in Fig. 4b–d is 0.4141, 0.3412 and 0.2688 when and . Therefore, we may obtain the conclusion that the increase in the correspondence rate has a greater impact on information dissemination than increasing during the epidemic outbreaks.
Fig. 4.

at the steady state is plotted as a function of and . Other parameters are assumed to be
In the proposed model, the following three parameters can affect the structure of the two-layered time-varying networks: activity distribution index , contact ability m and the correlation coefficient C of node activity between two layers. Specifically, the activity index represents the heterogeneity of individual activity distribution, and the smaller the value of , the stronger the heterogeneity of nodes activity distribution. Meanwhile, the contact capacity means the average number of links established by an active node, and the activity correlation between two layers describes how nodes at different activity levels in Layer () and Layer () are coupled to each other. Next, we will explore the impact of these three factors on epidemic transmission in a partially mapping two-layered time-varying networks.
The influence of activity heterogeneity of the node at Layer () with different correspondence rate is plotted in Fig. 5. As can be seen from Fig. 5, the value of can affect the epidemic size and epidemic threshold. For example, in Fig.5a is 0.40, 0.31, 0.24 and 0.14 when is varied from 40% to 100%, and the outbreak thresholds in Fig.5b are around 0.16, 0.18, 0.21 and 0.25 when . This may be because in the case of higher value of , more people have chances to take preventive measures once they know the epidemic-related information. At the same time, they choose to spread the information after they are infected, thus effectively inhibiting the spread of the epidemics and modestly reducing the threshold of epidemic outbreak. The activity heterogeneity of Layer () has little effect on epidemics when is lower. For example, when , at the steady state is 0.3871, 0.3956, 0.4034, 0.4057, respectively, and epidemic threshold is 0.1658, 0.1618, 0.1600, 0.1569, respectively, when , while is 0.1078, 0.1247, 0.1478, 0.1579, and the threshold is 0.2925, 0.1618, 0.1600, 0.1569, respectively, when . This may be because in the case of low correspondence rate, individuals who know the information and take effective measures become fewer. In this case, increasing node activity can affect and promote the further spread of information, but there are still fewer individuals who take preventive measures, and thus, the inhibition effect on epidemic transmission is not obvious. Moreover, with the activity heterogeneity of nodes in Layer () being strengthened (say, decreases of ) , the epidemic size decreases and the threshold increases for different correspondence rates. Because the decrease of leads to the increase of the average activity potential of nodes in Layer (), which further induces the mean degree of nodes in Layer () to be increased, thereby the epidemic-related information diffusion is promoted and the chance of individuals taking preventive measures is also enlarged to inhibit the spread of epidemics.
Fig. 5.

Results of and as a function for different . The panel a shows the evolution of with the changes of , and the panel b shows the evolution of . The relevant parameters are set as follows: . In addition, in panel a
Figure 6 depicts the effect of activity heterogeneity of the node at Layer () at different correspondence rates . We find that, for different corresponding rates , the change of the activity heterogeneity of nodes in Layer () has a substantial influence on the density of infected individuals at the steady state and the threshold of epidemic outbreaks. For instance, the steady-state values of are 0.32, 0.24, 0.15 and 0.06 in Fig. 6a, and the outbreak thresholds are 0.19, 0.22, 0.27 and 0.33 in Fig. 6b when varies from 40% to 100% and , which may be because when the mapping rate is high, infected individuals are willing to actively spread this information, and at the same time, more individuals will know the epidemic-related information and take preventive measures, thus slowing down the spread of the epidemic. In addition, in the case of different correspondence rates , changing the activity heterogeneity of nodes in Layer () has a certain influence on epidemic transmission. As an example, when , the density of infected individuals is 0.3941, 0.3563, 0.3236, 0.2935, and threshold is 0.1615, 0.1784, 0.1917, 0.2052, respectively, when . Likewise, the is 0.1189, 0.0851, 0.0588, 0.0365, and the threshold is 0.2802, 0.3090, 0.3335, 0.3556, respectively, when . We can know that the activity heterogeneity of node in Layer () is enhanced, the average activity potential of nodes in Layer () increases, and leading to an increase in the average degree of the network in Layer (), it is conducive to epidemic transmission in Layer (). Meanwhile, when the corresponding rate gradually decreases, the influence on the trend of epidemic transmission does not weaken.
Fig. 6.

Results of and as a function for different . The panel a shows the evolution of with the changes of , and the panel b shows the evolution of . The relevant parameters are set as follows: . In addition, in panel a
Figure 7 describes the changes of and in the case of different correspondence rates with the number of links established by the active node in Layer (). The change of at different correspondence rates has a great difference as far as the density of infected individuals and the threshold are concerned. For instance, when changes from 1 to 8, decreases from 0.4439 to 0.3524 when , while it declines from 0.2766 to 0.004 when . Furthermore, increases from 0.1289 to 0.1800 and from 0.1291 to 0.4434, respectively. With continuing to increase, the change of and gradually decreases. The increase of is conducive the to increase, leading to the spread of epidemic information in Layer (), and thus effectively inhibits the spread of epidemic. When the correspondence rate is higher, increasing the number of links created by an active node in Layer () can rapidly reduce the infection density and increase the threshold of epidemic outbreaks, while, for the lower corresponding rate , the change of has little effect on the threshold. As an example, when is varied from 1 to 8, the threshold is slightly increased from 0.1289 to 0.1903 at , while it rises from 0.1291 to 0.6587 for . Therefore, the increase of correspondence rate can effectively inhibit the spread of epidemic and can enhance the threshold of epidemic outbreak when is larger.
Fig. 7.

Results of and as a function for different. The panel a shows the evolution of with the changes of , and the panel b shows the evolution of . The relevant parameters are set as follows: . In addition, in panel a
Next, we explore the impact of on the epidemic spreading when in Layer () is varied, and related results are shown in Fig. 8. Similarly, is varied from 1 to 8, and is increased from 0 to 0.5354 when , but it increases from 0 to 0.3058 if . Meanwhile, is reduced from 0.6292 to 0.0786 and from 0.9361 to 0.1173, respectively. As increases, the change of and gradually decreases and tends to be stable. The increase of leads to increase, which is conducive to the spread of epidemic in Layer (). Moreover, the corresponding rate is smaller, and the influence of infection density is greater when is increased. For example, changes from 1 to 20, and the infection density changes from 0 to 0.6481 when , while changes from 0 to 0.4353 when . Since the correspondence rate is lower, fewer infected individuals in Layer () have chances to spread information, which renders the fewer individuals in Layer () to know the information. Thus, fewer individuals will take effective prevention measures, which leads to the further transmission of the epidemic. When increases up to a certain value, the change of has little impact on the threshold, and the difference between different correspondence rates becomes smaller. As an example, when , the correspondence rate changes from 40% to 100%, and the threshold values are 0.0315, 0.0354, 0.0403 and 0.0468, respectively. The higher the corresponding rate , the stronger the inhibitory effect on the epidemic when changes.
Fig. 8.

(Color online) Results of and as a function for different . The panel a shows the evolution of with the changes of , and the panel b shows the evolution of . The relevant parameters are set as follows: . In addition, in panel a
Finally, in order to explore the influence of the proportion of positive or negative correlation node pairs on epidemic size and outbreak threshold in different corresponding rate, we use C to describe the proportion of positive or negative correlation between node pairs. For example, means that there are 5000 nodes in Layer () whose activity ability is positively mapping with nodes of higher activity ability in Layer (). However, represents that there are 5000 nodes with higher activity capacity in Layer () corresponding to nodes with lower activity capacity in Layer (). And the remaining 5000 nodes are randomly mapping. As shown in Fig. 9, the influence of correlation rate C on epidemic size and threshold is increased with the corresponding rate being raised. For instance, the infection density and threshold change from 0.3928 to 0.3846 and from 0.1606 to 0.1695, respectively, when , while for , changes from 0.1379 to 0.0671 and changes from 0.2544 to 0.3307. Meanwhile, when the value of C is positive, the infection density decreases and the threshold increase as C increases. However, the changes of and are distinct from those foregoing phenomena when the value of C is negative. It is worth mentioning that the change of infection density and threshold is very obvious at the positive and negative boundary; nevertheless, they do not change much more when C is far from zero. It can be explained that the number of nodes with strong activity is limited, the mapping relationship between nodes with the relatively lower activity ability has little influence on the final results, and the positive correlation promotes the spread of information and inhibits the spread of epidemic. Here, the individuals with high activity ability both in Layer () and Layer () can enhance the transmission of epidemic-relative information and inhibit spread of the epidemic. As indicated in real life, the behaviors of key individual may determine the evolution of epidemics.
Fig. 9.
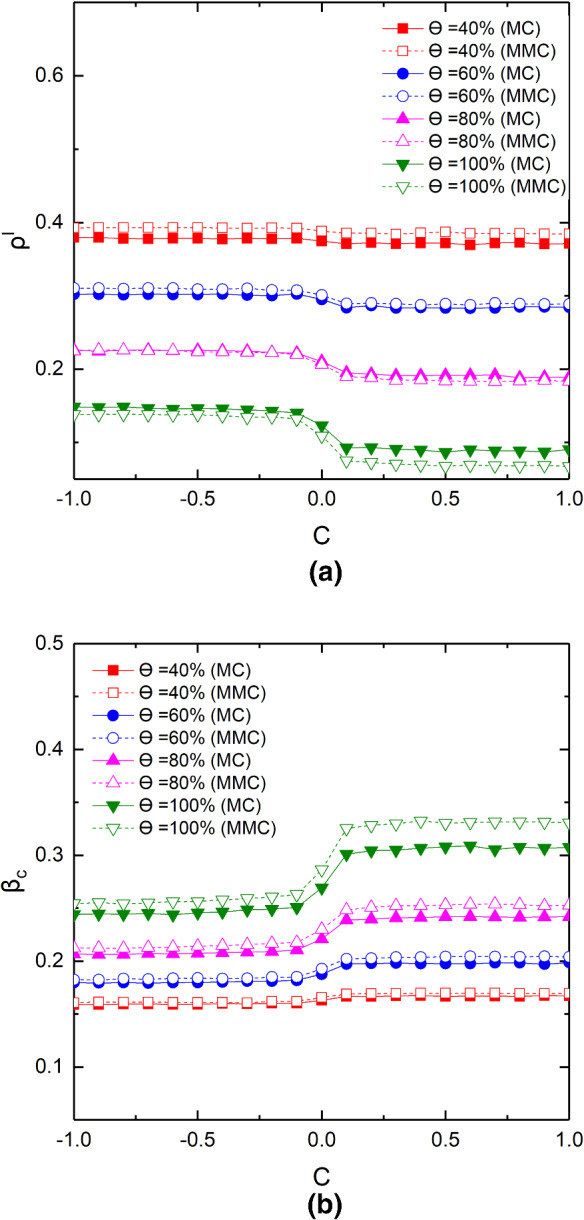
(Color online) Results of and as a function of C for different . The panel a shows the evolution of with the changes of C, and the panel b shows the evolution of . The relevant parameters are set as follows:
Conclusions and outlooks
In summary, based on the framework of two-layered time-varying networks, we present an improved epidemic model to study the interactions between epidemic-related information and epidemics, where only partial node pairs have the coupling or mapping relationships on two-layered networks. In the proposed model, the UAU model is used to depict the epidemic-relative information diffusion in the first Layer (), and the SIS model is used to describe epidemic transmission in the second Layer (). In this model, only partial individuals are considered to have the mapping relationship between two layers, and so only some individuals would take preventive measures after knowing the epidemic-related information or respond to the state of another layer after being infected. We utilize MMC method to analyze and derive the epidemic threshold of the model, in which the threshold is not only related to the information transmission of Layer (), but also closely correlated with the ratio of correspondence of node pairs between two layers. A great quantity of Monte Carlo simulations are also performed to validate the theoretical predictions. The current model indicates that the outbreak threshold and infection density of Layer () are related to the information diffusion dynamics of Layer (), and high correspondence rates are beneficial to the suppression of epidemic transmission. Our results are also qualitatively similar to these cases in static network.
Different from the static two-layered network propagation dynamics, we investigate how the unique activity properties of the time-varying networks of Layer () and Layer () and the coupling relationship between the two layers affect the epidemic transmission at different corresponding rates. It is found that nodes in Layer () with higher heterogeneity, which is conducive to information diffusion, have an inhibitory effect on epidemic, and this phenomenon is more obvious when the correspondence rate is higher. The activity heterogeneity of node in Layer () tends to reduce the threshold and enhance the infection density, and the trend is consistent for different corresponding rates. In addition, we also find that the increase of the contact capacity of nodes in Layer () can reduce the infection density, and the influence of contact capacity on the spread of epidemic is significant when the correspondence rate is higher. However, the increase of the contact capacity of nodes in Layer () is conducive to the transmission of epidemics, but the corresponding rate has little effect on the threshold after the contact capacity reaches a certain value. Finally, the influence of correlation between two layers on epidemic transmission is explained, it is found that there is an abrupt transition between positive and negative correlation coefficient C, and the positive correlation is conducive to the suppression of epidemic transmission.
In the future, we will further explore the role of individual heterogeneity in the awareness diffusion under the framework of multiple time-varying networks, which can be helpful to realistically characterize its spreading course. In addition, how to model the impact of mass media on the awareness diffusion will also become very necessary since the media information can confront the whole population. Meanwhile, the disease propagation and corresponding prevention measures may greatly change the population topology, and then, probing into the influence of epidemic spreading on the awareness diffusion will also make a difference from the current work.
Author Contributions
CX has devised the idea; HG, QY and CX have performed the research; HG has written the draft; and the other authors have made the reviewing and polishing. All authors have approved the present edition.
Funding
This work is partially supported by the National Natural Science Foundation of China (NSFC) under Grant Nos. 62173247, 61773286 by Chengyi Xia and the Tianjin Research Innovation Project for Postgraduate Students under Grant 2020YJSB076 by Qian Yin.
Availability of data and material
All data and materials can be obtained under the proposed model and algorithms.
Declarations
Conflict of interest
The authors declare that they have no conflict of interest.
Code availability
All algorithms are implemented in Java, and the code is available once the request to the corresponding author is reasonable.
Footnotes
Publisher's Note
Springer Nature remains neutral with regard to jurisdictional claims in published maps and institutional affiliations.
Contributor Information
Chengyi Xia, cyxia@email.tjut.edu.cn.
Matthias Dehmer, Email: matthias.dehmer@umit.at.
References
- 1.Morens DM, Fauci AS. Emerging infectious diseases: threats to human health and global stability. PLOS Pathog. 2013;9(7):e1003467. doi: 10.1371/journal.ppat.1003467. [DOI] [PMC free article] [PubMed] [Google Scholar]
- 2.Bloom DE, Cadarette D. Infectious disease threats in the twenty-first century: strengthening the global response. Front. Immunol. 2019;10:549. doi: 10.3389/fimmu.2019.00549. [DOI] [PMC free article] [PubMed] [Google Scholar]
- 3.Ge XY, Li JL, Yang XL, et al. Isolation and characterization of a bat SARS-like coronavirus that uses the ACE2 receptor. Nature. 2013;503(7477):535–550. doi: 10.1038/nature12711. [DOI] [PMC free article] [PubMed] [Google Scholar]
- 4.Feldmann H, Geisbert TW. Ebola haemorrhagic fever. Lancet. 2011;377(9768):849–862. doi: 10.1016/S0140-6736(10)60667-8. [DOI] [PMC free article] [PubMed] [Google Scholar]
- 5.Lai CC, Shih TP, Ko WC, Tang HJ, Hsueh PR. Severe acute respiratory syndrome coronavirus 2 (SARS-CoV-2) and coronavirus disease-2019 (COVID-19): the epidemic and the challenges. Int. J. Antimicrob. AG. 2020;55(3):105924. doi: 10.1016/j.ijantimicag.2020.105924. [DOI] [PMC free article] [PubMed] [Google Scholar]
- 6.Cohen ML. Changing patterns of infectious disease. Nature. 2000;406(6797):762–767. doi: 10.1038/35021206. [DOI] [PubMed] [Google Scholar]
- 7.Daszak P, Keusch GT, Phelan AL, Johnson CK, Osterholm MT. Infectious disease threats: a rebound to resilience. Health Affair. 2021;40:204–211. doi: 10.1377/hlthaff.2020.01544. [DOI] [PubMed] [Google Scholar]
- 8.Hethcote HW. The mathematics of infectious diseases. SIAM Rev. 2000;42(4):599–653. doi: 10.1137/S0036144500371907. [DOI] [Google Scholar]
- 9.Wang Z, et al. Statistical physics of vaccination. Phys. Rep. 2016;664:1–113. doi: 10.1016/j.physrep.2016.10.006. [DOI] [Google Scholar]
- 10.Anderson RM, May RM. Infectious Diseases of Humans: Dynamics and Control. Oxford: Oxford University Press; 1992. [Google Scholar]
- 11.Castellano C, Pastor-Satorras R. Thresholds for epidemic spreading in networks. Phys. Rev. Lett. 2010;105:218701. doi: 10.1103/PhysRevLett.105.218701. [DOI] [PubMed] [Google Scholar]
- 12.Ball F, Sirl D, Trapman P. Threshold behaviour and final outcome of an epidemic on a random network with household structure. Adv. Appl. Probab. 2009;41(3):765–796. doi: 10.1239/aap/1253281063. [DOI] [Google Scholar]
- 13.Parshani R, Carmi S, Havlin S. Epidemic threshold for the susceptible-infectious-susceptible model on random networks. Phys. Rev. Lett. 2010;104(25):258701. doi: 10.1103/PhysRevLett.104.258701. [DOI] [PubMed] [Google Scholar]
- 14.Wu QC, Fu XC, Small M, Xu XJ. The impact of awareness on epidemic spreading in networks. Chaos. 2012;22(1):013101. doi: 10.1063/1.3673573. [DOI] [PMC free article] [PubMed] [Google Scholar]
- 15.Pastor-Satorras R, Castellano C, Van Mieghem P, Vespignani A. Epidemic processes in complex networks. Rev. Mod. Phys. 2015;87(3):925–979. doi: 10.1103/RevModPhys.87.925. [DOI] [Google Scholar]
- 16.Moreno Y, Pastor-Satorras R, Vespignani A. Epidemic outbreaks in complex heterogeneous networks. Eur. Phys. J. B. 2002;26(4):521–529. doi: 10.1140/epjb/e20020122. [DOI] [Google Scholar]
- 17.Wang Y, Wei ZC, Cao JD. Epidemic dynamics of influenza-like diseases spreading in complex networks. Nonlinear Dyn. 2020;101(3):1801–1820. doi: 10.1007/s11071-020-05867-1. [DOI] [Google Scholar]
- 18.Xia CY, Wang L, Sun SW, Wang J. An SIR model with infection delay and propagation vector in complex networks. Nonlinear Dyn. 2012;69(3):927–934. doi: 10.1007/s11071-011-0313-y. [DOI] [Google Scholar]
- 19.Yin Q, Wang ZS, Xia CY, Dehmer M, Emmert-Streib F, Jin Z. A novel epidemic model considering demographics and intercity commuting on complex dynamical networks. Appl. Math. Comput. 2020;386:125517. [Google Scholar]
- 20.Huang H, Chen YH, Ma YF. Modeling the competitive diffusions of rumor and knowledge and the impacts on epidemic spreading. Appl. Math. Comput. 2021;288:125536. doi: 10.1016/j.amc.2020.125536. [DOI] [PMC free article] [PubMed] [Google Scholar]
- 21.Zhu LH, Liu MX, Li YM. The dynamics analysis of a rumor propagation model in online social networks. Phys. A. 2019;520:118–137. doi: 10.1016/j.physa.2019.01.013. [DOI] [Google Scholar]
- 22.Liu QM, Li T, Sun MC. The analysis of an seir rumor propagation model on heterogeneous network. Phys. A. 2017;469:372–380. doi: 10.1016/j.physa.2016.11.067. [DOI] [Google Scholar]
- 23.Moinet A, Pastor-Satorras R, Barrat A. Effect of risk perception on epidemic spreading in temporal networks. Phys. Rev. E. 2018;97(1):012313. doi: 10.1103/PhysRevE.97.012313. [DOI] [PMC free article] [PubMed] [Google Scholar]
- 24.Husnayain A, Shim E, Fuad A, Su C. Understanding the community risk perceptions of the covid-19 outbreak in south Korea: infodemiology study. J. Med. Internet Res. 2020;22(9):19788. doi: 10.2196/19788. [DOI] [PMC free article] [PubMed] [Google Scholar]
- 25.Chen YY, Bi KM, Zhao SN, Ben-Arieh D, Wu CHJ. Modeling individual fear factor with optimal control in a disease-dynamic system. Chaos Soliton Fract. 2017;104:531–545. doi: 10.1016/j.chaos.2017.09.001. [DOI] [Google Scholar]
- 26.Van Damme W, Van Lerberghe W. Epidemics and fear. Trop. Med. Int. Health. 2000;5(8):511–514. doi: 10.1046/j.1365-3156.2000.00599.x. [DOI] [PubMed] [Google Scholar]
- 27.Cui, P.B., Wang, W., Cai, S.M., Zhou, T., Lai, Y.: Close and ordinary social contacts: how important are they in promoting large-scale contagion?. Phys. Rev. E. 98(5) (2018)
- 28.Yu Z, Wang C, Bu JJ, Wang X, Wu Y, Chen C. Friend recommendation with content spread enhancement in social networks. Inform. Sci. 2015;309:102–118. doi: 10.1016/j.ins.2015.03.012. [DOI] [Google Scholar]
- 29.Zhan XX, Liu C, Sun GQ, Zhang ZK. Epidemic dynamics on information-driven adaptive networks. Chaos Soliton Fract. 2015;108:196–204. doi: 10.1016/j.chaos.2018.02.010. [DOI] [PMC free article] [PubMed] [Google Scholar]
- 30.Liu GR, Liu ZM, Jin Z. Dynamics analysis of epidemic and information spreading in overlay networks. J. Theor. Biol. 2018;444:28–37. doi: 10.1016/j.jtbi.2018.02.010. [DOI] [PubMed] [Google Scholar]
- 31.Kabir KMA, Tanimoto J. Analysis of epidemic outbreaks in two-layer networks with different structures for information spreading and disease diffusion. Commun. Nonlinear Sci. 2019;72(565–57):4. [Google Scholar]
- 32.Zhan XX, Liu C, Zhou G, Zhang ZK, Sun GQ, Zhu J, Jin Z. Coupling dynamics of epidemic spreading and information diffusion on complex networks. Appl. Math. Comput. 2018;332:437–448. doi: 10.1016/j.amc.2018.03.050. [DOI] [PMC free article] [PubMed] [Google Scholar]
- 33.Shen CS, Chen HS, Hou ZH. Strategy to suppress epidemic explosion in heterogeneous metapopulation networks. Phys. Rev. E. 2012;86(3–2):036114. doi: 10.1103/PhysRevE.86.036114. [DOI] [PubMed] [Google Scholar]
- 34.Shen CS, Chen HS, Hou ZH, Kurths J. Hybrid multiscale coarse-graining for dynamics on complex networks. Chaos. 2018;28(12):123122. doi: 10.1063/1.5048962. [DOI] [PubMed] [Google Scholar]
- 35.Granell C, Gómez S, Arenas A. Dynamical interplay between awareness and epidemic spreading in multiplex networks. Phys. Rev. Lett. 2013;111(12):128701. doi: 10.1103/PhysRevLett.111.128701. [DOI] [PubMed] [Google Scholar]
- 36.Granell C, Gómez S, Arenas A. Competing spreading processes on multiplex networks: awareness and epidemics. Phys. Rev. E. 2014;90(1):012808. doi: 10.1103/PhysRevE.90.012808. [DOI] [PubMed] [Google Scholar]
- 37.Xia CY, Wang ZS, Zheng CY, Guo QT, Shi YT, Matthias D, Chen ZQ. A new coupled disease-awareness spreading model with mass media on multiplex networks. Inform. Sci. 2019;471:185–200. doi: 10.1016/j.ins.2018.08.050. [DOI] [Google Scholar]
- 38.Wang ZS, Xia CY, Chen ZQ, Chen GR. Epidemic propagation with positive and negative preventive information in multiplex networks. IEEE T. Cybern. 2021;51(3):1454–1462. doi: 10.1109/TCYB.2019.2960605. [DOI] [PubMed] [Google Scholar]
- 39.Wang ZS, Xia CY. Co-evolution spreading of multiple information and epidemics on two-layered networks under the influence of mass media. Nonlinear Dyn. 2020;102:3039–3052. doi: 10.1007/s11071-020-06021-7. [DOI] [PMC free article] [PubMed] [Google Scholar]
- 40.Njozing, B.N., Edin, K.E., Sebastián, M.S., Hurtig, A.K.: If the patients decide not to tell what can we do?-TB/HIV counsellors’ dilemma on partner notification for HIV. BMC Int. Health Hum. Rights 11(1), 6 (2011) [DOI] [PMC free article] [PubMed]
- 41.Kruger W, Lebesa N, Lephalo K, Mahlangu D, Mkhosana M, Molise M, Segopa P, Joubert G. HIV-prevention measures on a university campus in South Africa—perceptions, practices and needs of undergraduate medical students. AJAR-Afr. J. AIDS Rec. 2020;19(2):156–163. doi: 10.2989/16085906.2020.1775663. [DOI] [PubMed] [Google Scholar]
- 42.Guo HL, Wang ZS, Sun SW, Xia CY. Interplay between epidemic spread and information diffusion on two-layered networks with partial mapping. Phys. Lett. A. 2021;398:127282. doi: 10.1016/j.physleta.2021.127282. [DOI] [Google Scholar]
- 43.Zhou YZ, Xia YJ. Epidemic spreading on weighted adaptive networks. Phys. A. 2014;399:16–23. doi: 10.1016/j.physa.2013.12.036. [DOI] [Google Scholar]
- 44.Gross, T., D’Lima, C.J.D., Blasius, B.: Epidemic dynamics on an adaptive network. Phys. Rev. Lett. 96(20), 208701 (2006) [DOI] [PubMed]
- 45.Nadini M, Sun KY, Ubaldi E, Starnini M, Rizzo A, Perra N. Epidemic spreading in modular time-varying networks. SCI Rep-UK. 2018;8:2352. doi: 10.1038/s41598-018-20908-x. [DOI] [PMC free article] [PubMed] [Google Scholar]
- 46.Ren GM, Wang XY. Epidemic spreading in time-varying community networks. Chaos. 2014;24(2):023116. doi: 10.1063/1.4876436. [DOI] [PMC free article] [PubMed] [Google Scholar]
- 47.Ma JL, van den Driessche P, Willeboordse FH. Effective degree household network disease model. J. Math. Biol. 2013;66:75–94. doi: 10.1007/s00285-011-0502-9. [DOI] [PubMed] [Google Scholar]
- 48.Perra N, Goncalves R, Goncalves B, Pastor-Satorras R, Vespignani A. Activity driven modeling of time varying networks. Sci. Rep. 2012;2:469. doi: 10.1038/srep00469. [DOI] [PMC free article] [PubMed] [Google Scholar]
Associated Data
This section collects any data citations, data availability statements, or supplementary materials included in this article.
Data Availability Statement
All data and materials can be obtained under the proposed model and algorithms.