

Highlights
-
•
We developed a deep learning system for automatic ICH detection and subtype classification.
-
•
Our method produced AUCs around 0.99 for each ICH subtype and won 1st place in the RSNA challenge.
-
•
Our method generalizes across two independent external validation datasets.
-
•
Visualization technique makes the system more easily acceptable for clinicians.
Keywords: Intracranial hemorrhage (ICH), Head CT, Deep learning, Image classification, Sequence model
Abstract
Acute Intracranial hemorrhage (ICH) is a life-threatening disease that requires emergency medical attention, which is routinely diagnosed using non-contrast head CT imaging. The diagnostic accuracy of acute ICH on CT varies greatly among radiologists due to the difficulty of interpreting subtle findings and the time pressure associated with the ever-increasing workload. The use of artificial intelligence technology may help automate the process and assist radiologists for more prompt and better decision-making. In this work, we design a deep learning approach that mimics the interpretation process of radiologists, and combines a 2D CNN model and two sequence models to achieve accurate acute ICH detection and subtype classification. Being developed using the extensive 2019-RSNA Brain CT Hemorrhage Challenge dataset with over 25000 CT scans, our deep learning algorithm can accurately classify the acute ICH and its five subtypes with AUCs of 0.988 (ICH), 0.984 (EDH), 0.992 (IPH), 0.996 (IVH), 0.985 (SAH), and 0.983 (SDH), respectively, reaching the accuracy level of expert radiologists. Our method won 1st place among 1345 teams from 75 countries in the RSNA challenge. We have further evaluated our algorithm on two independent external validation datasets with 75 and 491 CT scans, respectively, and our method maintained high AUCs of 0.964 and 0.949 for acute ICH detection. These results have demonstrated the high performance and robust generalization ability of our proposed method, which makes it a useful second-read or triage tool that can facilitate routine clinical applications.
1. Introduction
Intracranial hemorrhage (ICH), bleeding that occurs inside the cranium, is an emergency disease that can cause severe disability or even death (Qureshi et al., 2009). It may be caused by diverse pathology, including, trauma, hypertension, cerebral amyloid angiopathy, hemorrhagic conversion of ischemic infarction, cerebral aneurysms, cerebral arteriovenous malformations, dural arteriovenous fistula, vasculitis, venous sinus thrombosis, and etc (Heit et al., 2017, Lovelock et al., 2007). Population-based studies have estimated the world standardized annual incidence of ICH to be about 10–30 per 100 000 people (Qureshi et al., 2001, Labovitz et al., 2005). Although ICH represents only 10–15% of all strokes, it has been estimated to cause more than 50% of the overall stroke mortality (Nilsson et al., 2000). In addition, more than one-third of survivors end up with severe disability three months later (Øie et al., 2018).
Timely diagnosis of ICH is critical for deciding on the need and approach for emergent surgical intervention (Kuo et al., 2019). A majority of studies have indicated that most patients with acute ICH require a medical operation to control their blood pressure in time within 6 h of the symptom onset (Charlotte et al., 2018, Sprigg et al., 2018, Lili et al., 2016). Timely surgical evacuation may prevent expansion, decrease mass-effects, block the release of neuropathic products from hematomas, and thus prevent initiation of pathological processes (Qureshi et al., 2009). Therefore, early diagnosis and immediate treatment can be a lifesaver for these patients.
For central nervous system emergencies, such as acute traumatic brain injury, hemorrhage from an aneurysm, ischemic stroke, and hemorrhagic stroke, head computed tomography (CT) is often the first-line diagnostic tool for identifying the bleeding location and size due to its noninvasive nature and rapid 3D imaging ability (García-Blázquez et al., 2013). Correct assessment of acute intracranial hemorrhage types from head CT scans thus plays a decisive role in the subsequent clinical management of these diseases. It is also critical for deciding on an emergency surgical intervention and the choice of surgical methods.
Delayed or missed diagnosis, however, often occurs in clinical practice (Bello et al., 2019, GR et al., 2004), which can be attributed to the following major reasons. The first is that correct diagnosis of acute ICH and its subtypes based on CT images is very challenging even for experienced radiologists. The bleeding can be subtle with highly variable shape, size, and location even for the same ICH subtype (Kuo et al., 2019, Ker et al., 2019). The bleeding areas can also be easily confused with calcifications and/or stripping artifacts (Kuo et al., 2019, Cho et al., 2019, Patel et al., 2019). The second reason is the increased workload for radiologists. The manufacturers of CT imaging devices have continuously made efforts to improve image resolution by increasing the number of image slices per 3D scan (Rao et al., 2020). In addition, the number of patients undergoing head CT scans continues to increase every year (Rao et al., 2020, Robert et al., 2015). These factors combine to largely increase the workload of radiologists. It has been estimated that if a radiologist works for 8 h per day, he or she will have to finish examining each CT slice within about 3 s to meet the workload demand (Robert et al., 2015). The overloaded work may cause fatigue and interpretation errors (misdiagnosis or missed diagnosis).
It has been shown that peer-reviewing by the double reading of scans can help reduce the risk of diagnostic errors in clinical practice (Rao et al., 2020, Aslanian et al., 2013, Pow et al., 2016). This process, however, is labor-intensive and requires more utilization of radiologists’ time. Hence, it is difficult to implement in the current clinical situation (Rao et al., 2020). A more commonly adopted peer review process is the retrospective double reading of cases, as implemented by the American College of Radiology’s RadPeer program (Geijer and Geijer, 2018). However, this process is not real-time and does not provide immediate clinical benefit for the patients under treatment (Rao et al., 2020).
Recently, various deep learning-based artificial intelligence (AI) algorithms have been successfully developed for medical imaging interpretation tasks with accuracy equivalent to specialist physicians (Yu et al., 2018), such as the diagnosis of skin cancer, breast cancer detection, and the grading of diabetic retinopathy. Such AI techniques can potentially function as a second reader to ensure proper detection of high-impact subtle findings, and can also act as a triage tool to facilitate timely diagnosis of acute events. There already exist a few works on the development of deep convolutional neural network (CNN) methods for the automatic detection and/or classification of ICHs (Cho et al., 2019, Lee et al., 2019, Chilamkurthy et al., 2018, Ye et al., 2019, Nguyen et al., 2020). However, both the training and the validation datasets were rather limited in the reported studies. In addition, most of them only validate the classification accuracy on the scan level, instead of slice-by-slice as we pursue in this study.
In this work, we report a novel AI algorithm consisting of a 2D CNN classifier and two sequence models for the automatic detection of acute ICH and classification of its subtypes from non-contrast head CT scans. The design of our method is inspired by radiologists’ workflow, where the sequence models automatically learn the correlation across image slices to mimic the process of rolling pictures by radiologists in their decision-making. This design offers an effective solution to process large 3D images using 2D CNN models. Our method has been developed and validated using the large public datasets from the 2019-RSNA Brain CT Hemorrhage Challenge with over 25,000 head CT scans. The performance is further evaluated using two independent external datasets as will be explained later. The pipeline of our study is illustrated in Fig. 1.
Fig. 1.

The pipeline of our study. The AI system comprises three stages. In the first stage, a 2D CNN classifier is used to extract features and produce an initial prediction of ICH and its subtypes on each input slice. The generated feature vectors for all slices of a 3D scan are fed into Sequence Model 1 (the second stage) to get more refined and spatially coherent ICH detection results on every image slice. In the third stage, the classification results of the CNN classifier and Sequence Model 1 are assembled together and passed through Sequence Model 2 to perform adaptive model averaging. The output of Sequence Model 2 gives the final ICH prediction results for every slice of the input scan. Each DICOM file represents one 3D scan, which can be considered as a sequence of 2D slices.
2. Materials and methods
In this section, we detail the utilized datasets and the proposed deep learning system for automatic detection and classification of acute ICH and its five subtypes from non-contrast 3D head CT images. The Grad-CAM procedure for saliency map computation to enable model interpretation is also explained.
Dataset. The main dataset utilized in this paper comes from the 2019-RSNA Brain CT Hemorrhage Challenge.2 It was collected from three institutions (Stanford University (Palo Alto, Calif), Universidade Federal de São Paulo (São Paulo, Brazil) and Thomas Jefferson University Hospital (Philadelphia, Pa)), and re-annotated by the American Society of Neuroradiology (ASNR) with the contribution of more than 60 neuroradiologists (Flanders et al., 2020). The dataset consists of over one million images from 25272 examinations, which provides the largest multi-institutional and multinational dataset for the study of acute ICH detection and subtype classification. During the RSNA competition, the full dataset was released to the public in two batches (batch-1 and batch-2), each batch containing a distinct set of patients. In batch-1, 19530 CT scans (674258 slices) with slice-level ICH annotations were provided for algorithm training and validation, and the remaining 2214 CT scans (78545 slices) were used as the first set of test data (batch-1 test set). All 3528 CT scans (121232 slices) of batch-2 were later released as the second test set (batch-2 test set). Manual annotations for the batch-1 test data were made available to the public at the start of the second competition stage, whereas annotations for the batch-2 test data were not released. It should be emphasized that our model implements a multi-label classification scheme. Each scan or slice may contain more than one ICH subtype. Hence, the label for each image is not binary but represented by a 6-digit one-hot vector . The first binary digit indicates whether the image has ICH and the other five binary digits indicate the existence of each of the five subtypes, EDH, IPH, IVH, SAH, and SDH, respectively. In the RSNA dataset, 95606 slices in the training set and 10633 slices in the batch-1 test set contain two or more ICH subtypes, but the distribution of each ICH subtype is highly unbalanced. For example, only 1.5 of all CT scans contain EDH, which is consistent with everyday clinical observations (Ye et al., 2019). The detailed dataset characteristics can be found in Tables 1 and 2.
Table 1.
Dataset characteristics.
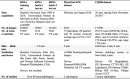 |
Table 2.
Data distribution characteristics of the utilized datasets.
| Label | Training set |
Test sets |
||||||||||||
|---|---|---|---|---|---|---|---|---|---|---|---|---|---|---|
| RSNA-train |
Batch-1 test set |
Batch-2 test set |
CQ500 |
PhysioNet-ICH |
||||||||||
| Scans | Slices | Scans | Slices | Scans | Slices | Scans | Slices | Scans | Slices | |||||
| ICH | 8003 | 97103 | 879 | 10830 | 1243 | 15902 | 205 | 18774 | 36 | 318 | ||||
| EDH | 313 | 2761 | 41 | 384 | 23 | 208 | 13 | 131 | 21 | 173 | ||||
| IPH | 4796 | 32564 | 525 | 3554 | 758 | 5468 | 134 | 6323 | 16 | 73 | ||||
| IVH | 3313 | 23766 | 379 | 2439 | 616 | 4546 | 28 | 2348 | 5 | 24 | ||||
| SAH | 3549 | 32122 | 383 | 3553 | 528 | 4908 | 60 | 9590 | 7 | 18 | ||||
| SDH | 3442 | 42496 | 370 | 4670 | 503 | 6555 | 53 | 6391 | 4 | 56 | ||||
| None | 11527 | 577155 | 1335 | 67715 | 2285 | 105330 | 286 | 152616 | 39 | 2496 | ||||
| Total | 19530 | 674258 | 2214 | 78545 | 3528 | 121232 | 491 | 171390 | 75 | 2814 | ||||
To allow direct comparison with competing methods in the 2019 RSNA challenge, we maintained the same splitting of training and testing data as provided by the challenge organizers, as clearly indicated in the top header of Table 2. In particular, the training set of the 2019 RSNA challenge is used as our model training data. The testing data consist of the two test sets (batch-1 and batch-2) of the 2019 RSNA challenge. All experiments reported in the manuscript follow the same data splitting scheme. In addition, the code of our proposed method has been made publicly available,3 which should make it easier for other researchers to reproduce our results.
In addition to the batch-1 and batch-2 test sets of the RSNA challenge, we further validate our algorithm on two independent external datasets, namely, the PhysioNet-ICH dataset4 (Hssayeni, 2020, Goldberger et al., 2000) and the CQ500 dataset5 (Chilamkurthy et al., 2018). The overall characteristics of these two extra test datasets can also be found in Tables 1 and 2.
The PhysioNet-ICH dataset (version 1.3.1) includes a total of 75 participants (36 with ICH and 39 normal controls) with a total of 2814 slices (318 with bleeding and 2496 normal images). The number of CT scans (slices) for each subtype is 5(24) IVHs, 16(73) IPHs, 7(18) SAHs, 21(173) EDHs, and 4(56) SDHs. All the data were collected from the Al Hilla Teaching Hospital-Iraqare and scanned using a Siemens/SOMATOM Definition AS CT scanner with a slice thickness of 5 mm. The bleeding regions and subtypes were manually annotated by two experienced radiologists.
The CQ500 dataset consists of a total of 491 CT scans, including 205 with ICHs, 40 fractures, 65 middle shifts, 127 mass effect, and 54 normal controls. The 205 ICH scans contain all five subtypes, including 28 IVHs, 134 IPHs, 60 SAHs, 13 EDHs, and 53 SDHs. The CQ500 dataset was collected from multiple radiology centers in New Delhi, India. The utilized CT scanners were either GE or Philips brand, with 6 different models in total, including GE BrightSpeed, GE Discovery CT750 HD, GE LightSpeed, GE Optima CT660, Philips MX 16-slice, and Philips Access-32 CT. The annotation of each ICH subtype was manually performed by three senior radiologists with around 10 years of clinical experience in head CT interpretation.
System design. The overall architecture of the proposed AI system is shown in Fig. 1 and Supplementary Fig. 2, which consists of three major stages. In the first stage, a CNN classifier is trained using 2D slices with ground truth manual ICH labels. Once trained, the CNN classifier can be applied on each slice of a head scan to produce an initial estimation of the existence of each ICH subtype. The CNN classifier also serves as a feature extractor, where the output feature map at the last convolution layer is taken as an abstract representation of the input image. The Sequence Model 1 (Supplementary Fig. 2b) at the next stage then takes the feature outputs from the first stage classifier for all slices of a 3D scan as inputs, and applies a bi-directional RNN with the GRU unit to generate a refined estimation of the ICH subtypes for every slice. The RNN model takes into account 3D context information and also serves as a regulator to ensure spatially coherent estimation of ICH occurrences. This RNN model simulates the rolling picture reviewing process of human experts. The last stage uses another RNN model (Supplementary Fig. 2c) with the GRU unit to implement the idea of stacked generalization ensemble, i.e., a new model learns how to best combine the predictions from multiple existing models. Consequently, the prediction outputs from the first classifier and the Sequence Model 1 for all corresponding slices of a 3D scan are assembled together and used as the input to the second RNN model (Sequence Model 2). Once trained, the Sequence Model 2 outputs the final prediction of ICH subtypes on every slice of an input head CT. In order to enable the model to automatically handle slice thickness differences, we also use slice thickness information as an additional input feature to the Sequence Model 2. Other metadata could also be incorporated if available.
To fully exploit the feature learning ability of deep convolutional neural networks and the benefits of ensemble learning, we create different versions of feature representation by changing the backbone network of the CNN classifier in the first stage. In particular, three popular networks for image classification are utilized, including SE-Resnext101 (Hu et al., 2018), Densenet169 (Huang et al., 2017), and Densenet121 (Huang et al., 2017). Each backbone network leads to a different CNN classifier for the first stage, which serves as a different sub-model for the ensemble learning in the last stage.
Window settings as data preprocessing. Due to the large dynamic range of CT image intensity, usually 12 or 16 bits, it is impossible to display all image details on the monitor screen at one time. During clinical interpretation, radiologists often apply multiple display window settings (window-width and window-level) to highlight different intensity ranges to check for subtle abnormalities. For example, the brain window (window level 40/width 80) and the subdural window (level 80/width 200) are frequently used when reviewing brain CTs as they make intracranial hemorrhage more conspicuous, and may help in the detection of thin acute subdural hematomas (Jacobson, 2012). The bone window (level 600/width 2800) is another crucial setting that helps to identify skull lesions. A fracture observed in the bone window may indicate the presence of additional axial bleeding that needs to be further diagnosed in the brain window (Lee et al., 2019). To mimic the reviewing strategy of radiologists, we preprocess each image by first applying the three window settings and then converting each result to an 8-bit grayscale image. The three converted images are then assembled as the three channels of an RGB image and used as an input to the 2D CNN classifier in the first stage.
Network optimization criterion. Using the RSNA training data, the network parameters for the deep learning models in all three stages are optimized to minimize the discrepancy between the model outputs with the ground truth manual labelling. In this work, the multi-label binary cross-entropy loss function (also known as the log-loss) is adopted to measure the discrepancy, which is defined as follows:
| (1) |
where indicates the ground truth manual label of the sample for the class, N denotes the number of training samples, and C is the number of classes. C equals 6 in this work, including ICH and its five subtypes. Each target may have more than one positive value because a CT slice may contain multiple ICH subtypes. Thus, this is a multi-label classification problem. represents the predicted ICH probabilities, which has the same dimension as the ground truth . is a weight value assigned to the c-th class. Empirically, is set to 2 for the overall ICH class and 1 for the five ICH subtypes.
Network training procedure. Training of the CNN classifier applies 5-fold cross-validation with a mini-batch size of 32 slices to optimize the model parameters. The Adam optimizer (Kingma and Ba, 2014) is used as the optimization method. A cosine annealing strategy (Loshchilov and Hutter, 2016) is utilized to adaptively adjust the learning rate with the initial learning rate set to 0.0005. A weight decay of 0.00002 is added to the cost function to reduce the risk of overfitting. Real-time data augmentation is also performed to make the model learn features invariant to geometric perturbations. The augmentation transformations thus include random cropping, random scaling, random flipping, and random rotation. The data augmentation also addresses the problem of overfitting and improves the generalization ability of the trained models even when the number of training data is limited.
Training of both sequence models adopts 10-fold cross-validation with a mini-batch size of 128 CT scans. Adam optimization (Kingma and Ba, 2014) with a simple step-wise learning rate decay scheme is applied with the initial learning rate set to 0.0004. The learning rate is reduced by a factor of 10 at the 20th and the 30th epoch, with the total number of epochs set to 40. Random sequence subsampling is used as the data augmentation technique for the sequence model training that randomly selects 24 slices from each CT volume.
All models are implemented using the PyTorch framework and all experiments are performed on a workstation equipped with an Intel(R) Xeon(R) E5-2680 v4 2.40 GHz CPU and four 24 GB memory NVIDIA Tesla P40 GPU cards.
Saliency map creation. To help visualize the decision support for the trained ICH classifier, the gradient-weighted class attention map (Grad-CAM) technique (Selvaraju et al., 2017) is adopted to highlight the regions in each image that are most relevant to the final model prediction. To obtain the Grad-CAM, the first step is to compute the class-specific weight of each feature map in the last convolution layer (Selvaraju et al., 2017):
| (2) |
where denotes the weight parameter for the feature map corresponding to the class. Z is the total number of pixels of all the feature maps. represents the model prediction for the class. represents the feature value at location of the feature map.
The saliency map can then be calculated by multiplying the obtained weights with the corresponding feature maps and then summing up the weighted feature maps:
| (3) |
where denotes the feature map. The rectified linear unit (ReLU) nonlinear function is applied to highlight only the image locations that are positively correlated with the prediction of the class.
3. Results
The AI system development. Our deep learning method for acute ICH detection and subtype classification was first developed and validated through participating in the RSNA challenge. In particular, the first batch of 19530 CT scans with slice-level ICH annotations were used as the development data. From them, we randomly select 1/5 cases with ICH and 1/5 cases without ICH as a validation dataset for hyperparameter tuning.
The proposed multi-stage AI system comprises three major stages: a convolution neural network (CNN) classifier and two sequence models, as will be detailed in the Methods section. The CNN classifier is trained on 2D image slices, which aims to provide a preliminary estimation of the existence of ICH and its subtypes for each slice. The two sequence models then refine the estimation by taking into account 3D context information and outputs from earlier models. In particular, the first sequence model applies a gated recurrent unit (GRU)-based recurrent neural network (RNN) on the slice-wise feature outputs of the CNN classifier to exploit long-range spatial dependencies in a 3D volume. The second sequence model is another RNN trained using the outputs of both the CNN classifier and the first sequence model, as well as meta-information about the slice thickness. It adaptively performs weighted model averaging and learns to automatically correct prediction errors from the models of earlier stages.
The incremental performance improvement offered by adding each sequence model compared to the baseline CNN classifier can be seen in Table 3. The results were obtained by training the models on the RSNA batch-1 training data and then tested on the batch-1 test set. To further improve the accuracy for ICH detection and subtype classification, we adopt an ensemble learning strategy, where the above described system is trained three times using three different backbones for the CNN classifier (Methods). The unweighted average of probabilities predicted by the three different models is taken as the final result for each test image. The performance of the ensemble model on the batch-1 test data is listed in the last row of Table 3, which clearly offers the best accuracy. All results reported later are obtained by the ensemble model approach.
Table 3.
Performance at different stages of the proposed method (evaluated on the RSNA batch-1 test set).
| Log_loss | AUC | Specificity | Sensitivity | |
|---|---|---|---|---|
| 2D-CNN | 0.064 | 0.961 (0.9594–0.9631) | 0.903 (0.8956–0.9147) | 0.889 (0.8775–0.8775) |
| 2D-CNN + Seq_model 1 | 0.060 | 0.967 (0.9656–0.9690) | 0.914 (0.9024–0.9284) | 0.904 (0.8903–0.9173) |
| 2D-CNN + Seq_model 1 + Seq_model 2 | 0.058 | 0.975 (0.9738–0.9765) | 0.926 (0.9140–0.9301) | 0.919 (0.9301–0.9308) |
| Model_ensemble | 0.054 | 0.988 (0.9873–0.9889) | 0.944 (0.9371–0.9466) | 0.950 (0.9460–0.9575) |
Evaluation of the AI system on the RSNA and two independent test datasets. The performance of our proposed method was evaluated using the 2019-RSNA test data, as well as the two independent external validation datasets, PhysioNet-ICH and CQ500. Since the manual annotation of the RSNA batch-2 test set was never released, detailed evaluation results were only obtained on the batch-1 test set with 2214 scans and 78545 slices.
Fig. 2 shows the ROC (receiver operating characteristic) curves for the detection of ICH and its five subtypes on the three test datasets. Detailed metrics, including the area under the ROC curve (AUC), sensitivity, and specificity, are summarized in Table 4. As can be expected, the accuracy on the RSNA test data was higher than that on the independent validation data, but most of the AUCs were higher than 0.95, which showed a very robust performance of the proposed method.
Fig. 2.

ROC curves of our AI algorithm evaluated on three test data sets: the RSNA batch-1 test set, the PhysioNet-ICH, and the CQ500 datasets for predicting (a) ICH, (b) EDH, (c) IPH, (d) IVH, (e) SAH, and (f) SDH. The “RSNA-1” means the batch-1 test set from the 2019-RSNA Brain CT Hemorrhage Challenge.
Table 4.
Performance of the proposed AI system for automatic ICH detection and subtype classification on the 2019-RSNA challenge, PhysioNet-ICH, and CQ500 datasets.
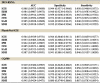 |
On the RSNA test data, the overall detection accuracy for ICH was 0.988 (95% CI 0.9873–0.9889) in terms of AUC, 0.944 (95% CI 0.9371–0.9466) of specificity, and 0.950 (95 % CI 0.9460–0.9575) of sensitivity. For individual subtypes, the highest detection accuracy was achieved for IVH, with an AUC of 0.996 (95% CI 0.9954–0.9969), a specificity of 0.974 (95% CI 0.9631–0.9806), and a sensitivity of 0.975 (95% CI 0.9672–0.9852). The SDH showed the worst detection accuracy with an AUC of 0.983 (95% CI 0.9818–0.9847), a specificity of 0.932 (95% CI 0.9266–0.9266), and a sensitivity of 0.946 (95% CI 0.9323–0.9529).
For the detection and classification of ICHs on the two external datasets (PhysioNet-ICH and CQ500), the proposed AI algorithm performed slightly better on the PhysioNet-ICH dataset with an AUC of 0.964 (95% CI 0.9549–0.9731) for ICH overall, 0.953 (95% CI 0.9405–0.9648) for EDH, 0.964 (95% CI 0.9467–0.9807) for IPH, 0.985 (95% CI 0.9673–1.0000) for IVH, 0.962 (95% CI 0.9313–0.9935) for SAH, and 0.987 (95% CI 0.9780–0.9951) for SDH. On the CQ500 dataset, the algorithm produced an AUC of 0.949 (95% CI 0.9480–0.9507) for ICH overall, 0.980 (95% CI 0.9764–0.9830) for EDH, 0.981 (95% CI 0.9792–0.9821) for IPH, 0.992 (95% CI 0.9903–0.9931) for IVH, 0.906 (95% CI 0.9034–0.9088) for SAH, and 0.945 (95% CI 0.9424–0.9471) for SDH.
Comparison with the top-performing teams in the RSNA challenge. Our team participated in the 2019-RSNA brain CT hemorrhage challenge with the proposed method, which allowed a direct comparison of our method with other state-of-the-art algorithms. In the challenge, the multi-label binary cross-entropy loss (log-loss) (Bishop, 2006) was used as the metric to assess the performance of each participating algorithm. Smaller log-loss values indicate more accurate detection and classification of the ICH and its subtypes. Results from each team were submitted to and evaluated by the challenge organizers independently on two batches of test data as mentioned earlier. The performance of the top 10 teams can be found in the final leaderboard (Supplementary Table 1). The bold text in each column denotes the best accuracy or the lowest log-loss. Our method produced the lowest log-loss of 0.054 for the batch-1 and 0.04383 for the batch-2 test sets, respectively, which ranked our team at the 1st place in the challenge.
Saliency maps for decision visualization. Given a head CT scan, the AI system predicts the probability of ICH and its 5 subtypes for each slice of the 3D volume. To help visualize the model decision and increase interpretability, we apply the Grad-CAM (gradient-weighted class saliency map) algorithm (Selvaraju et al., 2017) to generate saliency maps that highlight the regions leading to the model decision. The saliency maps are computed automatically following the procedure explained in Section 2. They correspond to regions of the image that contribute most to the final decision of the deep learning model. It should be noted that the saliency maps are not intended for a precise segmentation of the bleeding areas, but only provide a rough localization of the detected ICH or its subtypes. For the two external datasets, manual delineations of the ICH lesions were provided. We can thus directly compare the automatically generated saliency maps with the corresponding manual annotations to judge the usefulness of the visualization technique.
Fig. 3 shows some examples of the saliency maps for the five ICH subtypes using data from the two external test sets. In each subfigure, the left column is the original CT image; the middle column shows the saliency map automatically computed; and the right column shows the manual annotation of the corresponding bleeding region(s) by experienced radiologists. It is seen that the generated saliency maps by the AI method overlap very well with the manually drawn bleeding areas for all five bleeding types in both datasets. This demonstrates that the trained network has learned to focus on the correct areas to make its prediction. It should be noted that the training data only have slice-level ICH labels but no delineations of the bleeding areas. Thus, the AI model can learn to locate the ICH regions even without fine-grained annotations for model training.
Fig. 3.

Visualization of model predictions using saliency maps on the CQ500 dataset (left panel (a)–(e)) and the PhysioNet-ICH dataset (right panel (f)–(j)). In each subfigure, the original CT slice (left column), the corresponding saliency map (middle column), and the manual annotation by experienced radiologists (right column) are shown. In the saliency maps, warmer colors represent more relevant regions for the model prediction of the corresponding bleeding type. The same color scale is used for all the saliency maps, which is indicated by the color bar. The brain window is used for displaying the CT images.
For ICH detection, small calcifications can be easily confused as small bleeding areas as they also appear as high densities in CT images. From the saliency maps shown in Fig. 3(a) and (b), it is observed that our AI system can correctly ignore the calcification areas and make an accurate prediction for each of the ICH subtypes.
As can be observed in Fig. 3, the image resolutions vary in the two datasets, which are due to different slice thickness settings of the CT scans. In the PhysioNet-ICH dataset, each patient has only one CT scan and the slice thickness is fixed at 5 mm. In the CQ500 dataset, each patient has multiple CT scans with different slice thicknesses (0.625 mm, 3 mm, and 5 mm). Thinner slices provide better contrast and finer image details at the expense of higher radiation dose to the patients. Our approach directly uses the slice thickness as an extra input in the second sequence model. Results from these figures and Table 4 show that our model can robustly handle slice thickness differences and produce accurate results on both thin and thick slice head CT scans, which makes it a reliable tool in real clinical environments.
4. Discussions
Intracranial hemorrhage is a life-threatening health problem requiring rapid and often intensive medical attention and treatment (Qureshi et al., 2009). However, in clinical practice, misdiagnosis and missed diagnosis still exist due to the difficulty in interpreting subtle signs for the bleeding regions and increased workload for radiologists (Vermeulen and Schull, 2007). An automatic computer-aided diagnosis (CAD) system with high accuracy and robust performance can act as a second reader and patient triage tool to better utilize critical medical resources and improve patient care. To solve the ICH classification problem, traditional machine learning methods would rely on manually defined image features (Shahangian and Pourghassem, 2016, Muschelli et al., 2017, Liao et al., 2010), the design of which requires a lot of algorithmic and clinical domain knowledge. In addition, it is difficult to handle large shape and appearance variations of ICHs in real data due to the limited capacity of traditional classification models. In contrast, deep learning models can automatically learn task-specific feature representations and discover intricate hidden patterns directly from the data. The high capacity of a deep learning model with millions of parameters also makes it possible to solve complex problems involving a significant number of interdependent variables. Deep learning technology has become the method of choice for many image analysis problems ever since it outperformed traditional machine learning methods by a large margin in the 2012 ImageNet image classification challenge (Huang et al., 2017, Krizhevsky et al., 2012). Deep learning methods have also shown very high accuracy comparable to human experts in various medical image analysis problems (Kuo et al., 2019, Coudray et al., 2018, Poplin et al., 2018). In this work, we adopted this newer technology and developed a deep learning-based AI system for automatic acute ICH detection and classification. The development makes use of by far the largest multi-institutional and multinational head CT dataset from the 2019-RSNA Brain CT Hemorrhage Challenge. Our method won 1st place in the challenge, and was also shown to maintain very high performance on two independent external datasets.
On the RSNA test data, the proposed method produced very high accuracy in terms of AUC, specificity, and sensitivity, for all 5 ICH subtypes (cf. Table 4). The accuracy was the highest for the IVH subtype. This is likely due to the relatively fixed position of IVH, which appears as bright regions inside the brain ventricles (Flanders et al., 2020). SDH was the most difficult to detect, which can be attributed to the following factors. Firstly, The location of SDH is highly variable and can occur in holohemispheric, parafalcine, bilateral tentorial, frontotemporal, and left anterior temporal areas (Kuo et al., 2019). The shape and size of SDH vary significantly as well. In particular, small SDHs are common in the test data, which are challenging to detect. Secondly, An isodense SDH and its adjacent tissues (brain parenchyma) have very similar image intensity values (Kuo et al., 2019), which requires the algorithm to be able to detect subtle differences in the image. Thirdly, SDHs also share similar characteristics with other bleeding types. For example, SDHs and EDHs have very similar image texture (Shahangian and Pourghassem, 2016), which causes misclassification between the two subtypes. Because of these challenges, it is also difficult to ensure correct manual labelling of the SDH for method development and evaluation.
The developed system has also shown very good performance on two independent external datasets, namely the PhysioNet-ICH and the CQ500. The PhysioNet-ICH dataset was released very recently by Hssayeni et al. (Hssayeni, 2020) mainly for brain bleeding region segmentation. No other study has reported ICH detection results using this data. The CQ500 dataset was released by Chilamkurthy et al. (Chilamkurthy et al., 2018) for ICH classification and has been utilized by a couple other groups, which allows us to compare our method with these related works. Chilamkurthy et al. (Chilamkurthy et al., 2018) adopted a ResNet18 model for scan-level ICH classification and reported AUCs of 0.9419 (ICH), 0.9731 (EDH), 0.9544 (IPH), 0.9310 (IVH), 0.9574 (SAH), and 0.9521 (SDH) respectively for ICH and its five subtypes. Nguyen et al. (Nguyen et al., 2020) utilized a cascaded CNN-LSTM architecture for end-to-end ICH classification, and also used the CQ500 dataset as their external test set. The corresponding AUCs achieved were 0.9613 (ICH), 0.9731 (EDH), 0.9674 (IPH), 0.9858 (IVH), 0.9696 (SAH), and 0.9644 (SDH). We noticed that both methods evaluated classification accuracy at the scan-level, rather than the slice-by-slice evaluation as we reported in the Results section and in the RSNA challenge. The scan-level accuracy tends to be higher since not all occurrences of each subtype need to be detected. To allow a fair comparison with these reported works, we also computed scan-level classification results using a similar approach as Nguyen et al. (Nguyen et al., 2020), where the maximum probability across all slices is taken as the scan-level probability for each subtype. By this way, we obtained AUCs of 0.985 (ICH), 0.980 (EDH), 0.982 (IPH), 0.988 (IVH), 0.947 (SAH), and 0.959 (SDH). More detailed comparison results can be found in Supplementary Table 2. As can be seen, our method produced the best overall ICH detection accuracy, and also higher classification accuracy for all subtypes except for the SAH by Chilamkurthy et al. (Chilamkurthy et al., 2018) and the SAH and SDH by Nguyen et al. (Nguyen et al., 2020). As pointed out in the literature (Kuo et al., 2019, Ye et al., 2019, Shahangian and Pourghassem, 2016, Strub et al., 2007), the SAH and SDH subtypes are more challenging to detect and may be easily confused with other subtypes, even for experienced radiologists. Thus, there could be some labeling inconsistency between the RSNA data for our method development and the CQ500 test data.
In addition to the two works mentioned above (Chilamkurthy et al., 2018, Nguyen et al., 2020), there are three other methods proposed in the literature for ICH detection and classification from head CT images (Cho et al., 2019, Lee et al., 2019, Ye et al., 2019). Accuracy comparison in terms of AUC between our method and these related works is summarized in Supplementary Table 2. Three studies have compared their algorithm performance with that of radiologists (Lee et al., 2019, Chilamkurthy et al., 2018, Ye et al., 2019). Chilamkurthy et al. (Chilamkurthy et al., 2018) claimed that their method had sensitivities indistinguishable from three expert raters but specificities were significantly lower at the high sensitivity operation point. As shown in the left of Supplementary Fig. 1, our algorithm produced much higher specificities while maintaining high sensitivities. Lee et al. (Lee et al., 2019) and Ye et al. (Ye et al., 2019) reported sensitivity/specificity of 0.924/0.949 and 0.99/0.99 respectively for ICH detection using their own test data, and concluded that the accuracy was comparable to radiologists. But the test data were collected from a single institution and rather limited in size (196 cases in (Lee et al., 2019) and 299 cases in (Ye et al., 2019)). In addition, the accuracies were calculated on the scan-level instead of slice-by-slice, similar to (Chilamkurthy et al., 2018, Nguyen et al., 2020). As explained earlier, the scan-level accuracy tends to be higher than the slice-by-slice evaluation. Our method produced slice-level and scan-level sensitivity/specificity of 0.950/0.944, 0.945/0.995, respectively, on the multi-institutional RSNA test sets with 2214 scans, which outperformed all competing methods in the RSNA challenge.
All existing methods applied 2D deep learning models for ICH detection, but some of them further incorporated 3D context information using various schemes (Supplementary Table 2). Lee et al. (Lee et al., 2019) used a slice interpolation technique to consider dependencies between adjacent slices, but only local context information was taken into account. Ye et al. (Ye et al., 2019) and Nguyen et al. (Nguyen et al., 2020) both applied an RNN sequence model to integrate long range 3D context information to improve detection accuracy. In our method, we proposed to apply a cascade of two sequence models to fully exploit long range context information and better integrate image features both locally and globally. Extra information such as the slice thickness was also built into the second sequence model. It was shown that the two sequence models further improved the ICH detection and classification accuracy.
A major strength of deep learning models comes from their high capacity with millions of trainable parameters or features. Altogether, they form a complex non-linear mapping from the input image to the output prediction result. These features are all interdependent and it is difficult to interpret the meaning of every individual feature or understand the contribution of each feature using the traditional multivariate analysis method. Hence, deep learning methods are often considered non-transparent black boxes. For clinical uses, it is important to make the model prediction interpretable or traceable by human experts. As the results in Fig. 3 demonstrated, the saliency map generated by the Grad-CAM method can serve as a very useful tool to alert human users about the important regions most relevant to the predictions of the AI model. The results also showed that the AI model can automatically learn to locate the bleeding regions even though the training data only have slice-level categorical ICH labels but not detailed delineations of the lesion areas. This is known as weakly supervised learning, which is a very important property of deep learning for medical applications since manual labeling of diseased areas can be very time-consuming and labor-intensive to acquire.
As observed in Table 4, the performance of the proposed method on the two external datasets (PhysioNet-ICH and the CQ500) is slightly worse than on the RSNA test set. This is mainly due to differences in the image acquisition protocols and scanner machines as well as possible differences in patient characteristics. In the 2019-RSNA challenge, all the data are carefully curated such that incomplete or erroneous slices are removed and all scans have similar resolution (Flanders et al., 2020). However, the two external validation datasets have largely varying slice thicknesses and the images appear to be more noisy (Chilamkurthy et al., 2018, Hssayeni, 2020, Goldberger et al., 2000). The performance drop is not due to the smaller sample size of the external validation data. To verify this, we have created a similarly small RSNA test set by randomly selecting 10% samples from the 2019-RSNA batch-1 test data. The performance metrics on this small RSNA test set are summarized in Supplementary Table 3. Comparing with Table 4, it can be seen that the accuracy measures on this much smaller dataset remain about the same as on the full 2019-RSNA test set and still clearly higher than that of the external test data.
Compared with existing algorithms for ICH subtype classification (Cho et al., 2019, Lee et al., 2019, Chilamkurthy et al., 2018, Ye et al., 2019, Nguyen et al., 2020) (cf. Supplementary Table 2), our method takes better account of both intra-slice and inter-slice image information. The multi-stage design also allows the RNN model at the last stage to automatically learn to correct prediction errors of the models in the earlier stages. The limitation is that training of the whole model is more complex and more time-consuming. The inference time is also longer than a single model. But once the models are trained, applying them to a new CT scan is still very fast, which in total only takes about 90 ms per slice. The inference speed is sufficient for real-time diagnosis assistance.
The design of the current study also has some limitations. First, detailed patient clinical information and data collection parameters were not provided in the RSNA data. Therefore, it is impossible to study the individual effects of various factors on the model performance, such as scanner type, cause of bleeding, and patient demographics. Second, the current method is only developed and tested on head CT images. Other imaging modalities, especially MRI, are also used in ICH screening and diagnosis. Third, the external validation data (PhysioNet-ICH and CQ500) are still quite scarce. More thorough clinical validation of the developed system is necessary before it can be deployed in the real clinical workflow.
5. Code availability
The source code of the proposed AI algorithm is made publicly available for research purposes athttps://github.com/Scu-sen/1st-RSNA-Intracranial-Hemorrhage-Detection.
CRediT authorship contribution statement
Xiyue Wang: Conceptualization, Methodology, Software, Writing - original draft. Tao Shen: Conceptualization, Methodology, Software, Writing - original draft. Sen Yang: Conceptualization, Methodology, Software, Writing - original draft. Jun Lan: Visualization, Validation. Yanming Xu: Visualization, Validation. Minghui Wang: Formal analysis, Investigation. Jing Zhang: Supervision, Writing - review & editing, Project administration.
Acknowledgements
The Radiological Society of North America organized the ICH classification challenge and provided the slice-level annotations for each ICH subtype. This research was funded by the National Natural Science Foundation of China (No. 61571314), Science & technology department of Sichuan Province (No. 2020YFG0081), and the Innovative Youth Projects of Ocean Remote Sensing Engineering Technology Research Center of State Oceanic Administration of China (No. 2015001).
Footnotes
Supplementary data associated with this article can be found, in the online version, athttps://doi.org/10.1016/j.nicl.2021.102785.
Contributor Information
Jing Zhang, Email: jing_zhang@scu.edu.cn.
Xiao Han, Email: haroldhan@tencent.com.
Supplementary data
The following are the Supplementary data to this article:
References
- Aslanian H.R. Nurse observation during colonoscopy increases polyp detection: a randomized prospective study. Gastrointestinal Endoscopy. 2013;108:166–172. doi: 10.1038/ajg.2012.237. [DOI] [PubMed] [Google Scholar]
- Bello H.R. Skull base–related lesions at routine head CT from the emergency department: pearls, pitfalls, and lessons learned. RadioGraphics. 2019;39:1161–1182. doi: 10.1148/rg.2019180118. [DOI] [PubMed] [Google Scholar]
- Bishop, C.M., 2006. Pattern recognition and machine learning, Springer.
- Charlotte Intracerebral haemorrhage: current approaches to acute management. The Lancet. 2018;392:1257–1268. doi: 10.1016/S0140-6736(18)31878-6. [DOI] [PubMed] [Google Scholar]
- Chilamkurthy S. Deep learning algorithms for detection of critical findings in head CT scans: a retrospective study. The Lancet. 2018;392:2388–2396. doi: 10.1016/S0140-6736(18)31645-3. [DOI] [PubMed] [Google Scholar]
- Cho J. Improving sensitivity on identification and delineation of intracranial hemorrhage lesion using cascaded deep learning models. Journal of Digital Imaging. 2019;32:450–461. doi: 10.1007/s10278-018-00172-1. [DOI] [PMC free article] [PubMed] [Google Scholar]
- Coudray N. Classification and mutation prediction from non–small cell lung cancer histopathology images using deep learning. Nature Medicine. 2018;24:1559–1567. doi: 10.1038/s41591-018-0177-5. [DOI] [PMC free article] [PubMed] [Google Scholar]
- Flanders A.E. Construction of a machine learning dataset through collaboration: the RSNA 2019 brain CT hemorrhage challenge. Radiology. Artificial Intelligence. 2020;2:1–7. doi: 10.1148/ryai.2020190211. [DOI] [PMC free article] [PubMed] [Google Scholar]
- García-Blázquez V. Accuracy of CT angiography in the diagnosis of acute gastrointestinal bleeding: systematic review and meta-analysis. European Radiology. 2013;23:1181–1190. doi: 10.1007/s00330-012-2721-x. [DOI] [PubMed] [Google Scholar]
- Geijer H., Geijer M. Added value of double reading in diagnostic radiology, a systematic review. Insights into Imaging. 2018;9:287–301. doi: 10.1007/s13244-018-0599-0. [DOI] [PMC free article] [PubMed] [Google Scholar]
- Goldberger A.L. PhysioBank, PhysioToolkit, and PhysioNet: components of a new research resource for complex physiologic signals. Circulation. 2000;101:215–220. doi: 10.1161/01.cir.101.23.e215. [DOI] [PubMed] [Google Scholar]
- G, R. et al. Initial misdiagnosis and outcome after subarachnoid hemorrhage. Journal of the American Medical Association 291, 866–869 (2004). [DOI] [PubMed]
- Heit J.J., Iv M., Wintermark M. Imaging of intracranial hemorrhage. Journal of Stroke. 2017;19:11. doi: 10.5853/jos.2016.00563. [DOI] [PMC free article] [PubMed] [Google Scholar]
- Hssayeni M.D. Intracranial hemorrhage segmentation using a deep convolutional model. Data. 2020;5:14–32. [Google Scholar]
- Huang G., Liu Z., Van Der Maaten L., Weinberger K.Q. Proceedings of the IEEE Conference on Computer Vision and Pattern Recognition. 2017. Densely connected convolutional networks; pp. 4700–4708. [Google Scholar]
- Hu J., Shen L., Sun G. In Proceedings of the IEEE Conference on Computer Vision and Pattern Recognition. 2018. Squeeze-and-excitation networks; pp. 7132–7141. [Google Scholar]
- Jacobson S.A. Clinical laboratory medicine for mental health professionals. (American Psychiatric Pub. 2012 [Google Scholar]
- Ker J. Image thresholding improves 3-dimensional convolutional neural network diagnosis of different acute brain hemorrhages on computed tomography scans. Sensors. 2019;19:2167–2169. doi: 10.3390/s19092167. [DOI] [PMC free article] [PubMed] [Google Scholar]
- Kingma, D.P., Ba, J., 2014. Adam: a method for stochastic optimization. arXiv preprint arXiv:1412.6980.
- Krizhevsky A., Sutskever I., Hinton G.E. Imagenet classification with deep convolutional neural networks. Advances in Neural Information Processing Systems. 2012;25:1097–1105. [Google Scholar]
- Kuo W., Häne C., Mukherjee P., Malik J., Yuh E.L. Expert-level detection of acute intracranial hemorrhage on head computed tomography using deep learning. Proceedings of the National Academy of Sciences. 2019;116:22737–22745. doi: 10.1073/pnas.1908021116. [DOI] [PMC free article] [PubMed] [Google Scholar]
- Labovitz D.L., Halim A., Boden-Albala B., Hauser W., Sacco R. The incidence of deep and lobar intracerebral hemorrhage in whites, blacks, and hispanics. Neurology. 2005;65:518–522. doi: 10.1212/01.wnl.0000172915.71933.00. [DOI] [PubMed] [Google Scholar]
- Lee H. An explainable deep-learning algorithm for the detection of acute intracranial haemorrhage from small datasets. Nature Biomedical Engineering. 2019;3:173–185. doi: 10.1038/s41551-018-0324-9. [DOI] [PubMed] [Google Scholar]
- Liao C.C., Xiao F., Wong J.M., Chiang I.J. Computer-aided diagnosis of intracranial hematoma with brain deformation on computed tomography. Computerized Medical Imaging and Graphics. 2010;34:563–571. doi: 10.1016/j.compmedimag.2010.03.003. [DOI] [PubMed] [Google Scholar]
- Lili Early blood pressure lowering in patients with intracerebral haemorrhage and prior use of antithrombotic agents: pooled analysis of the interact studies. Journal of Neurology Neurosurgery and Psychiatry. 2016;87:1330–1335. doi: 10.1136/jnnp-2016-313246. [DOI] [PubMed] [Google Scholar]
- Loshchilov I., Hutter F.S.G.D.R. 2016. stochastic gradient descent with warm restarts. arXiv preprint arXiv:1608.03983. [Google Scholar]
- Lovelock C., Molyneux A., Rothwell P. Change in incidence and aetiology of intracerebral haemorrhage in oxfordshire, UK, between 1981 and 2006: a population-based study. The Lancet Neurology. 2007;6:487–493. doi: 10.1016/S1474-4422(07)70107-2. [DOI] [PubMed] [Google Scholar]
- Muschelli J. PItcHPERFeCT: Primary intracranial hemorrhage probability estimation using random forests on CT. NeuroImage: Clinical. 2017;14:379–390. doi: 10.1016/j.nicl.2017.02.007. [DOI] [PMC free article] [PubMed] [Google Scholar]
- Nguyen, N.T., Tran, D.Q., Nguyen, N.T., Nguyen, H.Q. 2020. A CNN-LSTM architecture for detection of intracranial hemorrhage on CT scans. arXiv preprint arXiv:2005.10992.
- Nilsson O., Lindgren A., Ståhl N., Brandt L., Säveland H. Incidence of intracerebral and subarachnoid haemorrhage in southern sweden. Journal of Neurology, Neurosurgery & Psychiatry. 2000;69:601–607. doi: 10.1136/jnnp.69.5.601. [DOI] [PMC free article] [PubMed] [Google Scholar]
- Øie L.R. Functional outcome and survival following spontaneous intracerebral hemorrhage: a retrospective population-based study. Brain and Behavior. 2018;8:1–9. doi: 10.1002/brb3.1113. [DOI] [PMC free article] [PubMed] [Google Scholar]
- Patel A. Intracerebral haemorrhage segmentation in non-contrast CT. Scientific Reports. 2019;9:1–11. doi: 10.1038/s41598-019-54491-6. [DOI] [PMC free article] [PubMed] [Google Scholar]
- Poplin R. Prediction of cardiovascular risk factors from retinal fundus photographs via deep learning. Nature Biomedical Engineering. 2018;2:158–164. doi: 10.1038/s41551-018-0195-0. [DOI] [PubMed] [Google Scholar]
- Pow R.E., Mello-Thoms C., Brennan P. Evaluation of the effect of double reporting on test accuracy in screening and diagnostic imaging studies: a review of the evidence. Journal of Medical Imaging and Radiation Oncology. 2016;60:306–314. doi: 10.1111/1754-9485.12450. [DOI] [PubMed] [Google Scholar]
- Qureshi A.I. Spontaneous intracerebral hemorrhage. New England Journal of Medicine. 2001;344:1450–1460. doi: 10.1056/NEJM200105103441907. [DOI] [PubMed] [Google Scholar]
- Qureshi A.I., Mendelow A.D., Hanley D.F. Intracerebral haemorrhage. The Lancet. 2009;373:1632–1644. doi: 10.1016/S0140-6736(09)60371-8. [DOI] [PMC free article] [PubMed] [Google Scholar]
- Rao B. Utility of artificial intelligence tool as a prospective radiology peer reviewer-detection of unreported intracranial hemorrhage. Academic Radiology. 2020;28:85–93. doi: 10.1016/j.acra.2020.01.035. [DOI] [PubMed] [Google Scholar]
- Robert The effects of changes in utilization and technological advancements of cross-sectional imaging on radiologist workload. Academic Radiology. 2015;22:1191–1198. doi: 10.1016/j.acra.2015.05.007. [DOI] [PubMed] [Google Scholar]
- Selvaraju R.R. Proceedings of the IEEE International Conference on Computer Vision. 2017. Grad-CAM: visual explanations from deep networks via gradient-based localization; pp. 618–626. [Google Scholar]
- Shahangian B., Pourghassem H. Automatic brain hemorrhage segmentation and classification algorithm based on weighted grayscale histogram feature in a hierarchical classification structure. Biocybernetics and Biomedical Engineering. 2016;36:217–232. [Google Scholar]
- Sprigg N. Tranexamic acid for hyperacute primary intracerebral haemorrhage (TICH-2): an international randomised, placebo-controlled, phase 3 superiority trial. Journal of Emergency Medicine. 2018;391:2107–2115. doi: 10.1016/S0140-6736(18)31033-X. [DOI] [PMC free article] [PubMed] [Google Scholar]
- Strub W., Leach J., Tomsick T., Vagal A. Overnight preliminary head CT interpretations provided by residents: locations of misidentified intracranial hemorrhage. American Journal of Neuroradiology. 2007;28:1679–1682. doi: 10.3174/ajnr.A0653. [DOI] [PMC free article] [PubMed] [Google Scholar]
- Vermeulen M.J., Schull M.J. Missed diagnosis of subarachnoid hemorrhage in the emergency department. Stroke. 2007;38:1216–1221. doi: 10.1161/01.STR.0000259661.05525.9a. [DOI] [PubMed] [Google Scholar]
- Ye H. Precise diagnosis of intracranial hemorrhage and subtypes using a three-dimensional joint convolutional and recurrent neural network. European Radiology. 2019;29:6191–6201. doi: 10.1007/s00330-019-06163-2. [DOI] [PMC free article] [PubMed] [Google Scholar]
- Yu K.H., Beam A.L., Kohane I.S. Artificial intelligence in healthcare. Nature Biomedical Engineering. 2018;2:719–731. doi: 10.1038/s41551-018-0305-z. [DOI] [PubMed] [Google Scholar]
Associated Data
This section collects any data citations, data availability statements, or supplementary materials included in this article.