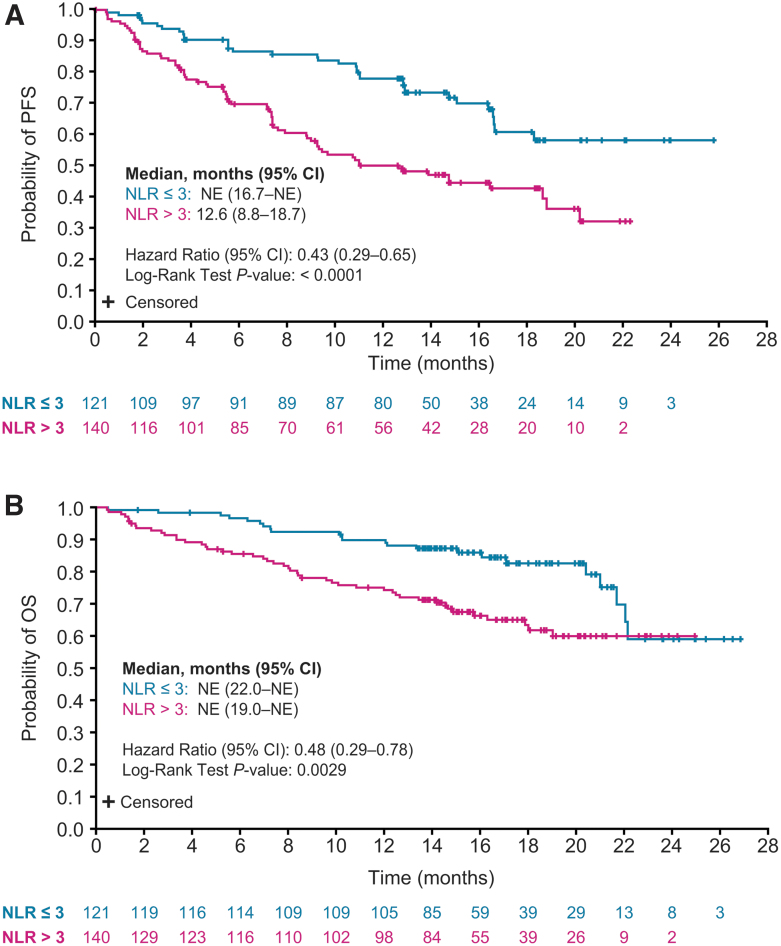
FIG. 3.
Kaplan–Meier plots of PFS (A) and OS (B) in patients randomly assigned to receive lenvatinib by NLR (≤3 or >3). OS and PFS medians were calculated by Kaplan–Meier estimates, and the corresponding 95% CIs were calculated with a generalized Brookmeyer and Crowley method. The HRs were estimated from an unstratified Cox proportional hazard model, and p-values were based on an unstratified log-rank test. NLR, neutrophil-to-lymphocyte ratio.

