Abstract
The Fanconi Anemia (FA) pathway is essential for the repair of DNA interstrand crosslinks. Central to the pathway is the FA Core complex, a ubiquitin ligase of nine subunits that monoubiquitinates the FANCI-FANCD2 (ID) DNA clamp. The 3.1 Å of the 1.1 MDa human FA Core complex, described here, reveals an asymmetric assembly with two copies of all but the FANCC, FANCE and FANCF subunits. The asymmetry is crucial, as it prevents the binding of a second FANCC-FANCE-FANCF subcomplex that inhibits the recruitment of the UBE2T ubiquitin conjugating enzyme, and instead creates an ID binding site. A single active site then ubiquitinates FANCD2 and FANCI sequentially. We also present the 4.2 Å structures of the human Core-UBE2T-ID-DNA complex in three conformations captured during monoubiquitination. They reveal the Core-UBE2T complex remodeling the ID-DNA complex, closing the clamp on the DNA prior to ubiquitination. Monoubiquitination then prevents clamp opening after release from the Core.
Fanconi Anemia (FA) is a recessive syndrome of chromosome instability and cancer predisposition1. The FA proteins define a replication-dependent pathway that leads to the excision of a DNA interstrand crosslink (ICL) from one DNA strand, its bypass from the other strand, and repair by homologous recombination2-7. FA proteins are also implicated in the protection and recovery of stalled replication forks1,2,8,9.
The Core complex E3 ubiquitin ligase consists of FANCA, FANCB, FANCC, FANCE, FANCF, FANCG, FANCL, and the non-FA proteins FAAP100 and FAAP202. FANCL contains a RING domain that recruits the UBE2T ubiquitin conjugating E2 enzyme10,11 as other RING E3s12. FANCL, FANCB and FAAP100 form a subcomplex that can support low levels of monoubiquitination in vitro, while the rest of the subunits can form the FANCA-FANCG-FAAP20 and FANCC-FANCE-FANCF subcomplexes13-20. The isolated FANCL-FANCB-FAAP100 forms a 2-fold symmetric dimer of hetero-trimers21. It was thus suggested that it assembles with two copies of the remaining subunits for the simultaneous monoubiquitination of the paralogs FANCI and FANCD2 (ID)21. However, a recent cryo-EM analysis of the chicken Core complex reported that it contains single copies of the FANCA-FANCG-FAAP20 and FANCC-FANCE-FANCF subcomplexes22. The roles of the other subunits are poorly understood.
ID monoubiquitination, which is DNA dependent15,23-26, results in a major structural transformation of the FANCI-FANCD2 interface, which consists of the paralogs’ N-terminal helical-repeat solenoids (NTDs) and has the ubiquitination sites sequestered within it27,28. Upon ubiquitination, this interface is separated and replaced by reciprocal interactions between the ubiquitin of one paralog and the NTD of the other. An additional, new interface between the C-terminal helical-repeat domains (CTDs) of the paralogs completes the closing of a ring that encircles the DNA and acts as a sliding clamp28,29. Little is known about the mechanism of this transformation.
Results
Structure determination
The nine-subunit human FA Core complex was produced from a stably transfected HEK-293F cell line (Extended Data Fig. 1a). The initial consensus reconstruction of apo-Core (671,972 particles) extended to an overall resolution of 3.4 Å as determined by the gold-standard fourier shell correlation (FSC) procedure (Extended Data Fig. 1b; Table 1). Focused 3D refinements using seven masks yielded reconstructions with the highest common resolution of 3.1 Å, except for portions of the FANCA dimer at 3.4 Å (Extended Data Fig. 1b; cryo-EM density for subunit interfaces shown in Supplementary Fig. 1).
Table 1.
Cryo-EM data collection, refinement and validation statistics
| FA core (EMD-23085, PDB- 7KZP) |
FA core-ID (EMD- 23086, PDB- 7KZQ) |
FA core-UBE2T-ID (EMD-23087, PDB- 7KZR) |
FA core-UBE2T-ID-DNA (ID open state: EMD-23088, PDB-7KZS; ID intermediate state: EMD-23089, PDB-7KZT; ID closed state: EMD- 23090, PDB-7KZV) |
||||
|---|---|---|---|---|---|---|---|
| Data collection and processing | |||||||
| Magnification | 22,500 | 22,500 | 22,500 | 22,500 | |||
| Voltage (kV) | 300 | 300 | 300 | 300 | |||
| Electron exposure (e–/Å2) | 65 | 65 | 60 | 36.5 | |||
| Defocus range (μm) | 0.8-3.5 | 0.8-3.5 | 0.8-3.5 | 0.9-3.2 | |||
| Pixel size (Å) | 1.089 | 1.089 | 1.072 | 1.056 | |||
| Symmetry imposed | C1 | C1 | C1 | C1 | |||
| Initial particle images (no.) | 671,972 | 289,005 | 295,721 | 531,808 | |||
| Final particle images (no.) | 671,972 | 76,111 | 114,249 | 332,563 | 40,749 | 69,111 | 74,481 |
| Map resolution (Å) | ID+ subset | Open | Intermediate | Closed | |||
| Consensus reconstruction | 3.4 | 4.2 | 4.4 | 4.1 | 6.2 | 4.7 | 4.7 |
| Focus 1 reconstruction | 3.1 | 3.9 | 4.1 | 3.5 | 4.1 | 3.9 | 3.9 |
| Focus 2 reconstruction | 3.1 | 4.5 | 3.9 | 3.5 | 4.5 | 4.3 | 4.1 |
| Focus 3 reconstruction | 3.1 | 4.3 | 4.0 | 3.4 | 4.2 | 3.9 | 4.2 |
| Focus 4 reconstruction | 3.1 | 4.2 | 3.7 | 4.2 | 4.2 | 4.3 | |
| Focus 5 reconstruction | 3.7 | 4.2 | |||||
| Focus 6 reconstruction | 3.4 | ||||||
| Focus 7 reconstruction | 3.4 | ||||||
| FSC threshold | 0.143 | 0.143 | 0.143 | 0.143 | 0.143 | 0.143 | 0.143 |
| Map resolution range (Å) | |||||||
| Consensus reconstruction | 3.2-9.3 | 4.0-20.6 | 4.0-20.9 | 3.5-18.5 | 4.6-23.5 | 4.1-22.9 | 4.1-21.7 |
| Focus 1 reconstruction | 3.0-3.8 | 3.7-10.0 | 4.1-13 | 3.3-5.9 | 3.9-18 | 3.8-13.4 | 3.7-12.8 |
| Focus 2 reconstruction | 3.0-4.3 | 4.5-24.4 | 3.9-10.8 | 3.3-6.5 | 4.2-20.9 | 3.8-19.2 | 3.7-16.5 |
| Focus 3 reconstruction | 3.0-5.1 | 4.0-11.7 | 4.0-17.4 | 3.2-7.7 | 4.2-21.2 | 3.9-16.2 | 4.1-17.0 |
| Focus 4 reconstruction | 3.2-6.3 | 4.1-10.3 | 3.6-20.9 | 4.2-24.9 | 4.1-24.9 | 4.3-17.9 | |
| Focus 5 reconstruction | 3.6-4.8 | 4.2-24 | |||||
| Focus 6 reconstruction | 3.3-5.3 | ||||||
| Focus 7 reconstruction | 3.3-5.7 | ||||||
| Refinement | |||||||
| Initial model used | De novo modelling/2IQC/3K1L/3ZQS | FA Core/3S4W/2ILR | FA Core/3S4W/2ILR/4CCG | FA Core/3S4W/2ILR/4CCG | |||
| Model resolution (Å) | 3.1 | 4.3 | 4.2 | - | 4.2 | 4.2 | 4.2 |
| FSC threshold | 0.55 | 0.81 | 0.55 | - | 0.74 | 0.71 | 0.67 |
| Model resolution range (Å) | 20.0-3.1 | 20.0-4.3 | 314.6-4.2 | - | 20.0-4.2 | 20.0-4.2 | 40.0-4.2 |
| Map sharpening B factor (Å2) | −(85-110) | −(68-94) | −(68-137) | - | −(91-132) | −(96-133) | −(99-145) |
| Model composition | |||||||
| Non-hydrogen atoms | 64,462 | 85,275 | 86,745 | - | 87,800 | 87,510 | 88,223 |
| Protein residues | 8,218 | 10,829 | 11,021 | - | 11,021 | 11,001 | 11,053 |
| DNA residues | - | - | - | - | 1,025 | 902 | 1,189 |
| Ligand | 3 | 5 | 5 | - | 5 | 5 | 5 |
| B factors (Å2) | |||||||
| Protein | 152 | 308 | 254 | - | 262 | 283 | 289 |
| DNA | - | - | - | - | 365 | 506 | 420 |
| Ligand | 104 | 235 | 249 | - | 211 | 236 | 242 |
| R.m.s. deviations | |||||||
| Bond lengths (Å) | 0.014 | 0.015 | 0.011 | - | 0.009 | 0.009 | 0.010 |
| Bond angles (°) | 1.623 | 1.706 | 1.400 | - | 1.867 | 1.979 | 2.092 |
| B factors main chain (Å2) | 4.1 | 4.0 | 2.8 | - | 3.184 | 3.608 | 3.543 |
| B factors side chain (Å2) | 3.7 | 3.0 | 2.0 | - | 2.326 | 2.866 | 2.658 |
| Validation | |||||||
| MolProbity score | 1.61 | 2.09 | 1.97 | - | 2.63 | 2.92 | 2.88 |
| Clashscore | 2.99 | 9.02 | 7.71 | - | 8.42 | 11.21 | 10.93 |
| Poor rotamers (%) | 0.73 | 0.33 | 0.17 | - | 6.49 | 10.18 | 8.96 |
| Ramachandran plot | |||||||
| Favored (%) | 90.81 | 87.54 | 90.22 | - | 89.61 | 88.68 | 88.15 |
| Allowed (%) | 8.61 | 12.1 | 9.48 | - | 9.42 | 10.18 | 10.46 |
| Disallowed (%) | 0.58 | 0.36 | 0.30 | - | 0.97 | 1.14 | 1.39 |
| Rwork (%) | 30.6 | 31.86 | 31.29 | - | 32.83 | 33.53 | 32.55 |
| Average FSC | 0.84 | 0.86 | 0.77 | - | 0.85 | 0.839 | 0.831 |
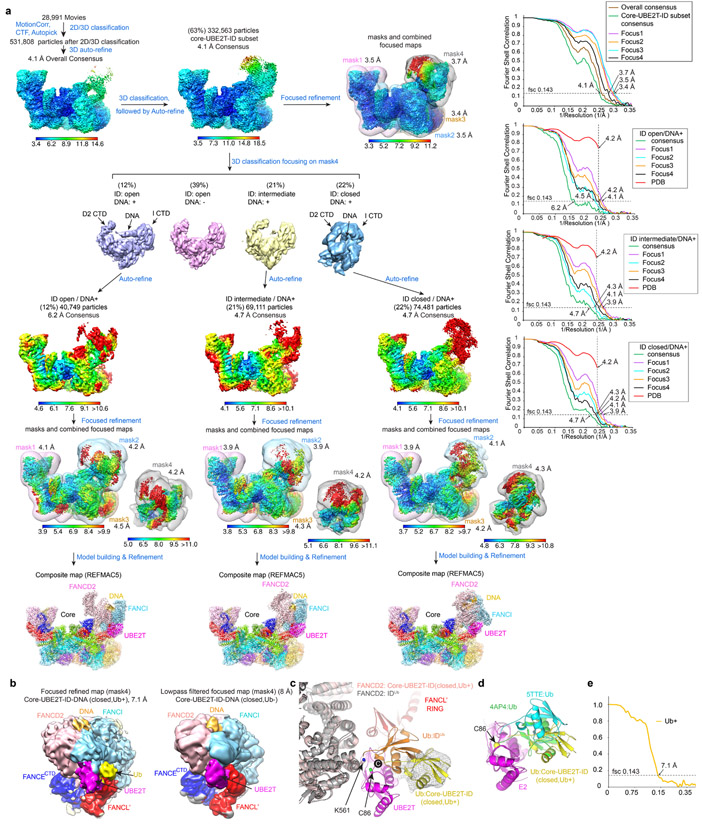
Cryo-EM data of the monoubiquitination reaction was collected from a 3-minute time point with a ~20 % yield of monoubiquitinated FANCD2. In initial 3D classifications, 63 % of the Core particles (332,563) contained bound ID (Extended Data Fig. 2a). Of these, 22 % had the ID-DNA complex in a closed-ring conformation very similar to that of the monoubiquitinated ID complex28 (thereafter IDUb), except neither FANCD2 nor FANCI were ubiquitinated. A more sensitive method, masked 3D-classification with partial signal subtraction, also failed to identify any monoubiquitinated ID particles, even though it could readily identify ubiquitin on UBE2T (Extended Data Fig. 2b-e). This suggests that ubiquitination triggers ID release from the Core.
In the remainder of the particles from the monoubiquitination reaction, the overall ID conformation resembled the open-trough conformation of the non-ubiquitinated structure27,28, with FANCI and FANCD2 interacting along their NTDs. In contrast to the closed-ring particles, only 46 % of these had DNA (Extended Data Fig. 2a). Further 3D classifications of DNA-containing particles showed the FANCD2 CTD to be highly mobile, its conformation ranging from a fully-open state (37 %) to a partially-closed state where it has pivoted towards the FANCI CTD, poised to form the CTD-CTD interface of IDUb. Particles lacking DNA exhibited only the fully-open ID conformation. Because this conformation was also present in an isolated Core-ID data set (Extended Data Fig. 1c and Table 1), we presume it represents the initial, basal state of the ID substrate on the Core, with the partially-closed state reflecting an intermediate state that is DNA-dependent and precedes ring closure. The structures of these three conformations were determined at 4.2 Å with focused reconstructions (Extended Data Fig. 2a and Table 1).
Overall Structures of the Core and Core-UBE2T-ID-DNA complexes
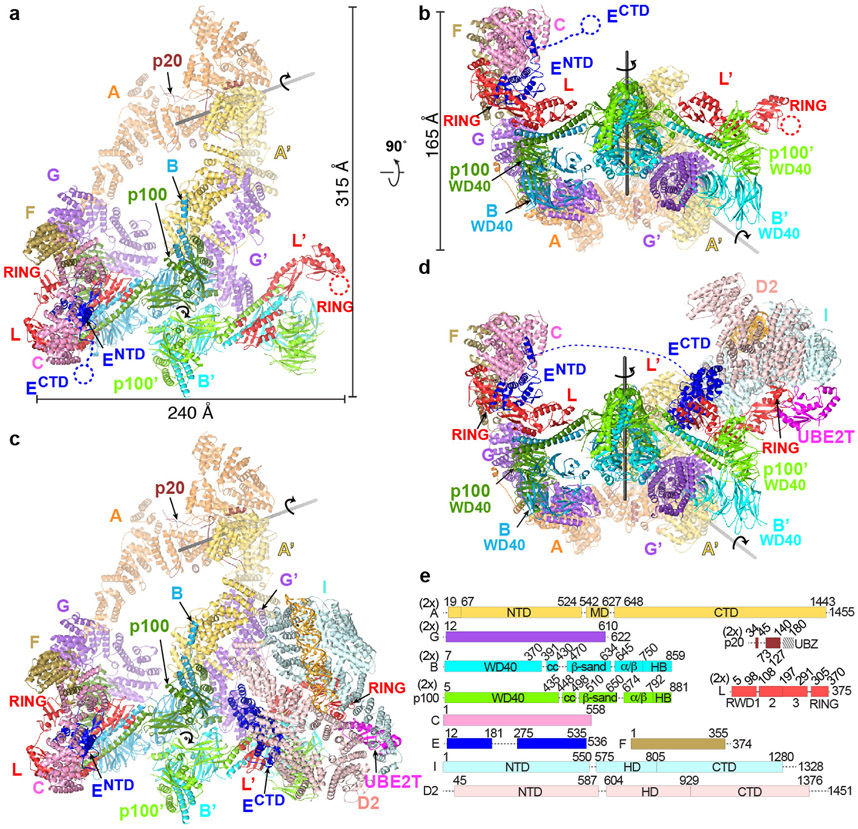
The Core complex has a flat appearance with approximate dimensions of 315 by 240 by 165 Å. The bulk of its mass is in a compact body from which three arms made up of two FANCA molecules extend and meet at a distal tip (Fig. 1a, b). The complex contains a single copy of the FANCC-FANCE-FANCF subcomplex, and while the remaining subunits are present in two copies, most are arranged non-symmetrically and have non-equivalent interactions (secondary structure and conservation of each subunit in Supplementary Fig. 2).
Figure 1 ∣. Overall Structures of apo-Core and Core-UBE2T-ID-DNA complexes.
a, Core complex cartoon representation with individual subunits (labeled) colored according to schematic in e, except for FANCA and FANCB-FAAP100 where the second protomer is in a darker shade. View looking down the 2-fold symmetry axis (marked) of the FANCB-FAAP100 hub. The FANCA dimer axis is shown as a gray line. Protomers present on the right side have a prime symbol next to their label. Select domains are labeled. Dashed circles indicate disordered domains. b, View looking up the vertical axis of a. c, Cartoon representation of the open-conformation Core-UBE2T-ID-DNA complex in the same orientation as a. FANCI is light cyan, FANCD2 light pink, UBE2T magenta and DNA gold. Dashed blue line indicates the disordered residues between FANCENTD and FANCECTD. d, View looking up the vertical axis of c. e, Linear representation of Core complex subunits, marked by “2x” if present in two copies. Dashed lines indicate disordered segments >10 residues.
The particle body is organized around a dimer of FANCB-FAAP100 heterodimers (Extended Data Fig. 3a-i). Their C-terminal portions form a locally 2-fold symmetric center, while their N-terminal portions extend out to opposite sides of the particle and bind to a copy of FANCL and the FANCG-FANCA-FAAP20 subcomplex in a non-symmetric arrangement. FANCL in turn binds to FANCC-FANCE-FANCF only on one side of the particle (left on Fig. 1a). The other side has an altered conformation of FANCL, as well as distinct position, orientation and packing of FANCG (thereafter subunits at this side are designated by the prime symbol; Fig. 1a-b). This is associated with the two FANCA molecules having distinct conformations and positions relative to the FANCG on which they are anchored (Extended Data Fig. 3j-m). FANCA is the only other subunit that forms a homodimer, but its symmetry is unrelated to that of FANCB-FAAP100, as the two symmetry axes are 131 Å apart and at a 55° angle (Fig. 1a, b, Extended Data Fig. 3n).
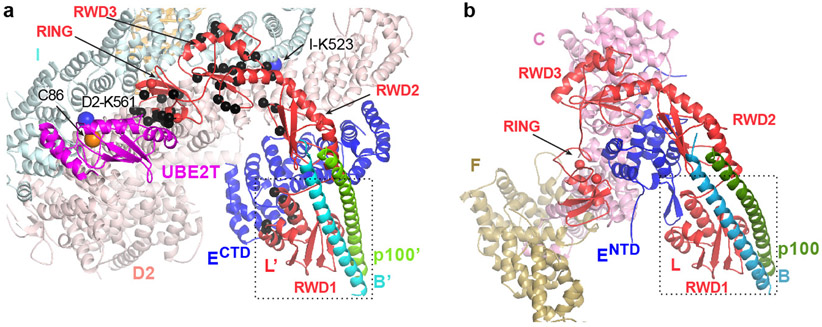
The asymmetric composition and arrangement of subunits are essential for binding to the ID complex, which occupies the overall area where a second FANCC-FANCE-FANCF would have been in a symmetric complex (Fig. 1c, d). Central to ID binding is FANCL’, which binds to the exterior bottom of the trough-shaped ID, interacting with both FANCI and FANCD2. FANCL’ also binds to the FANCE C-terminal domain (FANCECTD), which in turn interacts extensively with FANCD2 as well30 (Fig. 2a, b). The FANCECTD, which is connected to the FANCE N-terminal domain (FANCENTD) at the other side of the body through a 92 amino acid unstructured segment spanning 110 Å, is disordered in apo-Core (Fig. 1a, b). Lastly, FANCL’ also recruits UBE2T, which interacts with both FANCI and FANCD2 with its active site juxtaposed to the FANCD2 ubiquitination site (Fig. 2a). None of these FANCL’ interactions can be made by FANCL because it is entirely sequestered by the FANCC-FANCENTD-FANCF subcomplex (Fig. 2; Extended Data Fig. 4). To reflect this, we will be referring to the side of the particle that contains FANCC-FANCENTD-FANCF as inactive, and the other as active.
Figure 2 ∣. FANCL at the active and inactive sides of Core-UBE2T-ID-DNA.
a-b, Close-up views of the active (a) and inactive (b) sides of the Core-UBE2T-ID-DNA complex showing FANCC-FANCE-FANCF sequesters FANCL’ residues required for ID and FANCECTD binding (only subunits or portions thereof near FANCL’ are shown). Active-side FANCL’ residues marked with black Cα spheres correspond to residues sequestered within 3.8 Å of FANCC- FANCENTD-FANCF at the inactive side. Dotted box indicates the portions of FANCL-FANCB-FAAP100 aligned to equivalently orient the views of the two sides. In a, FANCI Lys523 and FANCD2 Lys561 are marked by large blue spheres, and UBE2T Cys86 by an orange sphere.
Core complex structure and asymmetry
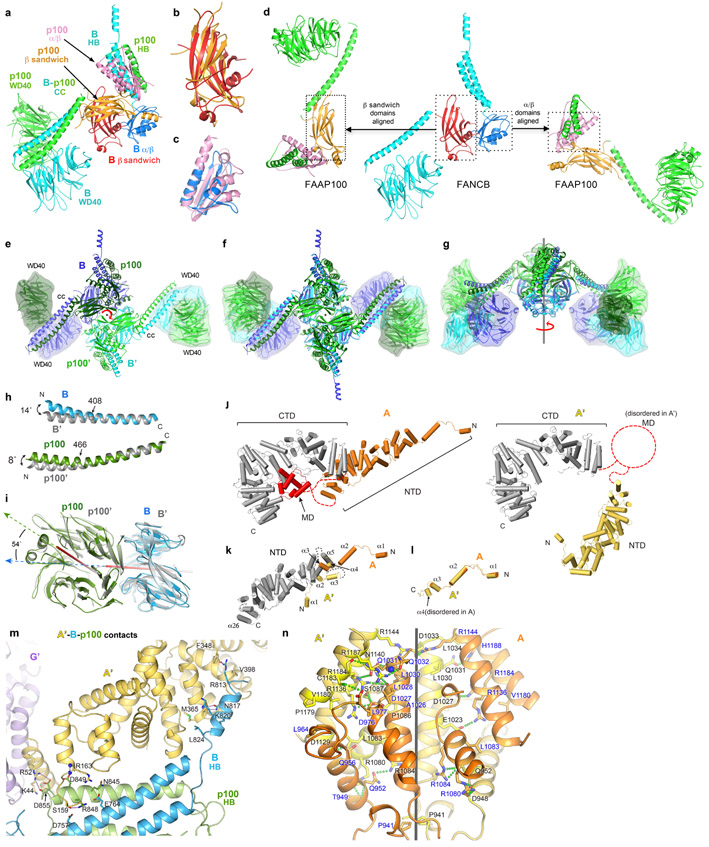
The FANCB-FAAP100 dimer of heterodimers likely serves as the initial assembly hub, as its formation buries ~20,000 Å2 of surface area. FANCB and FAAP100 are likely evolutionarily related, because they have the same domain architecture consisting of WD40, coiled-coil, β sandwich, α/β, and helical bundle (HB) domains (Fig. 1e, Extended Data Fig. 3a-d). The individual domains of the two proteins are closely related. The β sandwich domains superimpose with a 2.1 Å root mean square deviation (r.m.s.d.) for 64 of 152 Cα atoms, while the α/β domains superimpose with a 1.9 Å r.m.s.d. for 55 of 93 Cα atoms (Extended Data Fig. 3b-c). However, FANCB and FAAP100 have very divergent domain-domain packing arrangements. When superimposed on their β sandwich domains, their α/β and WD40 domains are essentially flipped along nearly orthogonal directions (Extended Data Fig. 3d). Similarly, superposition of the α/β domains results in divergent positions and orientations for the rest of the domains (Extended Data Fig. 3d). The paralogs FANCB and FAAP100 heterodimerize through each of the WD40, coiled-coil, β sandwich, α/β, and HB domains packing with the paralog’s corresponding domain (Extended Data Fig. 3a). Heterodimerization buries ~15,500 Å2 of surface area relative to the monomeric proteins in the same conformation.
The FANCB-FAAP100 heterodimer homodimerizes through the C-terminal β sandwich, α/β and HB domains (Extended Data Fig. 3e). These domains form a locally 2-fold symmetric center, and they can be superimposed on a 2-fold rotated copy with a root mean square deviation of 0.76 Å in the positions of 1,268 Cα atoms. The two coiled-coils then extend away from the center to opposite sides of the hub, each supporting a WD40-WD40 pair. However, the WD40-WD40 pairs and most of the coiled-coil domains do not obey the 2-fold symmetry of the center (Extended Data Fig. 3f, g). The WD40-WD40 pairs make only minor contacts to the coiled coils, and these are different in the two copies, with one coiled-coil interacting with the FANCB WD40 and the other with the FAAP100’ WD40. The coiled-coil helices at the two sides also have different bends (Extended Data Fig. 3h). By contrast, the isolated WD40-WD40 pairs from the two sides superimpose with a 0.7 Å r.m.s.d. for 613 of 694 Cα atoms (Extended Data Fig. 3i). The non-symmetric arrangements of the two WD40-WD40 pairs are likely caused by differences in their interactions with other core subunits (Extended Data Fig. 3e-i).
FANCA consists of a highly conserved, 67-residue N-terminal extended segment that binds to FANCG (Extended Data Fig. 3l, 6c-f). This segment and its associated FANCG are rotated by ~132° relative to the rest of FANCA in the two sides of the Core complex, and it appears to be flexibly linked to the rest of FANCA (Extended Data Fig. 3k). After this segment, FANCA contains an N-terminal, mid, and C-terminal structural domains (thereafter NTD, MD and CTD) with intervening linkers unstructured. The larger NTD and CTD, which are made up of HEAT repeats, pack together in the inactive-side FANCA, with the smaller helical MD packing with the CTD. By contrast, in the active-side FANCA’, the NTD and CTD are uncoupled and in distinct relative orientations, while the MD is disordered. After CTD superposition (1.3 Å r.m.s.d. for 631 of 722 Cα atoms), the NTD domains of FANCA and FANCA’ require a 153° rotation and 27 Å translation along the rotation axis to be brought to register (Extended Data Fig. 3j). FANCA dimerizes through a CTD segment that consists of five irregular helical repeats (Extended Data Fig. 3n, See Supplementary Note 2 for additional discussion of the FANCA dimer structure). The dimer symmetry is close to but not exactly C2, with a rotation of 168° but also a translation of 2 Å for the five helical repeats. As such, while the interface contains the same structural elements from both protomers, nearly half of the residues that make intermolecular contacts are unique to either FANCA or FANCA’, and the residues in common make mostly non-equivalent contacts (Extended Data Fig. 3n).
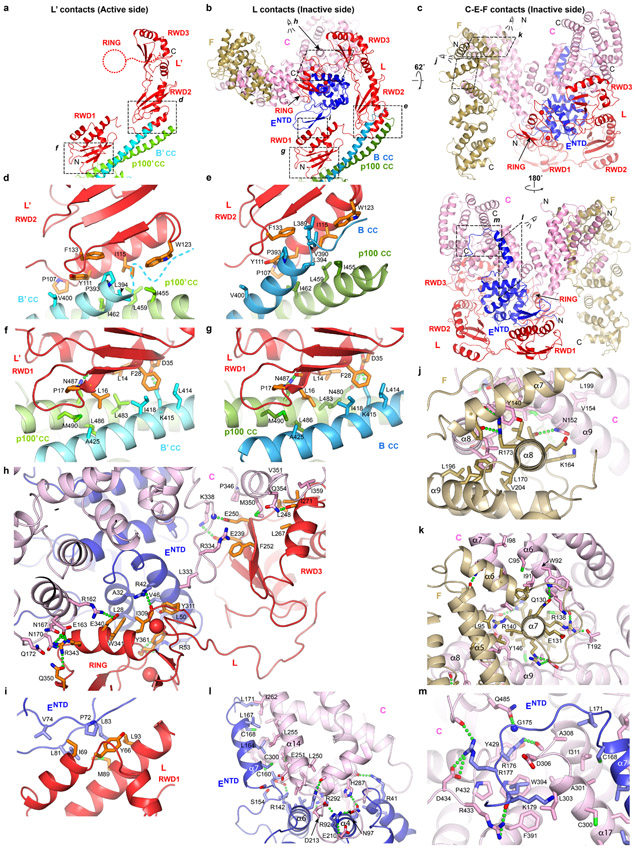
The FANCB-FAAP100 hub binds to two copies of the FANCL subunit13,21, which consists of three RWD domains followed by the RING domain10. Each FANCL uses its RWD1 and RWD2 domains to bind to a FANCB-FAAP100 coiled-coil similarly (Fig. 2a, c, Extended Data Fig. 4a-g, see Supplementary Note 3 for additional discussion of intermolecular contacts of FANCL and of FANCC-FANCENTD-FANCF). In a hypothetical assembly sequence that helps illustrate the source of asymmetry, this would be the first step after the formation of the FANCB-FAAP100 hub (Extended Data Fig. 5a, step1).
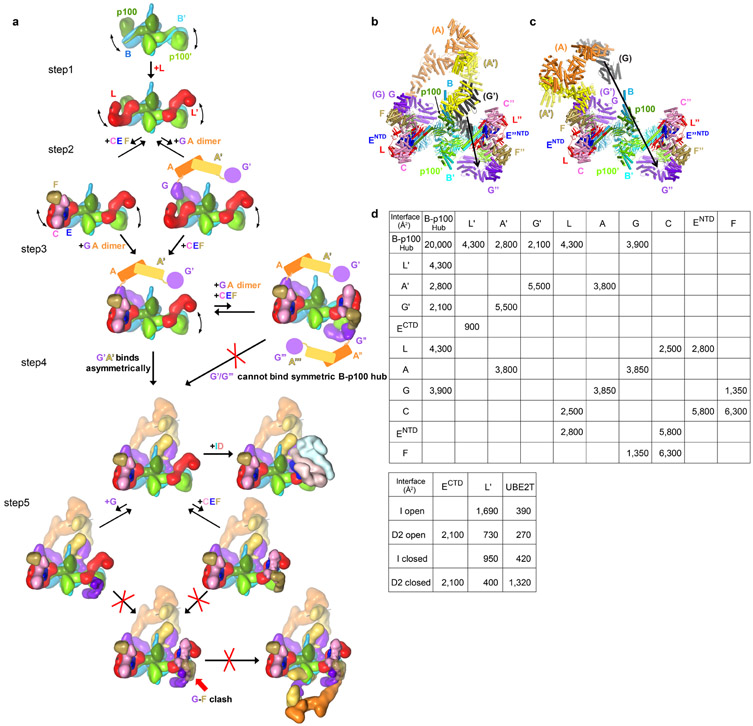
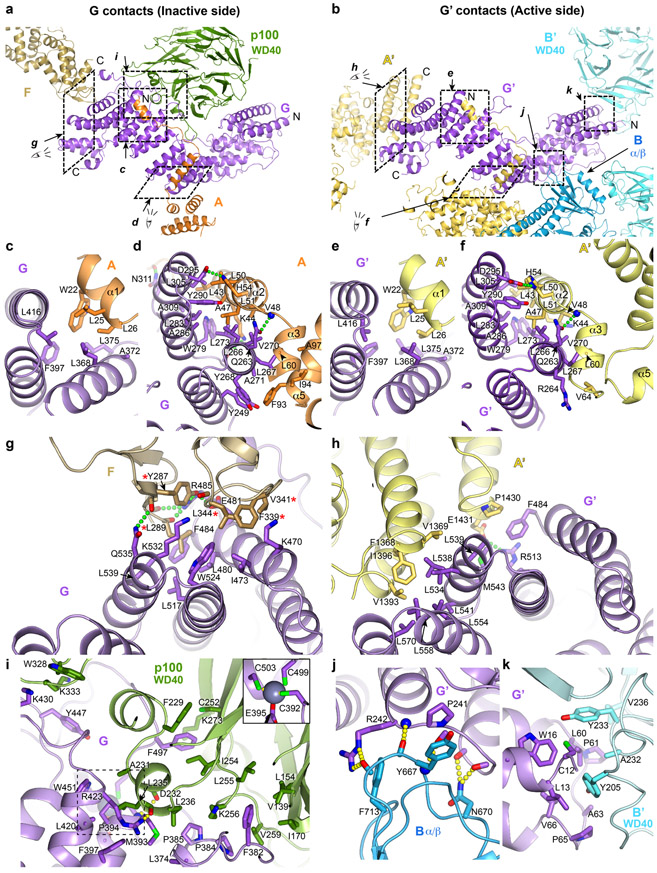
The structure suggests that the next assembly step is the cooperative binding of the FANCC-FANCE-FANCF and FANCG-FANCA-FAAP20 subcomplexes to one side of the FANCB-FAAP100-FANCL hub (Extended Data Fig. 5a, step 2). Cooperativity is indicated by the fact that the contacts FANCC and FANCE make to all four domains of FANCL should be equally possible at the active side FANCL’, which nonetheless is devoid of FANCC-FANCE-FANCF (Extended Data Fig. 4b-c, h). Similarly, the packing of the inactive side FANCG with the FAAP100 WD40 domain should also be possible at the active side, but the FAAP100’ WD40 lacks a bound FANCG’ (Extended Data Fig. 6a, i, see Supplementary Note 4 for an additional description of inter-subunit interactions of FANCG). What likely stabilizes the otherwise transient association of each subcomplex with the hub is avidity, provided by an interaction between FANCG and FANCF. This involves two highly conserved FANCF loops where mutations have been shown to compromise Core complex stability and FANCD2 ubiquitination (Extended Data Fig. 6a, g)31.
Once the first FANCG is anchored on FANCB-FAAP100-FANCL, its associated FANCA-FANCA’ dimer brings in FANCG’ at a high local concentration (Extended Data Fig. 5a, step 3). However, FANCG’ cannot be engaged by the emerging Core in a 2-fold symmetric manner because its binding site would be at least 100 Å away, owing to the incompatible symmetry axes of FANCB-FAAP100 and the FANCA homodimer (Extended Data Fig. 5b, c). Rather, FANCG’ binds to an entirely different site consisting of the FANCB’ WD40 and the FANCB α/β domains (Extended Data Fig. 6b, j-k). Avidity again plays a role, through additional contacts between FANCA’ and the FANCB-FAAP100 HB domains (Extended Data Fig. 3m), and also between the C-termini of FANCA’ and FANCG’ (Extended Data Fig. 6b, h), neither of which is possible at the inactive side.
Crucially, the switch from FANCG packing with FAAP100 WD40 at the inactive side to FANCG’ packing with FANCB’ WD40 is associated with, and likely causes, the different FANCB’-FAAP100’ WD40 domain positions. As a result, the active side of the complex cannot accommodate the bridge contacts between FANCG and FANCF, and consequently, a second FANCC-FANCE-FANCF cannot stably bind to and sequester FANCL’ (Extended Data Fig. 4h, 5a).
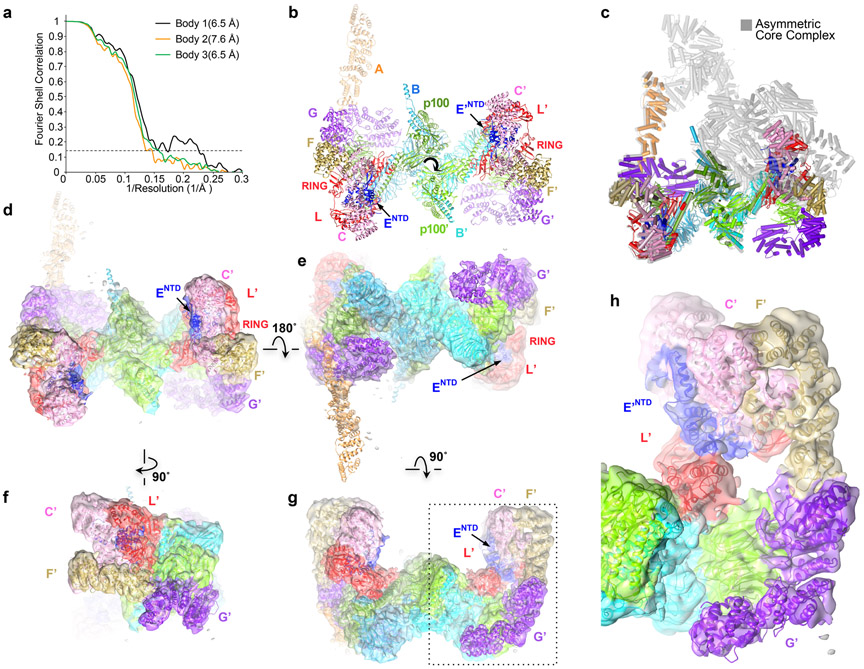
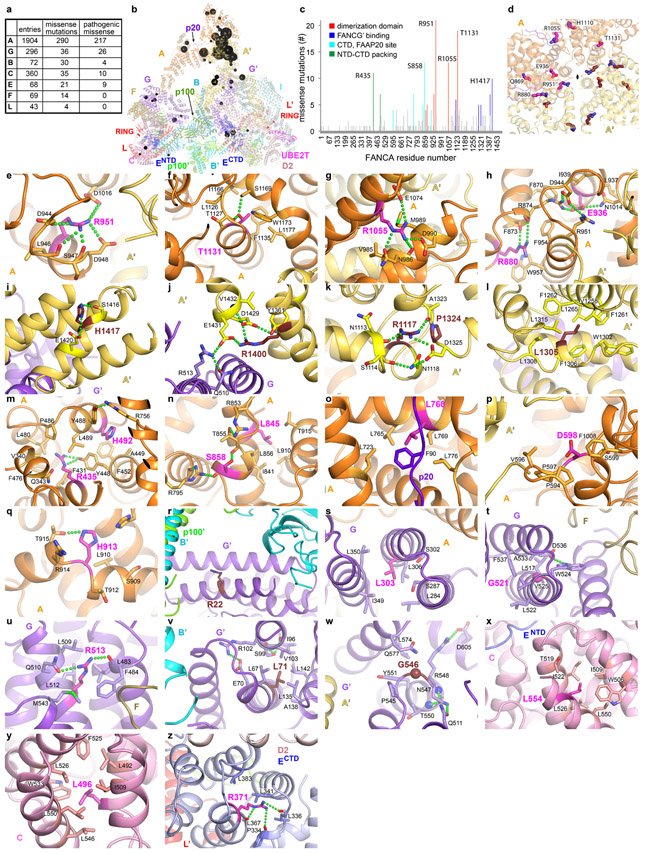
This assembly sequence is supported by the presence of 7,331 particles (~1 % of dataset) whose 3D reconstruction is fully symmetric, with clear density for two copies of FANCC-FANCE-FANCF inhibiting both FANCL protomers, and with the majority of FANCA disordered (Extended Data Fig. 7). This underscores the crucial role FANCA dimerization has in setting Core complex asymmetry and leaving one FANCL un-inhibited. Accordingly, the FANCA dimerization interface contains the Core residue with the largest number of missense mutations. This residue, Arg951, has a role stabilizing structural elements at the dimerization interface (Extended Data Fig. 8e). Consistent with this structural role, the R951W mutant is functionally null for mitomycin C (MMC) cell survival and FANCD2 ubiquitination, and it is bound by the HSP70 heat shock protein in the cytoplasm32. Among other FANCA mutations, R1055W/L, E936G, and L845P have also been shown to be defective in complementing the MMC sensitivity of FA cells32,33 (Extended Data Fig. 8g, h, n). Other common missense mutations map to structural elements of FANCA’ and FANCG’ at their C-terminal interface, of FANCG at its binding sites for FANCF or FANCB-FAAP100, of FANCC at its FANCENTD interface, and of FANCECTD at the FANCD2-binding site. A detailed summary of FA missense mutations within the Core complex is provided in Extended Data Fig. 8 with further discussion in Supplementary Note 5.
Structures of Core-UBE2T bound to ID-DNA in open and intermediate ID conformations
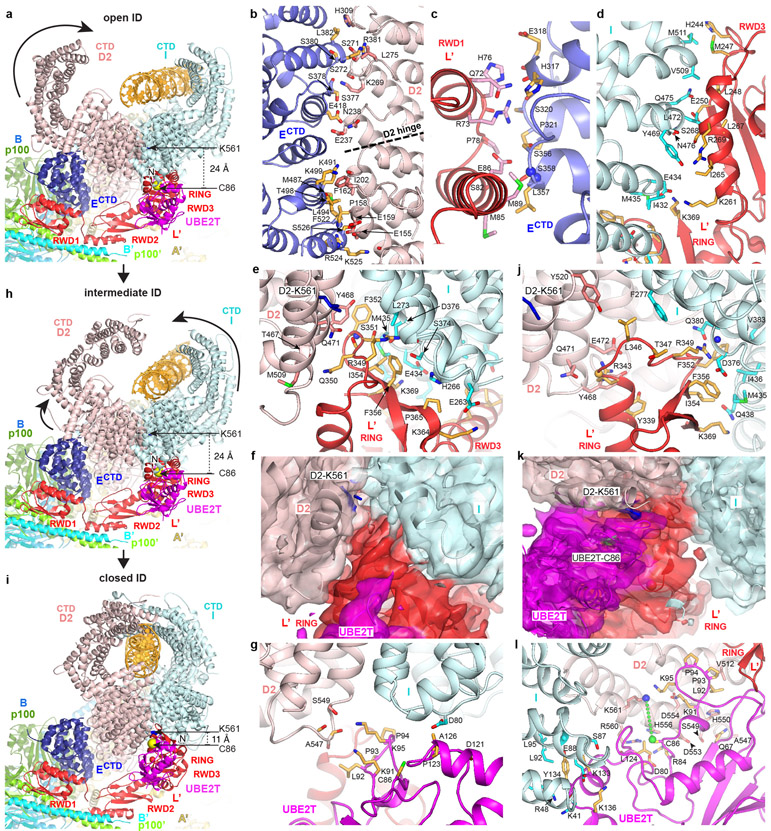
The Core binds to ID through the cooperation of FANCECTD and FANCL’. FANCECTD binds to the N-terminal portion of the FANCD2 NTD solenoid, at the exterior bottom of the trough-like ID structure (Fig. 3a, b). It uses most of its seven helical repeats to contact six FANCD2 helical repeats, burying 2,100 Å2 (Fig. 3b). This is likely the initial recruitment event. The resulting ID-FANCECTD assembly, flexibly tethered to the Core through the long FANCENTD-FANCECTD linker, then docks at FANCL’ through the FANCL’ RWD1 domain contacting FANCECTD (900 Å2; Fig. 3c), RWD3 contacting the FANCI NTD (~1,200 Å2; Fig. 3d), and RING contacting the FANCI-FANCD2 interface (~1,400 Å2; Fig. 3e). The FANCL’-FANCECTD interactions, absent in apo-Core, likely require the avidity provided by FANCL’-ID interactions.
Figure 3 ∣. Core-UBE2T binding to ID in three conformations.
a, View focusing on FANCECTD-FANCL’-UBE2T partway encircling the ID complex in the open-conformation, looking down the end of the trough-like shape that has the FANCI N-terminus (labeled). Curved arrow indicates the FANCD2 CTD rotation in the transition to the intermediate conformation of h. Colored as in Figure 1c. Lys561 (blue sticks) and UBE2T Cys86 (yellow sphere) are labeled. b, FANCD2-FANCECTD interface showing side chain and backbone groups within interaction distance (3.8 Å). Dashed line indicates the hinge where the FANCD2 N-terminal segment rotates away from FANCI. c-e, Open-conformation interfaces between FANCL’ RWD1 and FANCECTD (c), FANCL’ RWD3 and FANCI (d), and FANCL’ RING and the ID complex (e). f, Open-conformation cryo-EM density (semi-transparent surface) at 4.2 Å of the RING-ID interface in an orientation similar to e and colored according to the underlying protein. Portions of ID and most of the UBE2T (magenta) are clipped for clarity. g, Open-conformation UBE2T-ID interface. h, View of the intermediate ID conformation in the same Core orientation as in a. Curved arrows indicate the overall rotations in FANCI and FANCD2 (excluding residues 1-160) in the transition to the closed conformation of i. i, View of the closed ID conformation in the same Core orientation as in a. j, Closed-conformation FANCL’ RING-ID interface. k, Closed-conformation cryo-EM density (semi-transparent surface) at 4.2 Å of the interface between ID and UBE2T-FANCL’ RING, colored according to the underlying protein. Portions of ID uninvolved in contacts are clipped for clarity. l, Closed-conformation UBE2T-ID interface.
The FANCL’ RING domain plays a key role, with a hydrophobic hairpin inserting deep into the FANCI-FANCD2 interface near the FANCD2 Lys561 ubiquitination site (Fig. 3f). The hairpin Phe352, Ile354 and Phe356 side chains pack with hydrophobic FANCI and FANCD2 residues, and Arg349 and Ser351 are within hydrogen-bonding distance of side chain and backbone groups (Fig. 3e, f, Extended Data Fig. 9a-c). These are buttressed by contacts from the RING β sheet to FANCI.
UBE2T, which binds to the FANCL’ RING domain as in the isolated RING-UBE2T crystal structure11, forms a minor interface between the ID complex and two UBE2T patches flanking the active site Cys86, located ~24 Å away from FANCD2 Lys561 (Fig. 3a). Here, the UBE2T α2 helix packs against FANCI (390 Å2), while a proline-rich loop, an insertion to the E2 fold (residues 92 to 95), packs against FANCD2 (270 Å2; Fig. 3g).
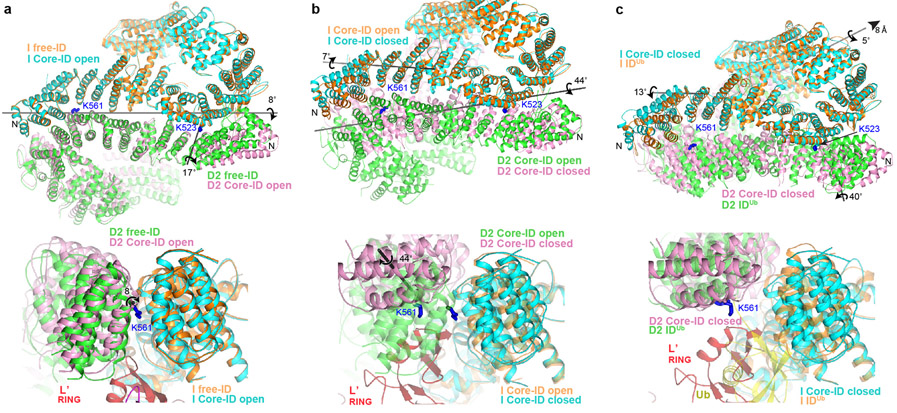
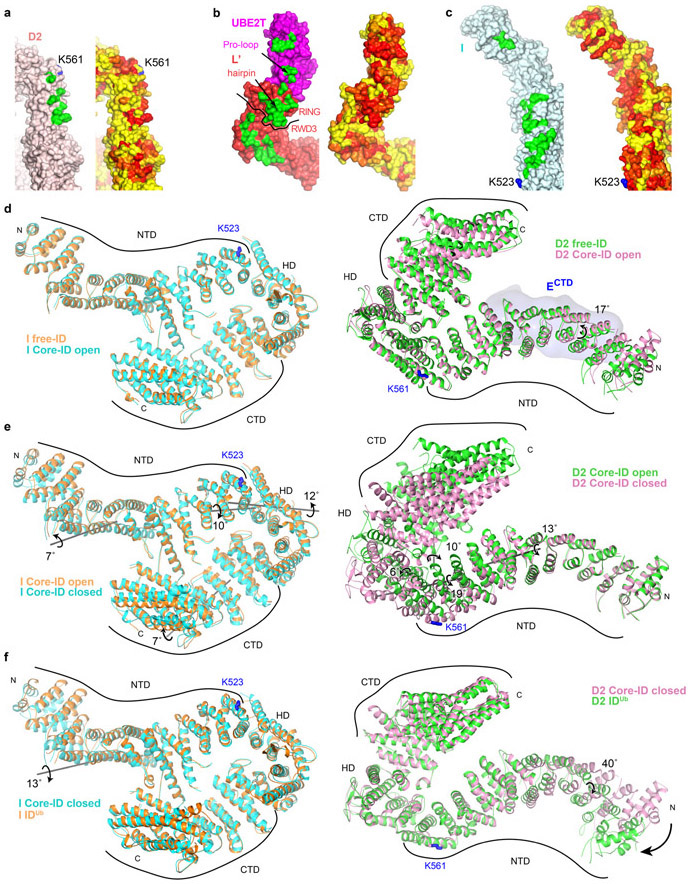
On binding to the Core complex, the I-D interface is partially pried apart by the FANCL’ RING hairpin insertion, which cannot be accommodated in the free ID conformation (Fig. 4a). This results in a relative rotation of FANCI and FANCD2 by 8° about an axis running along their NTD-NTD interface. The rotation is along essentially the same axis but much smaller than the 59° rotation in the free ID to IDUb transformation, where the larger separation of the NTD domains is needed to accommodate the ubiquitin moieties28.
Figure 4 ∣. Core-UBE2T remodels the ID complex prior to ubiquitination.
a, Superposition of the Core-bound open-conformation ID and free ID aligned on their FANCI NTD domains, colored as marked. Top, overall view looking down the exterior bottom of the trough-like ID. The horizontal gray line indicates the axis of rotation about which the ID NTD-NTD interface is pried apart on initial Core binding, while the shorter near-vertical line marks the rotation axis of the FANCD2 N-terminal segment. The ubiquitination site lysine side chains (labeled) are shown as blue sticks. Bottom, close-up of superposition viewed down the horizontal rotation axis, marked with circular arrow, also showing the FANCL’ RING hairpin that cannot fit into the free FANCI-FANCD2 interface. Free ID is rendered semi-transparent. b, Superposition of the open and closed conformation Core-bound ID complexes aligned on the middle-portion of the FANCI NTD. Top, overall view as in a, showing the rotation axes of the NTD-NTD interface (long gray line) and the FANCI N-terminal segment (short gray line) in the open-to-closed transition. Bottom, superposition viewed approximately along the NTD rotation axis, marked with circular arrow, also showing the FANCL’ RING. Open conformation ID is rendered semi-transparent. c, Top, superposition of the Core-bound closed-conformation ID and IDUb aligned on the mid-portions of their FANCI NTD domains. Also shown is the rotation/translation axis to bring the NTDs into register (top right line), and the rotation axes of the FANCI and FANCD2 N-terminal segments for the closed-conformation to IDUb transition (Extended Data Fig. 9d-f). Bottom, superposition viewed along the horizontal direction above, also showing the FANCL’ RING which would clash with the ubiquitin (yellow) attached to FANCD2 of IDUb, which is rendered semi-transparent.
Core-complex binding also results in the rotation of the N-terminal ~160 residue FANCD2 segment by 17°, away from its interface with FANCI, with a substantial loss of FANCI-FANCD2 contacts (loss of 900 Å2; Fig. 4a, Extended Data Fig. 9d, see Supplementary Note 6 for additional discussion of FANCI and FANCD2 conformational changes in this context). This is likely a direct consequence of binding to FANCECTD, whose contacts span the FANCD2 rotation hinge (Fig. 3b). As the FANCECTD structure is unchanged from the isolated crystal structure30, it acts as a rigid scaffold to remodel this FANCD2 segment. Together with the prying apart of the rest of the NTD-NTD interface, these conformational changes reduce the total buried area at the FANCI-FANCD2 interface by ~28% (to 3,550 Å2).
In the open-ID conformation map, the DNA is modeled as a straight, 25 base-pair duplex. As with free ID28, the DNA binds primarily to the FANCI-side and FANCI-FANCD2 base of the trough-shaped binding site. The transition to the intermediate-ID conformation involves the DNA duplex tilting towards FANCI, coupled to a rotation of the FANCD2 CTD about the helical domain (HD) that demarcates the NTD and CTD (Fig. 3a, h). The FANCD2 CTD density becomes progressively weaker towards its C-terminus, suggesting a range of conformations. In the average conformation (38° rotation), the FANCD2 CTD has moved halfway towards forming the ring-closing interface with the FANCI CTD. The open and intermediate ID conformations have essentially the same NTD-NTD interface and Core-UBE2T contacts.
Structure of ID-DNA-Core-UBE2T in the closed-ID conformation
In the closed-ID conformation, the FANCD2 N-terminal segment remains unchanged anchored on FANCECTD, while the rest of the ID complex is remodeled to an overall conformation closely resembling IDUb (Fig. 3i). The ID NTD-NTD interface is now essentially fully separated as in IDUb, through an additional ~44° rotation relative to the open conformation (Fig. 4b; Extended Data Fig. 9e, Supplementary Note 6). This juxtaposes their CTD domains, which pack through their helical repeats and also form an intermolecular β sheet zipper through previously unstructured C-terminal extensions, recapitulating the ring-closing CTD-CTD interface of IDUb28.
Except for the constant FANCD2-FANCECTD interface, the remodeled ID makes an entirely new set of contacts to Core-UBE2T (Fig. 3j-l). Central to this is UBE2T, which has moved inside the separated NTD-NTD interface, forming a much larger interface with the ID complex (1,740 Å compared to 660 Å). Crucially, the UBE2T Cys86 is now within contact distance of the FANCD2 Lys561 ubiquitination site (11 Å Cα-Cα distance). UBE2T uses its proline-rich loop and part of its β sheet to contact two FANCD2 helical repeats (residues 512 to 561; 76 % of UBE2T-ID surface area buried; Figs 3k to l). FANCI contacts involve the UBE2T α2 helix as in the open-conformation state, but distinct residues on the second and third helical repeats of FANCI. The remodeling also changes FANCL’-ID association, eliminating the RWD1-FANCI interface, and repurposing the RING hairpin and β sheet elements to contact primarily FANCI (Fig. 3j).
In addition to the remodeling of the FANCI-FANCD2 interface, the conformations of the individual FANCI and FANCD2 proteins adjust in response to the deeper insertion of FANCL’ RING and UBE2T in between their NTDs, and the formation of the ring-closing CTD-CTD interface while their NTDs are held widely separated (Fig. 4b, Extended Data 9e, Supplementary Note 6). A FANCI N-terminal segment of 225 residues tilts away from FANCD2 through a 7° rotation, likely coupled to the aforementioned changes in FANCI-UBE2T association. Thereafter, the end of the FANCI NTD twists by 10° where the FANCL RING inserts, and this is followed by a 7° relative rotation at its HD-CTD interface that moves the CTD towards the FANCD2 CTD. The conformational changes within FANCD2 are more extensive (Fig. 4b, Extended Data 9e, Supplementary Note 6). They start immediately after the FANCECTD binding site, with the NTD twisting somewhat continuously across the next 300 residues, where it binds to FANCL’-UBE2T. This twist moves the NTD closer to FANCL’-UBE2T. This change is followed by a 6° rotation around the NTD-HD interface, and a 10° rotation around the HD-CTD interface. Together, these rotations move the FANCD2 CTD in the direction of the FANCI CTD, likely coupled to the formation of the ring-closing CTD-CTD interface.
The closed state recapitulates DNA binding by IDUb, including the FANCD2 CTD-DNA interactions, which likely help stabilize the closed conformation. The overall closed-ID conformation is not yet identical to IDUb, however, requiring a 5° rotation and 8 Å translation around their CTDs to bring the FANCI and FANCD2 NTDs into their IDUb register (Fig. 4c). The individual FANCI and FANCD2 conformations are also very similar to those of IDUb, except for their N-terminal segments that interact with FANCL’-UBE2T and FANCECTD, respectively (Extended Data 9f). These differences likely reflect the absence of conjugated ubiquitin molecules that form the reciprocal ubiquitin-NTD interfaces of IDUb, as well as the contacts the Core complex makes to the individual proteins.
While the closed-ID conformation particles lack any detectable ubiquitin on FANCD2 or FANCI, about 20 % of them contain clear additional density on UBE2T that is consistent with ubiquitin (Extended Data Fig. 2b). The 7.1 Å focused reconstruction shows that the overall position of this extra density on UBE2T is analogous to that of ubiquitin in other E2-Ub conjugates34 (Extended Data Fig. 2c-e). The ubiquitin density resides on the side of UBE2T opposite from FANCD2, with the ubiquitin C-terminus closer to the UBE2T active site cysteine than to the FANCD2 ubiquitination site, suggesting that this intermediate represents the UBE2T-ubiquitin conjugate poised to monoubiquitinate FANCD2. However, because the density lacks the detail to unambiguously assign the orientation of ubiquitin, we cannot ascertain whether this represents a catalytically active state akin to the primed ubiquitin conformation of other RING E3-E2 complexes35-37, or if additional intermediates exist.
Insights into ID monoubiquitination
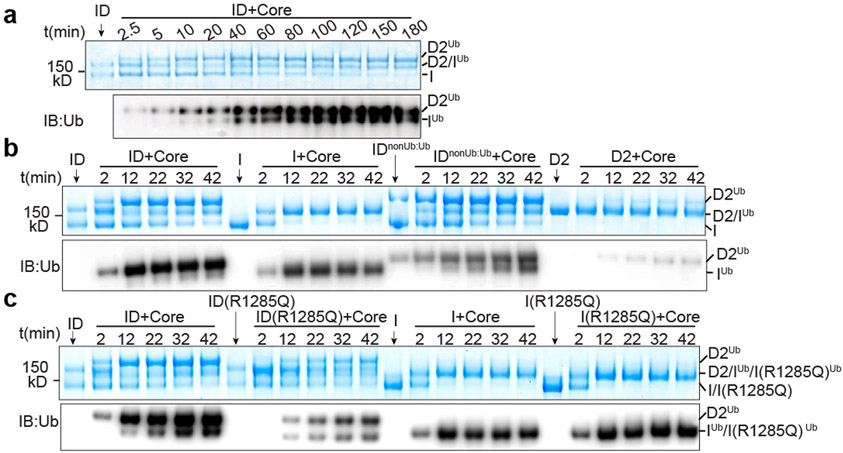
The structures indicate that a single FANCL-UBE2T monoubiquitinates FANCD2 and FANCI sequentially. Accordingly, FANCI ubiquitination is detectable only after ubiquitinated FANCD2 has accumulated substantially (Fig. 5a). This is not due to FANCI monoubiquitination having an intrinsically slower catalytic rate, as free FANCI or FANCI assembled with monoubiquitinated FANCD2 (IDnonUb:Ub) are ubiquitinated with kinetics similar to FANCD2 within the ID complex (Fig. 5b). Free FANCD2 monoubiquitination is exceedingly slow, presumably because the FANCD2-FANCECTD assembly fails to dock on FANCL’ in the absence of FANCI.
Figure 5 ∣. FANCD2 and FANCI are ubiquitinated sequentially.
a, Ubiquitination time course of ID (1 μM) by recombinant Core complex (0.1 μM) and UBE2T (1.5 μM). The positions of substrates and products are marked. b, Reaction time course comparing the ID complex, a complex assembled with ubiquitinated FANCD2 and non-ubiquitinated FANCI (IDnonUb:Ub), and the individual proteins (all at 1 μM). c, Reaction time course comparing the ID complex, a complex assembled with FANCI harboring the R1285Q FA mutation, individual FANCI, and the individual FANCI R1285Q mutant (all at 1 mM). a-c, The loading controls for substrates of the reactions are marked by arrows. Reactions were run on the same SDS-PAGE gel for direct comparison. They were visualized by Coomassie staining (top panels) or immunoblotting with a ubiquitin-specific antibody (bottom panels). The experiments were independently repeated three times with similar results. Uncropped blot and gel images are shown in the Supplementary Fig. 3.
The intermediate ID conformation suggests that the association of the FANCI and FANCD2 CTD domains triggers the separation of the NTD-NTD interface that is a pre-requisite for ubiquitination. As the CTD domains are still too far for association, we presume the unstructured C-terminal extensions that would form the zipper play a key role in bridging the gap. This model is supported by an FA mutation, R1285Q on the zipper23,38, that reduces levels of ubiquitinated FANCD2 in cells38, and is predicted to destabilize the zipper28. In vitro, the mutation substantially reduces ID ubiquitination at both FANCD2 and FANCI, but it has no effect on isolated FANCI ubiquitination (Fig. 5c).
After FANCD2 monoubiquitination, the binding of its ubiquitin to the FANCI NTD28 would cause a steric clash with the FANCL RING domain (Fig. 4c), suggesting a mechanism for the release of the reaction product. The FANCD2 ubiquitin would also act as a wedge that prevents the NTD-NTD interface from closing, thus keeping the FANCI Lys523 accessible for subsequent ubiquitination. This stepwise ID remodeling and ubiquitination process may well be modified and regulated by additional proteins present in the context of a stalled replication fork2-4.
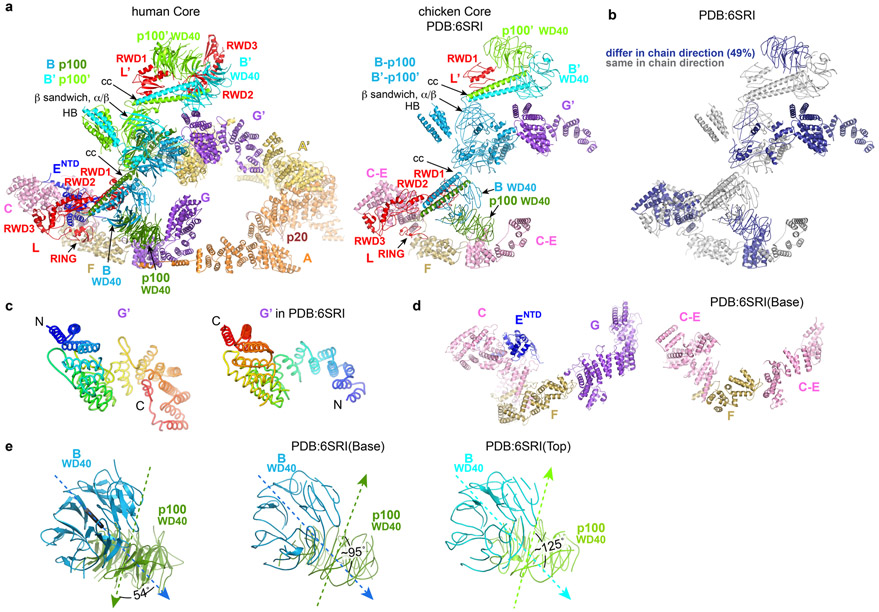
A 4.2 Å cryo-EM analysis of the chicken Core complex22 reported a different subunit composition with a single copy of FANCA-FANCG. FANCA was deemed conformationally flexible, and it was not included in the deposited coordinates (Extended Data Fig. 10a). The single FANCG in that structure corresponds to the active-side FANCG’ of the human complex, but the polypeptide chain is in the opposite direction (Extended Data Fig. 10b-c). The cryo-EM map of the chicken complex has density that could correspond to the inactive-side FANCG of the human complex, but it was interpreted as the substrate-recognition module FANCC-FANCE (Extended Data Fig. 10d). In contrast to our findings, Shakeel et al proposed22 that the chicken Core uses the RING domains of both FANCL subunits to ubiquitinate FANCI and FANCD2. Because the chicken Core preparation failed to ubiquitinate FANCI in vitro, it was suggested that this may require an additional activation step (Extended Data Fig. 10e, see Supplementary Note 7 for additional discussion of the differences between the human and chicken Core complexes).
Discussion
The structure of the apo-Core complex shows that it consists of two copies of all but the FANCC, FANCE and FANCF subunits. This stoichiometry is critical for its ubiquitin ligase function because while the FANCC-FANCE-FANCF subcomplex is essential for the recruitment of the ID substrate through FANCECTD-FANCD2 interactions, it also has a hitherto unknown inhibitory activity. This results from FANCC-FANCE-FANCF not only sequestering the RING domain of FANCL, thus blocking the recruitment of the UBE2T ubiquitin conjugating enzyme, but also sequestering the FANCL segments that would make additional contacts to the ID complex (Fig. 2). FANCA, the only other Core complex subunit that forms a dimer, plays a central role in establishing this unusual stoichiometry because the symmetry of Core-bound FANCA is incompatible with that of FANCB (Fig. 1a). The binding of FANCA thus leads to an asymmetric assembly where one side of the FANCB-FAAP100-FANCL hub functions in substrate recruitment, while the other side functions as a ubiquitin ligase with additional substrate contacts. The single active site then ubiquitinates FANCD2 and FANCI sequentially (Fig. 5).
The structures of the Core-UBE2T-ID-DNA complex, captured in three conformations during a monoubiquitination reaction, show that the Core complex extensively remodels the ID complex prior to ubiquitination. The remodeling is necessitated by the inaccessibility of the ID monoubiquitination sites, which are sequestered inside the FANCI-FANCD2 interface of the non-ubiquitinated ID complex27,28. An initial, open-ID conformation state resembles the open trough-like shape of the non-ubiquitinated ID but with a reduced FANCI-FANCD2 interface (Fig. 3a). The FANCI-FANCD2 interface is partially pried it apart, but the ID monoubiquitination sites are still inaccessible for ubiquitination. In the intermediate-ID conformation, the CTD domains of FANCI and FANCD2 have moved partway towards forming the clamp-closing interface. This is associated with the DNA tilting to a new position relative to FANCI, suggesting that it is a DNA-dependent conformational change. In the third conformation, the ID clamp is closed through a CTD-CTD interface essentially identical to that of IDUb 28,29. This is associated with a new set of contacts between the ID complex and Core-UBE2T, and with additional conformational changes in FANCI and FANCD2. These changes serve to fully pry apart the FANCI-FANCD2 interface, exposing the ID monoubiquitination sites. The active site of UBE2T is now juxtaposed with the FANCD2 monoubiquitination site, consistent with in vitro data showing FANCD2 is ubiquitinated first (Fig. 5). Together, these findings indicate that the Core complex is a macromolecular remodeling machine that closes the ID clamp on the DNA prior to monoubiquitination, with subsequent ubiquitination serving to prevent clamp opening on Core release.
Methods
Protein Expression and purification.
The pcDNA™ 3.1(+) (Invitrogen V79020) vectors with different selectable markers (Geneticin, Hygromycine or Blasticidin) were modified for multi-gene expression by inserting homing endonuclease (HE) sites upstream of the promoter and downstream of the terminator. Full length human FANCA(NM_000135.4), FANCB(NM_001018113.3), FANCC(NM_000136.3), FANCE(NM_021922.3), FANCF(NM_022725.4), FANCG(NM_004629.2), FANCL(NM_018062.4) and FAAP100 (NM_025161.6) were individually inserted into the three modified pcDNA3.1 plasmids. All contain an N-terminal Flag tag except for FANCA that has a C-terminal Flag tag. Then, eight expression cassettes were combined into three vectors by homing endonuclease cloning. The three expression vectors containing FANCA-FANCG, FANCB-FANCL-FAAP100 and FANCC-FANCE-FANCF were verified by sequencing before transfection into HEK 293F cells (Invitrogen R79007, not authenticated, not tested for mycoplasma contamination). Monoclonal cell lines were identified and expanded after 30 days’ selection. Select cell lines were then evaluated by Core complex purification using Flag-affinity, gel-filtration profile of the purified complex and quantification of subunit stoichiometry by PAGE. A cell line with stable and high expression of all eight subunits was then adapted for suspension culture. Cells were lysed in 50 mM Tris-HCl, 150 mM NaCl, 10% (v/v) glycerol, 1 mM DTT, pH 8.0 and EDTA-free protease inhibitor cocktail (Millipore Sigma S8830). After Flag-affinity, anion exchange and size-exclusion chromatography, the FA core complex was concentrated by ultrafiltration (Amicon) to approximately 10 mg/ml (9 μM) in 20 mM Bicine, 150 mM NaCl, 1mM DTT, pH 8.0, and it was stored in small aliquots at −80 °C. The affinity-purified Core complex contains endogenous FAAP20, shown to bind to FANCA16 (Extended Data Fig. 1a). Overexpression of FAAP20 by transient transfection of the stably-transfected cell line did not increase the amount of FAAP20 associated with the Core complex, and the map from a small Cryo-EM data set using this preparation was qualitatively the same (data not shown). We presume FAAP20 is not a limiting factor in our expression system.
Human FANCI and human FANCD2 were expressed and purified as described28. Briefly, His6 tagged FANCI and FANCD2 were co-expressed in Hi5 insect cells (Invitrogen, not authenticated, not tested for mycoplasma contamination) using baculovirus. After affinity chromatography and tag cleavage, they were purified by ion exchange (MonoQ) chromatography, which dissociated the two proteins. For the ID complex, individual FANCI and FANCD2 proteins were combined at a 1:1 molar ratio, and the heterodimer complex was purified by gel filtration. Isolated FANCI and FANCD2 do not homodimerize on gel filtration at concentrations up-to 60 μM. The complex and individual proteins were concentrated by ultrafiltration to ~20 mg/ml 20 mM Tris-HCl, 150 mM NaCl, 0.5 mM TCEP, pH 8.0. The R1285Q mutant of human FANCI was generated using QuickChange Lightning Site-Directed Mutagenesis Kit (Agilent), and was cloned with an N-terminal cleavable Flag tag into the pcDNA 3.1 vector. FANCI(R1285Q) was transiently transfected into HEK293 cells cultured in suspension for 2 days. Cells were lysed in 50 mM Tris-HCl, 300 mM NaCl, 10% (v/v) glycerol, 1 mM DTT, pH 8.0 and protease inhibitor cocktail (Millipore Sigma S8830). After Flag pull-down and Flag tag cleavage, FANCI(R1285Q) was mixed with purified FANCD2 at one molar ratio, followed by concentration and exchange into buffer containing 150 mM NaCl. The complex was further purified by gel-filtration chromatography and concentrated by ultrafiltration (Amicon) to 11 μM in 20 mM Tris-HCl, 150 mM NaCl, 10% (v/v) glycerol, 1 mM DTT, pH 8.0 and stored in small aliquots in −80 °C.
Human UBE2T gene was cloned into a pGEX 6p-1 vector with N terminal GST tag followed by a HRV 3c site, and it was overexpressed in E. coli BL21 (DE3) cells11. It was purified using GST affinity chromatography followed by GST tag cleavage, cation exchange (Hitrap SP column) and size-exclusion chromatography, and was concentrated to 600 μM. The UBE2T C86K mutant used in the Core-UBE2T-ID data set was generated using QuickChange Lightning Site-Directed Mutagenesis Kit (Agilent), and it was purified as the wild type protein. UBE2T(C86K) was conjugated to ubiquitin through an isopeptide bond in a 200 μL reaction containing 125 μM His-Ubiquitin (Boston Biochem U-530), 125 μM UBE2T(C86K), 0.85 μM UBE1 (Boston Biochem E-304-050), 5 mM adenosine triphosphate, 5 mM MgCl2 in 50 mM CAPS, 150 mM NaCl, 0.2 mM TCEP, pH 10.0. After incubation at 25 °C for 4 hours, the reaction was diluted to 1 ml in 50 mM Bicine, 150 mM NaCl, pH 8.0. The ubiquitin-conjugated UBE2T(C86K) was separated from the non-ubiquitinated UBE2T(C86K) by Ni-NTA chromatography, eluted by 20 mM Bicine, 150 mM NaCl, 200 mM imidazole, pH 8.0, then separated from UBE1 and ubiquitin by gel filtration.
In vitro ubiquitination.
Unless stated otherwise, monoubiquitination reactions28 contained 0.1 μM recombinant human Core complex, 1 μM substrate (ID, IDnonUb:Ub, ID(R1285Q), FANCI, FANCI(R1285Q) or FANCD2 as indicated), 26 μM Ubiquitin (Boston Biochem U-530), 0.3 μM UBE1 (Boston Biochem E-304-050), 1.5 μM UBE2T (Boston Biochem E2-695), 2 μM dsDNA (58 bp), 5 mM adenosine triphosphate, 5 mM MgCl2 in 20 mM Tris-HCl, 100 mM NaCl, pH 8.0. 40 μL reactions were setup on ice and then incubated at 28 °C. At the indicated time points, a 3 μL aliquot was mixed with 9 μL NuPAGE LDS sample buffer (Invitrogen) and heated at 95 °C for 2 min to stop the reaction. Samples were separated by NuPAGE 3-8% Tris-Acetate SDS-PAGE (Invitrogen) in duplicate sets, and detected either with Coomassie blue staining (6.5 μL loading) or western-blotting (4.5 μL loading). Replacing the 58 bp dsDNA with 58 bp nicked dsDNA had no detectable effect on ubiquitination (not shown).
The IDnonUb:Ub substrate was prepared by first separating monoubiquitinated FANCD2Ub from FANCIUb by anion exchange chromatography (MonoQ) of the IDUb complex, and concentrating it to 42 μM in 20 mM Tris, 350 mM NaCl, 10% glycerol, pH 8.0. FANCD2Ub (3 μM final concentration) was then mixed with 6 μM dsDNA (58 bp), incubated for 10 min on ice before addition of a one molar equivalent of FANCI. This order of addition was used to facilitate DNA binding, as the IDnonUb:Ub-DNA complex forms a closed ring28,29. After 30 min incubation on ice, the IDnonUb:Ub complex was monoubiquitinated as above at 1 μM concentration.
DNA substrates.
The oligonucleotides listed in Supplementary Table 1 were ordered from Integrated DNA Technologies, Inc. (IDT). 58bp dsDNA and 58bp nicked dsDNA were prepared by annealing Oligo1-Oligo2 and Oligo2-Oligo3-Oligo4 in 10 mM HEPES, pH 7.4, 50 mM NaCl buffer28. The products were purified by 10% native TBE PAGE and electroelution (Whatman Elutrap).
Cryo-EM samples.
Apo-Core Cryo-EM data was collected at a complex concentration of 1 to 1.3 μM. The Core-ID data was collected from samples that contained 0.8 to 1.2 μM Core, 1.5 to 3 μM ID complex and 3 μM of 58 base pair nicked DNA. Although DNA was shown to promote ID ubiquitination15,23,25,26, there was no DNA density on the ID complex. The Core-UBE2T-ID samples contained 6 μM UBE2T(C86K) mutant that was conjugated to ubiquitin by an isopeptide bond, an approach successfully utilized for the UbcH5A E235. The maps showed no ubiquitin density and we presume it is disordered, possibly because this mutant does not recapitulate all conformational aspects of UBE2T. Approximately one third of Core complex particles in the Core-ID and Core-UBE2T-ID data sets contained the ID complex. To promote DNA binding for the monoubiquitination reaction cryo-EM data, we reduced the NaCl concentration to 120 mM, and used a higher concentration of DNA. The reaction contained Core, UBE2T, ID and 58 base pair nicked DNA at 0.6, 5.3, 5 and 28 μM, respectively. Prior to vitrification, samples were incubated with ubiquitin-activating E1 enzyme (0.3 μM), ubiquitin (26 μM) and Mg-ATP (5 μM) for 3 minutes to yield approximately 20 % of monoubiquitinated FANCD2 by SDS-PAGE.
Cryo-EM image processing.
For all data sets, movie frames were aligned using MOTIONCOR239, and the contrast transfer function parameters were estimated with CTFFIND440. Initial 2D templates for autopicking were derived from manual picking of Core particles followed by 2D classification. For the Core complex, a total of 9760 aligned micrographs were used for autopicking using template matching in RELION341, followed by reference free 2D classification. An initial 3D model was generated from 2D averages in EMAN2, followed by RELION3 auto-refinement. 3D classification in RELION3 was then used to remove particles in classes of poorly defined features or limited resolution that failed to significantly extend beyond the resolution at which the autopicking templates were low-pass filtered. Depending on the data set, approximately half to two thirds of the autopicked particles were ultimately rejected. After applying Bayesian beam induced motion correction, scale and B-factors for radiation-damage weighting and per particle CTF refinement, an additional round of 2D classification was used to remove extant noise particles. The resulting data set of 671,927 particles was then used for a consensus reconstruction which resulted in a resolution of 3.4 Å (Extended Data Fig. 2a) were also applied before the consensus refinement which resulted a resolution of 3.4 Å. All reported map resolutions are from gold-standard refinement procedures with the FSC=0.143 criterion after post-processing by applying a soft mask.
At this stage, successive 3D classifications showed at least two kinds of conformational heterogeneity in the Core particle. One (46% particles) involved the inactive and active sides of the Core moving, mostly orthogonal to the flat shape (up and down in Figure 1a), relative to the central hub, and this was coupled to the movement of the two FANCA arms. The other (27% particles) involved the active-side interface between FANCA’ CTD and FANCG’ CTD (Extended Data Fig. 6h) dissociating, resulting in poor order and density for the FANCA’ CTD and for the MD and CTD domains of the inactive side FANCA. The particles contained an intact interface between the FANCA’ CTD and FANCG- CTD domains (FANCA conformation 1 in Extended Data Fig. 1b), and these were used for the focused refinement of FANCA. The remaining particles appeared to have a continuum of conformational states for portion containing the FANCA’ CTD, FANCA MD and FANCA CTD domains, and even after successive 3D classifications to identify a narrower range of conformational states (FANCA conformation 2 in Extended Data Fig. 2a), they could not be modeled reliably. The focused 3D refinements of the Core utilized seven non-overlapping soft-masks, except for the three FANCA-FANCA’ masks that overlapped partially (Core portions encompassed in masks and resulting FSC curves are shown in Extended Data Fig. 2a and b; the soft-masks are described in Supplementary Note 1). The 7,331 particles that correspond to a symmetric conformation of the Core (Extended Data Fig. 7) were identified using iterations of 3D classification, successively removing recognizable asymmetric Core particles. Their reconstruction was done using the RELION3 multi-body option with signal subtraction in point group C1, with three bodies corresponding to the left, middle and right side of Extended Data Fig. 7b.
The Core-ID and Core-UBE2T-ID data sets were processed similarly to the Core data, respectively yielding 289,005 and 295,721 clean particles from 4,309 and 10,932 micrographs after Bayesian polishing and CTF refinement. Because 2D and 3D classifications indicated that only a subset of particles contained bound ID, we performed partial signal subtraction of the consensus map outside the ID-FANCECTD-FANCL’ or ID-FANCECTD-FANCL’-UBE2T density from each particle, followed by 3D classification without alignment to identify the ID-containing particles. We then performed focused 3D refinements on the original particles as with the Core data set, except for fewer masks (Extended Data Fig. 1c, d).
The Core-UBE2T-ID-DNA data set was processed similarly to the Core-UBE2T-ID data. The 28,991 micrographs yielded 531,808 clean particles, of which 332,563 contained bound ID, after Bayesian polishing and CTF refinement. Masked 3D classification without alignment was performed with a mask that consisted of UBE2T-ID-FANCECTD-FANCL’. Particles of the three classes containing DNA density were subjected to further consensus and focused 3D refinements. For the subset that contained ID in a closed conformation, we identified ~20 % of the particles that contained ubiquitin on UBE2T by first performing partial signal subtraction with a mask containing FANCI (residues 1-300), FANCL’ (RWD3-RING domains), and UBE2T with a ubiquitin modeled on it based on the PDB entry 4AP4, followed by 3D classification without alignment. Focused 3D refinements were then performed on the original subset of particles, with the final masked reconstruction extending to 7.1 Å (Extended Data Fig. 2a). The same method failed to identify any particles that contained ubiquitin on either FANCD2 or FANCI.
Model building and refinement.
The Core structure was built into the maps with COOT42 and O43. We also utilized the available crystal structures of a FANCF C-terminal domain (residues 156-357, PDB:2IQC), of fly FANCL (PDB:3K1L) and human FANCL RWD2-RWD3 domains (also known as DRWD for Double RWD; PDB:3ZQS). Initial structure refinement was done with REFMAC544 modified for cryo-EM. For this, we first aligned the individual focused maps on the consensus reconstruction map in CCP445, and then combined them with the composite sfcalc option of REFMAC5 to construct a single set of structure factors to 3.1 Å (Extended Data Fig. 2b, right). As the resolution of the FANCA-focused maps is lower (3.4, except for the FANCANTD which is to 3.7 Å), this results in higher temperature factors for the portions of the structure within these maps. Initial refinement with REFMAC5 in reciprocal space utilized NCS restraints for portions of subunits deemed to have the same conformation, and also secondary structure restraints generated by PROSMART44. Real space refinement was performed with the phenix.real_space_refine program of the PHENIX suite46. In the final stages the model was refined with REFMAC5, followed by TLS refinement. The disordered regions of Core subunits are indicated as dashed lines on Supplementary Fig. 2a to i.
The structures of the Core-ID, Core-UBE2T-ID and Core-UBE2T-ID-DNA complexes were built using the refined Core structure, also utilizing the available crystal structures of human FANCL RING-UBE2T complex (PDB: 4CCG) and of the FANCECTD (PDB: 2ILR), as well as the cryo-EM structure of the human ID complex (PDB: 6VAA and 6VAE). The Core subunits, the larger ones divided into individual domains, were fitted into the maps with CHIMERA, and the junctions between domains rebuilt as necessary. The models were refined in both reciprocal and real space as with the Core complex, except external structure restraints based on the Core, ID, FANCECTD and UBE2T structures were also used because of the lower resolution of these maps.
For the reconstruction of the closed-ID conformation Core-UBE2T-ID-DNA particles that contained ubiquitin on UBE2T, only rigid body fitting was performed due to the 7.1 Å resolution limit. Core, ID and DNA do not change noticeably, whereas UBE2T pivots away from ID through a 13° rotation about the UBE2T-RING interface. A ubiquitin structure (PDB 4BVU) was rigid-body fitted into the density to illustrate that the dimensions of the density match those of ubiquitin. However, the quality and level of detail of the density preclude unambiguously assigning an orientation to the ubiquitin model.
Reporting Summary.
Further information on experimental design is available in the Nature Research Reporting Summary linked to this article.
Extended Data
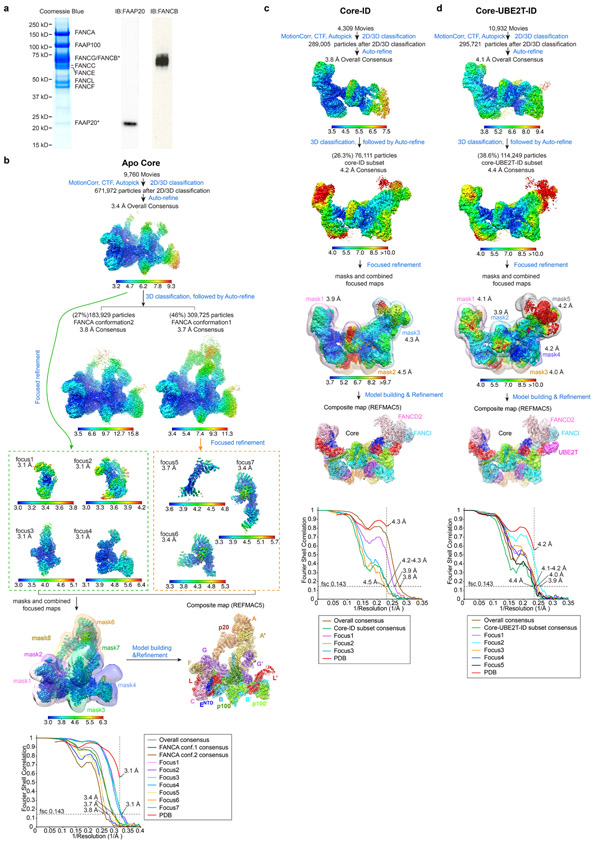
Extended Data Fig. 1. Cryo-EM reconstruction of the FA Core, Core-ID and Core-UBE2T-ID complexes.
a, Left, coomassie stained gel of the purified Core Complex containing recombinant subunits FANCA, FANCB, FANCC, FANCE, FANCF, FANCG, FANCL and FAAP100 and endogenous FAAP20 as labeled. Right, immunoblots confirming the identity of the FAAP20 and also showing the presence of FANCB, which overlaps with FANCG in the coomassie-stained gel.
b-d, Flowcharts of single particle cryo-EM data processing of the Core complex (b), Core-ID complex (c) and Core-UBE2T-ID complex (d). Consensus and focused reconstructions are colored by local resolution (RELION3) as indicated with the color keys (“>” marks a low resolution cutoff of ~10 Å). Orientation is similar to Figure 1a. In b, all seven focused reconstructions are shown individually in orientations that match the consensus map (inside two dashed rectangles). They are also shown in a combined style with their corresponding masks used for focused refinements shown as semi-transparent in different colors (below the green dashed rectangle). The composite map (below the orange dashed rectangle) is shown in semi-transparent rendering and colored by subunit. In c and d, all focused reconstructions are combined in a single figure, with their corresponding masks shown as semi-transparent surfaces in different colors. Overall resolutions for each focused map are also indicated. The composite maps are shown in semi-transparent rendering and colored by subunit. Graphs at the bottom show gold-standard FSC plots between two independently refined half-maps for the consensus and focused reconstructions with the FSC cutoff 0.143 marked by horizontal dashed lines. The FSC plot of the refined models (labeled PDB) versus the composite cryo-EM map is shown in red, with the FSC cutoff marked by vertical dashed lines. The compositions of the masks are described in Supplementary Note 1.
Extended Data Fig. 2. Cryo-EM reconstruction of the three conformations of the Core-UBE2T-ID-DNA complex from the ubiquitination reaction.
a, Flowchart of single particle cryo-EM data processing of the Core-UBE2T-ID-DNA complex in three different conformations. Consensus and focused maps are colored by local resolution and oriented as in Fig. 1b (slight rotations were applied for clarity). Focused reconstructions are shown in a combined view as labeled, with the corresponding masks shown in semi-transparent rendering in different colors. All reconstruction4/mask4 renderings are shown separately. The composite maps are also semi-transparent and are colored by subunit. The four graphs on the right show gold-standard FSC curves between two independently refined half-maps for the consensus and focused reconstructions, with the FSC cutoff 0.143 marked by horizontal dashed lines.
b, Left, density attributed to ubiquitin (yellow) extending from UBE2T in the 7.1 Å focused reconstruction (~20 % of the closed-ID Core-UBE2T-ID-DNA Ub+ particles), masked by mask4 of a. This density is absent in the low pass filtered reconstruction of the rest of the particles (right map, Ub−).
c, Cartoon representations of models rigid-body fitted into the Ub+ map: Core-UBE2T-ID-DNA in closed-ID conformation (colored as in Fig. 1d), ubiquitin (PDB 4BVU, yellow), and mono-ubiquitinated FANCD2 (gray, Ub orange) from IDUb (PDB 6VAE) superimposed on FANCD2. The ubiquitin C-terminus (“C” in black sphere) is closer to UBE2T Cys86 (labeled) than to FANCD2 Lys561 (labeled), which is at the opposite side of Cys86.
d, Superposition of UBE2T-Ub moieties (ubiquitin in yellow) and two other E2-Ub conjugates on UBE2T (ubiquitin from PDB 4AP4 in green, and that from 5TTE in blue, all E2 in magenta).
e, Gold-standard FSC plot between two independently refined half-maps for the Ub+ reconstruction, with the FSC cutoff 0.143 marked by horizontal dashed lines.
Extended Data Fig. 3. Conformations and dimerization of FANCB-FAAP100 and FANCA.
a, FANCB-FAAP100 heterodimer colored as in Figure 1a, except for the FANCB β sandwich (red) and α/β domain (blue), and the FAAP100 β sandwich (orange) and α/β domain (pink).
b-c, Superposition of the β sandwich (b) and α/β domains (c) of FANCB and FAAP100.
d, Illustration showing the divergent domain-domain packing arrangements of FANCB and FAAP100, aligned within the indicated dotted boxes.
e-g, Dimer of FANCB-FAAP100 heterodimer looking down the 2-fold rotation axis (marked red). WD40 domains are rendered with an envelope to facilitate comparison of their different positions and orientations.
f-g Superposition of the dimer with a 2-fold rotated copy aligned on the central core, looking down the 2-fold axis (f) or rotated 90° about the axis (g), showing the WD40 and most of the coiled-coil domains do not superimpose.
h-i, Superpositions of the coiled-coil helices (h) and the WD40-WD40 pairs (i) at the inactive-side (FANCB blue, FAAP100 green) and active-side (both gray). The helical bend angles and their approximate positions are as shown. Red sticks indicate the internal rotation axis of each WD40 domain; arrows show the directions of the central β strands.
j, Side by side comparison of FANCA (orange NTD) and FANCA’ (yellow NTD), superimposed on their CTD domains (both gray). The MD domain (red) is disordered in FANCA’ (dashed circle).
k-l, Superpositions of the FANCA and FANCA’ NTD domains (gray) (k) and the N-terminal segments (colored as in j) (l).
m, Close-up view of contacts between FANCA’ NTD and the HB domains of FANCB and FAAP100.
n, Close-up view of FANCA dimerization interface, colored as in Figure 1a (black line shows axis of dimer symmetry), showing interacting residues (green-dotted lines indicate hydrogen bonds) (additional discussion of n is in Supplementary Note 2).
Extended Data Fig. 4. Inter-subunit interactions of FANCL and of FANCC-FANCENTD-FANCF.
a-b, Overall views of FANCL at the active-side (a) and inactive-side (b) of the apo-Core complex also showing their Core-contacts. View in b is oriented as in a by superposition on the RWD1 domain. Dashed red circle indicates that the FANCL’ RING domain is poorly ordered in the apo-Core complex structure. The regions that panels d-i zoom into are delineated by dashed rectangles. The N- and C-termini of FANCL/FANCL’ are labeled.
c, Top, the FANCC-FANCENTD-FANCF subcomplex also showing FANCL to which it makes its majority of contacts. View is rotated by 62° about the horizontal axis relative to b. Bottom, view rotated by 180° about the vertical axis. The regions that panels j-m zoom into are delineated by dashed rectangles looking into the plane of the figure, or by slanted rectangles with arrows indicating the direction of the view. The N- and C-termini of FANCC, FANCENTD and FANCF are labeled.
d-g, Close-up views showing interactions of FANCB-FAAP100 coiled coil with the FANCL RWD2 domain at the active (d) and inactive (e) sides of the Core complex, with the FANCL RWD1 domain at the active (f) and inactive (g) sides of the Core complex.
h-i, Close-up views of the contacts FANCC and FANCENTD make to the FANCL RWD1, RWD3 and RING domains at the inactive side. The helix α18 of FANCC is not shown for clarity in h.
j-m, Close-up views of the contacts between FANCC and FANCF (j, k), and between FANCC and FANCENTD (l, m). Subunits are colored as in Figure 1a. Only side chains involved in intermolecular interactions are shown. Green dotted lines indicate hydrogen bond contacts. Dashed colored curves indicate disordered regions. The interactions shown in panels d to m are described in Supplementary Note 3.
Extended Data Fig. 5. Hypothetical assembly sequence for the Core complex.
a, Individual Core subunits are rendered as low-resolution surfaces and colored as in Figure 1a. At step 1, two FANCL subunits bind to the hub of a dimer of FANCB-FAAP100 heterodimers. At step 2, FANCC-FANCE-FANCF and a dimer of FANCG-FANCA heterodimers transiently bind to the hub, but do not remain stably bound. At step 3, avidity from an interaction between the FANCG and FANCF subunits of the transiently-bound FANCC-FANCE-FANCF and FANCG-FANCA results in their stable association with the hub. This assembly can bind a second FANCG-FANCA dimer of heterodimers and give rise to a fully symmetric but inactive complex that is found in ~1% of the particles (Extended Data Fig. 7). This symmetric complex is rare because FANCA’-FANCG’ association with the hub in step 4 is intramolecular and presumably faster. The Core could, in principle, transiently bind to additional FANCC-FANCE-FANCF and FANCG-FANCA in step 5, but the FANCF-FANCG bridge that would stabilize their transient association with the hub cannot form owing to the different positions of the FANCB’-FAAP100’ WD40 domains and associated FANCL’ induced by FANCG’ binding.
b-c, The FANCA dimer cannot assemble with the hub in a 2-fold symmetric manner. Model of 2-fold symmetric FANCB-FAAP100-FANCL-FANCC-FANCE-FANCF-FANCG with a dimeric FANCA-FANCG subcomplex superimposed on the inactive side of the model in either the inactive-side conformation (FANCG aligned) (b), or in the active side conformation (FANCG’ aligned) (c). The second FANCG of the superimposed subcomplex is in black. Arrow between equivalent atoms indicates the distance (100 Å for b and 220 Å for c) of this second FANCG from the position of FANCG” in the 2-fold symmetric model.
d, Summary of total surface area buried at subunit-subunit interfaces of the apo-Core and the open and closed ID conformation Core-UBE2T-ID.
Extended Data Fig. 6. Inter-subunit interactions of FANCG.
a-b, Overall views of FANCG (a) or FANCG’(b), oriented similarly by aligning their central region, also showing their binding partners or portions thereof. Dashed rectangles indicate the regions that the subsequent panels zoom into. The N- and C-termini of FANCG, FANCG’, FANCA’, the C-terminus of FANCF and the N-terminus of FANCA are labeled.
c-f, Close-up views of the contacts between FANCG and to the N-terminal extended segment of FANCA at the inactive-side (c, d) and active-side (e, f) of the apo-Core complex. They are conserved in both sides, except that the FANCA’ α5 helix is uninvolved in contacts due to the different relative orientation of the subsequent FANCA’ NTD with which it packs (Extended Data Fig. 3j).
g, Close-up view of the inactive-side contacts between FANCG and FANCF. Five FANCF residues that when mutated in a cluster compromise Core complex assembly, FANCD2 ubiquitination and ICL resistance31 are marked with a red asterisk.
h, Close-up view of the active-side FANCG’ packing with the C-terminal helical repeats of FANCA’. FANCG’ is oriented as in g to underscore the partial overlap in the FANCF and FANCA’ CTD binding sites of FANCG/FANCG’.
i, Close-up view of the inactive side FANCG binding to the FAAP100 WD40 domain. The inset shows the FANCG zinc-binding site that is otherwise obscured.
j-k, By contrast to the inactive-side FANCG, the active side FANCG’ binds to the FANCB α/β domain (j) and the FANCB’ WD40 domain (k), in two small interfaces. Subunits are colored as in Figure 1a. Only side chains involved in intermolecular interactions are shown. Green or yellow dotted lines indicate hydrogen bond contacts. The interactions are described in Supplementary Note 4.
Extended Data Fig. 7. An inactive, 2-fold symmetric Core complex corresponding to ~1% of the data set.
a, Graph shows gold-standard FSC plots between two independently refined half-maps for the three focused bodies of the RELION3 multi-body reconstruction in point group C1 with 7,331 particles. The resolution of the three bodies at the FSC value of 0.143 is 6.4, 6.5 and 7.6 Å, with the third body corresponding to what is the active side in the canonical Core complex.
b, Model of the proper 2-fold symmetric Core, built by fitting individual subunits or their domains into the density with CHIMERA47. There is residual FANCA density only for its NTD, although it is very weak on the side (right side) that has overall weaker density. It is possible that the stronger FANCANTD density on the left side is due to 3D classification not removing all asymmetric Core particles. View is looking down the 2-fold axis (marked by curved arrow) as in Figure 1a.
c, Superposition of the 2-fold symmetric (colored as in b) and asymmetric (gray) Core complexes by aligning the central portion of the FANCB-FAAP100 hub.
d-f, Cryo-EM density of the proper 2-fold symmetric Core complex in four orientations related by operations shown. The partially transparent maps are colored by subunit, and the model is overlaid. d is the same orientation as b. FANCC’-FANCE’-FANCF’-FANCG’-FANCL’ are labeled. The bashed box is the area shown in a close-up in g.
g, Close-up view of f focusing on the second FANCL’ sequestered by FANCC’-FANCE’-FANCF’.
Extended Data Fig. 8. Fanconi Anemia missense mutations in the Core complex.
a, Summary of mutations in Core complex subunits from the Fanconi Anemia Mutation Database (http://www2.rockefeller.edu/fanconi/). For each subunit, the total number of database entries, the subset that represents missense mutations, and the missense mutations annotated as pathogenic or likely pathogenic are listed. The overall number of missense mutations is much smaller than other types of alterations. The most prevalent alterations are intragenic deletions in FANCA, suggested to correlate with the number of intronic Alu repeats, as well as microdeletions and insertions at homopolymeric tracts or direct repeats48,49.
b, The pathogenic missense mutations are mapped onto the Core-ID-DNA structure, rendered semi-transparent, in an orientation as in Figure 1a. Residues reported mutated two or more times are shown as spheres with a diameter proportional to the number of mutations in the database, except for those with 2 to 4 mutations, which have the same, smallest diameter.
c, Column graph of the number of pathogenic missense mutations in the FANCA protein, with the frequently mutated residues colored by their vicinity to the various structural and functional elements of the protein as indicated. Residues mutated 10 or more times are labeled.
d, Overall view of the mutated residues (thick sticks) in the vicinity of the FANCA homodimer interface (semi-transparent cartoon), looking down the approximate 2-fold axis indicated by a meniscus. Inactive-side FANCA mutants are in magenta (labeled), and those of the active-side FANCA’ in ruby.
e-h, Close-up views of mutations from d. The mutations are discussed in Supplementary Note 5.
i-l, Close-up views of FANCA mutations near the FANCA’ CTD that packs with FANCG’.
m-q, Close-up views of other FANCA mutations.
r-w, Close-up views of FANCG mutations.
x-y, Close-up views of FANCC mutations.
z, Close-up views of a FANCE mutation.
Extended Data Fig. 9. FANCI and FANCD2 conservation and conformational changes.
a-c, Molecular surface representations of FANCD2 (a), FANCL’-UBE2T (b) and FANCI (c) viewed from the perspective of the interacting partner (FANCL’-UBE2T perspective for FANCI and FANCD2, and ID perspective for FANCL’-UBE2T). For each, left surface has the intermolecular contacts marked in green (FANCL’UBE2T contacts for FANCI and FANCD2, and ID contacts for FANCL’-UBE2T), and right surface is colored by conservation (yellow to red for low to high conservation). Select elements of FANCL’UBE2T are labeled. Dark curve on FANCL’ delineates its RWD3 and RING domains.
d, The FANCI (left, cyan) and FANCD2 (right, pink) proteins from the open conformation Core-ID complex superimposed on the corresponding proteins from the free human ID complex28 (orange FANCI and green FANCD2). FANCECTD is shown as a light blue surface. Additional discussion in Supplementary Note 6.
e, Closed conformation FANCI (left, cyan) and FANCD2 (right, pink) proteins superimposed on those of the open-conformation complex (orange FANCI and green FANCD2). Additional discussion in Supplementary Note 6.
f, Closed conformation FANCI (left, cyan) and FANCD2 (right, pink) superimposed on the IDUb proteins28 (orange FANCI and green FANCD2). Rotation axis and directions are marked by grey lines and curved arrows. Rotation angles, mono-ubiquitination sites, and the N- and C-termini of FANCI and FANCD2 are labeled.
Extended Data Fig. 10. Comparison of the human and chicken Core complexes.
a, Side by side comparison of the human apo-Core complex reported in this paper (left) and the chicken Core complex reported by Shakeel et al22 (right, PDB:6SRI), oriented approximately as Figure 1e of the Shakeel et al paper. Subunits of the chicken Core are labeled according to the proposed interpretation in the PDB file and figures of the Shakeel et al study. Because FANCB and FAAP100’ (except their WD40 and coiled-coil domains) could not be distinguished in that study, they are both colored blue and labeled as “B-P100 and B’-P100’ ”. Similarly, FANCC, FANCE and the N-terminal portion of FANCF were not distinguished; they are all colored pink and labeled “C-E”. The FANCF C-terminal portion, for which a crystal structure exists31, is labeled as “F”. The rest of the subunits are colored and labeled as in Figure 1a here.
b, Cartoon shows the chicken Core colored gray for polypeptide chains traced in the same direction as the human complex, and dark blue for those traced in the opposite direction (49 % of residues).
c, The FANCG’ polypeptide chains in the human (left) and chicken (right) Core complexes have opposite directions. FANCG’ proteins are represented as tubes colored from blue (N-terminus) to red (C terminus).
d, Side-by-side comparison of the portion referred to as “base region” in the Shakeel et al study (human Core left, chicken Core right) labeled and colored as in a.
e, Comparison of FANCB-FAAP100 WD40-WD40 domains of the human (1st panel) and chicken (2nd and 3rd panels) core complexes. The dotted arrows indicate the self-rotation axis of the β-propellers, with the arrowheads indicating their orientations. The angles between the two axes are marked. Additional discussion in Supplementary Note 7.
Supplementary Material
Acknowledgments
We thank the staff of the MSKCC Cryo-EM facility, the NYSBC Simons Electron Microscopy Center (supported by grants from the Simons Foundation SF349247, NYSTAR, and the NIH National Institute of General Medical Sciences GM103310), and the HHMI Cryo-EM facility for help with data collection. Supported by HHMI and National Institutes of Health grant CA008748.
Footnotes
Competing interests The authors declare no competing financial interests.
Data availability.
The coordinates of Core, Core-ID, Core-UBE2T-ID, Core-UBE2T-ID-DNA (3 conformations) and the corresponding cryo-EM maps, including the focused reconstructions and the composite maps used in refinement, have been deposited with the Protein Data Bank (PDB) and the Electron Microscopy Data Bank (EMDB) under accession codes PDB 7KZP and EMDB-23085 (Core complex), PDB 7KZQ and EMDB-23086 (Core-ID), PDB 7KZR and EMDB-23087 (Core-UBE2T-ID), PDB 7KZS and EMDB-23088 (open-ID conformation Core-UBE2T-ID-DNA), PDB 7KZT and EMDB-23089 (intermediate-ID conformation Core-UBE2T-ID-DNA) and PDB 7KZV and EMDB-23090 (closed-ID conformation Core-UBE2T-ID-DNA).
References
- 1.Taylor AMR et al. Chromosome instability syndromes. Nat Rev Dis Primers 5, 64 (2019). [DOI] [PMC free article] [PubMed] [Google Scholar]
- 2.Ceccaldi R, Sarangi P & D'Andrea AD The Fanconi anaemia pathway: new players and new functions. Nat Rev Mol Cell Biol 17, 337–49 (2016). [DOI] [PubMed] [Google Scholar]
- 3.Zhang J et al. DNA interstrand cross-link repair requires replication-fork convergence. Nat Struct Mol Biol 22, 242–7 (2015). [DOI] [PMC free article] [PubMed] [Google Scholar]
- 4.Lopez-Martinez D, Liang CC & Cohn MA Cellular response to DNA interstrand crosslinks: the Fanconi anemia pathway. Cell Mol Life Sci 73, 3097–114 (2016). [DOI] [PMC free article] [PubMed] [Google Scholar]
- 5.Longerich S, San Filippo J, Liu D & Sung P FANCI binds branched DNA and is monoubiquitinated by UBE2T-FANCL. J Biol Chem 284, 23182–6 (2009). [DOI] [PMC free article] [PubMed] [Google Scholar]
- 6.Yuan F, El Hokayem J, Zhou W & Zhang Y FANCI protein binds to DNA and interacts with FANCD2 to recognize branched structures. J Biol Chem 284, 24443–52 (2009). [DOI] [PMC free article] [PubMed] [Google Scholar]
- 7.Boisvert RA & Howlett NG The Fanconi anemia ID2 complex: dueling saxes at the crossroads. Cell Cycle 13, 2999–3015 (2014). [DOI] [PMC free article] [PubMed] [Google Scholar]
- 8.Patel DR & Weiss RS A tough row to hoe: when replication forks encounter DNA damage. Biochem Soc Trans 46, 1643–1651 (2018). [DOI] [PMC free article] [PubMed] [Google Scholar]
- 9.Sirbu BM et al. Identification of proteins at active, stalled, and collapsed replication forks using isolation of proteins on nascent DNA (iPOND) coupled with mass spectrometry. J Biol Chem 288, 31458–67 (2013). [DOI] [PMC free article] [PubMed] [Google Scholar]
- 10.Cole AR, Lewis LP & Walden H The structure of the catalytic subunit FANCL of the Fanconi anemia core complex. Nat Struct Mol Biol 17, 294–8 (2010). [DOI] [PMC free article] [PubMed] [Google Scholar]
- 11.Hodson C, Purkiss A, Miles JA & Walden H Structure of the human FANCL RING-Ube2T complex reveals determinants of cognate E3-E2 selection. Structure 22, 337–44 (2014). [DOI] [PMC free article] [PubMed] [Google Scholar]
- 12.Zheng N & Shabek N Ubiquitin Ligases: Structure, Function, and Regulation. Annu Rev Biochem 86, 129–157 (2017). [DOI] [PubMed] [Google Scholar]
- 13.van Twest S et al. Mechanism of Ubiquitination and Deubiquitination in the Fanconi Anemia Pathway. Mol Cell 65, 247–259 (2017). [DOI] [PubMed] [Google Scholar]
- 14.Huang Y et al. Modularized functions of the Fanconi anemia core complex. Cell Rep 7, 1849–57 (2014). [DOI] [PMC free article] [PubMed] [Google Scholar]
- 15.Rajendra E et al. The genetic and biochemical basis of FANCD2 monoubiquitination. Mol Cell 54, 858–69 (2014). [DOI] [PMC free article] [PubMed] [Google Scholar]
- 16.Leung JW et al. Fanconi anemia (FA) binding protein FAAP20 stabilizes FA complementation group A (FANCA) and participates in interstrand cross-link repair. Proc Natl Acad Sci U S A 109, 4491–6 (2012). [DOI] [PMC free article] [PubMed] [Google Scholar]
- 17.Leveille F et al. The Fanconi anemia gene product FANCF is a flexible adaptor protein. J Biol Chem 279, 39421–30 (2004). [DOI] [PubMed] [Google Scholar]
- 18.Gordon SM & Buchwald M Fanconi anemia protein complex: mapping protein interactions in the yeast 2- and 3-hybrid systems. Blood 102, 136–41 (2003). [DOI] [PubMed] [Google Scholar]
- 19.Pace P et al. FANCE: the link between Fanconi anaemia complex assembly and activity. EMBO J 21, 3414–23 (2002). [DOI] [PMC free article] [PubMed] [Google Scholar]
- 20.Medhurst AL et al. Evidence for subcomplexes in the Fanconi anemia pathway. Blood 108, 2072–80 (2006). [DOI] [PMC free article] [PubMed] [Google Scholar]
- 21.Swuec P et al. The FA Core Complex Contains a Homo-dimeric Catalytic Module for the Symmetric Mono-ubiquitination of FANCI-FANCD2. Cell Rep 18, 611–623 (2017). [DOI] [PMC free article] [PubMed] [Google Scholar]
- 22.Shakeel S et al. Structure of the Fanconi anaemia monoubiquitin ligase complex. Nature (2019). [DOI] [PMC free article] [PubMed] [Google Scholar]
- 23.Sato K, Toda K, Ishiai M, Takata M & Kurumizaka H DNA robustly stimulates FANCD2 monoubiquitylation in the complex with FANCI. Nucleic Acids Research 40, 4553–4561 (2012). [DOI] [PMC free article] [PubMed] [Google Scholar]
- 24.Longerich S, Filippo JS, Liu DQ & Sung P FANCI Binds Branched DNA and Is Monoubiquitinated by UBE2T-FANCL. Journal of Biological Chemistry 284, 23182–23186 (2009). [DOI] [PMC free article] [PubMed] [Google Scholar]
- 25.Liang CC et al. The FANCD2-FANCI complex is recruited to DNA interstrand crosslinks before monoubiquitination of FANCD2. Nat Commun 7, 12124 (2016). [DOI] [PMC free article] [PubMed] [Google Scholar]
- 26.Longerich S et al. Regulation of FANCD2 and FANCI monoubiquitination by their interaction and by DNA. Nucleic Acids Research 42, 5657–5670 (2014). [DOI] [PMC free article] [PubMed] [Google Scholar]
- 27.Joo W et al. Structure of the FANCI-FANCD2 complex: insights into the Fanconi anemia DNA repair pathway. Science 333, 312–6 (2011). [DOI] [PMC free article] [PubMed] [Google Scholar]
- 28.Wang R, Wang S, Dhar A, Peralta C & Pavletich NP DNA clamp function of the monoubiquitinated Fanconi anaemia ID complex. Nature 580, 278–282 (2020). [DOI] [PMC free article] [PubMed] [Google Scholar]
- 29.Alcón P et al. FANCD2–FANCI is a clamp stabilized on DNA by monoubiquitination of FANCD2 during DNA repair. Nature Structural & Molecular Biology 27, 240–248 (2020). [DOI] [PMC free article] [PubMed] [Google Scholar]
- 30.Polito D et al. The carboxyl terminus of FANCE recruits FANCD2 to the Fanconi Anemia (FA) E3 ligase complex to promote the FA DNA repair pathway. J Biol Chem 289, 7003–10 (2014). [DOI] [PMC free article] [PubMed] [Google Scholar]
- 31.Kowal P, Gurtan AM, Stuckert P, D'Andrea AD & Ellenberger T Structural determinants of human FANCF protein that function in the assembly of a DNA damage signaling complex. J Biol Chem 282, 2047–55 (2007). [DOI] [PubMed] [Google Scholar]
- 32.Karras GI et al. HSP90 Shapes the Consequences of Human Genetic Variation. Cell 168, 856–866 e12 (2017). [DOI] [PMC free article] [PubMed] [Google Scholar]
- 33.Adachi D et al. Heterogeneous activation of the Fanconi anemia pathway by patient-derived FANCA mutants. Hum Mol Genet 11, 3125–34 (2002). [DOI] [PubMed] [Google Scholar]
- 34.Buetow L et al. Casitas B-lineage lymphoma linker helix mutations found in myeloproliferative neoplasms affect conformation. BMC Biol 14, 76 (2016). [DOI] [PMC free article] [PubMed] [Google Scholar]
- 35.Plechanovova A, Jaffray EG, Tatham MH, Naismith JH & Hay RT Structure of a RING E3 ligase and ubiquitin-loaded E2 primed for catalysis. Nature 489, 115–20 (2012). [DOI] [PMC free article] [PubMed] [Google Scholar]
- 36.Pruneda JN et al. Structure of an E3:E2~Ub complex reveals an allosteric mechanism shared among RING/U-box ligases. Mol Cell 47, 933–42 (2012). [DOI] [PMC free article] [PubMed] [Google Scholar]
- 37.Dou H, Buetow L, Sibbet GJ, Cameron K & Huang DT BIRC7-E2 ubiquitin conjugate structure reveals the mechanism of ubiquitin transfer by a RING dimer. Nat Struct Mol Biol 19, 876–83 (2012). [DOI] [PMC free article] [PubMed] [Google Scholar]
- 38.Smogorzewska A et al. Identification of the FANCI protein, a monoubiquitinated FANCD2 paralog required for DNA repair. Cell 129, 289–301 (2007). [DOI] [PMC free article] [PubMed] [Google Scholar]
- 39.Zheng SQ et al. MotionCor2: anisotropic correction of beam-induced motion for improved cryo-electron microscopy. Nat Methods 14, 331–332 (2017). [DOI] [PMC free article] [PubMed] [Google Scholar]
- 40.Rohou A & Grigorieff N CTFFIND4: Fast and accurate defocus estimation from electron micrographs. J Struct Biol 192, 216–21 (2015). [DOI] [PMC free article] [PubMed] [Google Scholar]
- 41.Zivanov J et al. New tools for automated high-resolution cryo-EM structure determination in RELION-3. Elife 7(2018). [DOI] [PMC free article] [PubMed] [Google Scholar]
- 42.Emsley P, Lohkamp B, Scott WG & Cowtan K Features and development of Coot. Acta Crystallogr D Biol Crystallogr 66, 486–501 (2010). [DOI] [PMC free article] [PubMed] [Google Scholar]
- 43.Jones TA Interactive electron-density map interpretation: from INTER to O. Acta Crystallogr D Biol Crystallogr 60, 2115–25 (2004). [DOI] [PubMed] [Google Scholar]
- 44.Brown A et al. Tools for macromolecular model building and refinement into electron cryo-microscopy reconstructions. Acta Crystallogr D Biol Crystallogr 71, 136–53 (2015). [DOI] [PMC free article] [PubMed] [Google Scholar]
- 45.Winn MD et al. Overview of the CCP4 suite and current developments. Acta Crystallogr D Biol Crystallogr 67, 235–42 (2011). [DOI] [PMC free article] [PubMed] [Google Scholar]
- 46.Afonine PV et al. Towards automated crystallographic structure refinement with phenix.refine. Acta Crystallogr D Biol Crystallogr 68, 352–67 (2012). [DOI] [PMC free article] [PubMed] [Google Scholar]
- 47.Pettersen EF et al. UCSF Chimera--a visualization system for exploratory research and analysis. J Comput Chem 25, 1605–12 (2004). [DOI] [PubMed] [Google Scholar]
- 48.Wijker M et al. Heterogeneous spectrum of mutations in the Fanconi anaemia group A gene. Eur J Hum Genet 7, 52–9 (1999). [DOI] [PubMed] [Google Scholar]
- 49.Morgan NV, Tipping AJ, Joenje H & Mathew CG High frequency of large intragenic deletions in the Fanconi anemia group A gene. Am J Hum Genet 65, 1330–41 (1999). [DOI] [PMC free article] [PubMed] [Google Scholar]
Associated Data
This section collects any data citations, data availability statements, or supplementary materials included in this article.
Supplementary Materials
Data Availability Statement
The coordinates of Core, Core-ID, Core-UBE2T-ID, Core-UBE2T-ID-DNA (3 conformations) and the corresponding cryo-EM maps, including the focused reconstructions and the composite maps used in refinement, have been deposited with the Protein Data Bank (PDB) and the Electron Microscopy Data Bank (EMDB) under accession codes PDB 7KZP and EMDB-23085 (Core complex), PDB 7KZQ and EMDB-23086 (Core-ID), PDB 7KZR and EMDB-23087 (Core-UBE2T-ID), PDB 7KZS and EMDB-23088 (open-ID conformation Core-UBE2T-ID-DNA), PDB 7KZT and EMDB-23089 (intermediate-ID conformation Core-UBE2T-ID-DNA) and PDB 7KZV and EMDB-23090 (closed-ID conformation Core-UBE2T-ID-DNA).


