

SUMMARY
The utricle is a vestibular sensory organ that requires mechanosensitive hair cells to detect linear acceleration. In neonatal mice, new hair cells are derived from non-sensory supporting cells, yet cell type diversity and mechanisms of cell addition remain poorly characterized. Here, we perform computational analyses on single-cell transcriptomes to categorize cell types and resolve 14 individual sensory and non-sensory subtypes. Along the periphery of the sensory epithelium, we uncover distinct groups of transitional epithelial cells, marked by Islr, Cnmd, and Enpep expression. By reconstructing de novo trajectories and gene dynamics, we show that as the utricle expands, Islr+ transitional epithelial cells exhibit a dynamic and proliferative phase to generate new supporting cells, followed by coordinated differentiation into hair cells. Taken together, our study reveals a sequential and coordinated process by which non-sensory epithelial cells contribute to growth of the postnatal mouse sensory epithelium.
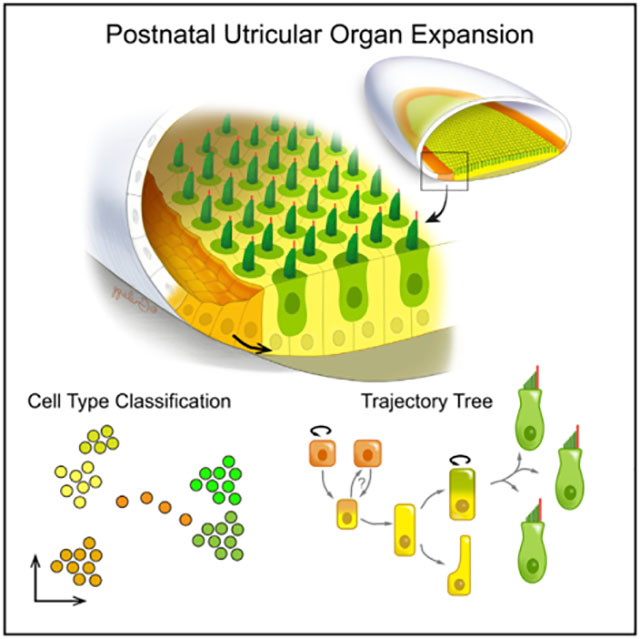
Graphical Abstract
In brief
The postnatal mouse utricle expands by more than 35% and doubles its number of hair cells during the first 8 days. Using single-cell transcriptomics, Jan et al. show that the surrounding transitional epithelial cells proliferate and contribute to the expansion of the sensory epithelium through a stepwise differentiation mechanism.
INTRODUCTION
The utricle is an inner ear vestibular sensory organ responsible for detecting linear acceleration. Its function depends on mechanosensitive hair cells that convert mechanical forces to neural stimuli. Hair cells are interdigitated by non-sensory supporting cells, which together form the sensory epithelium of the utricle. While non-mammalian vertebrates homeostatically regenerate hair cells, the adult mammalian utricle has considerably less regenerative capacity (Bucks et al., 2017; Sayyid et al., 2019; Warchol et al., 1993). In neonatal mice, the utricle is at a unique developmental stage becoming functional around postnatal day 3 (P3) and continues to expand via the addition of hair cells and supporting cells (Burns et al., 2012b; Freeman et al., 1999). It contains two types of hair cells and readily regenerates lost hair cells (Burns et al., 2015, 2012a; McInturff et al., 2018; Rüsch et al., 1998; Wang et al., 2019, 2015). This postnatal growth and maturation is robust, as the number of hair cells and supporting cells double while the dimension of the sensory epithelium increases by >35% during the first 8 postnatal days (Burns et al., 2012b). Nonetheless, the molecular dynamics of cell addition and coordinated maturation of different cell types within the utricle is poorly understood.
Utricular hair cells are broadly categorized into two groups, type I and type II, which are distinguished by their electrophysiological properties, morphology, innervation, and gene expression (Burns et al., 2015; Géléoc and Holt, 2003; Rüsch et al., 1998; Warchol et al., 2019). Within each hair cell subtype, electrophysiological properties continue to mature through the second postnatal week (Géléoc et al., 2004; Hurley et al., 2006; Rüsch et al., 1998). Hair cell innervation matures in parallel: type I hair cells gradually acquire specialized calyceal innervation in the first 3 postnatal weeks, while most type II hair cells already display bouton-like innervation in the neonatal utricle (Eatock et al., 1998; Eatock and Songer, 2011; Rüsch et al., 1998). Recent evidence also suggests that postnatally generated hair cells exhibit discordant maturation between hair bundles and basolateral currents, suggesting that they are distinct from those derived embryonically (Wang et al., 2019). At present, we lack molecular insights into this hair cell diversity in the postnatal mammalian utricle.
The sensory epithelium is spatially divided into two regions: striolar (central) and extrastriolar (peripheral). In addition to their roles as structural, homeostatic, and phagocytic functions, supporting cells serve as hair cell precursors following injury (Corwin and Oberholtzer, 1997; Janesick and Heller, 2019; Monzack and Cunningham, 2013; Wan et al., 2013; Wang et al., 2015; Warchol, 2011). At the periphery of the mitotically quiescent sensory epithelium is the transitional epithelium, a scantily characterized group of non-sensory cells that continue to proliferate in the early postnatal period (Figure S1A) (Burns et al., 2015; Gnedeva et al., 2017). The molecular diversity of utricular supporting cells and transitional cells as well as their developmental lineage relationships remain largely unexplored.
To dissect the molecular underpinning of cellular diversity of the postnatal mouse utricle, we performed full-length single-cell mRNA sequencing (scRNA-seq) to categorize cell types and to computationally infer their lineage trajectory. Our data at multiple postnatal time points reveal cell subtype and spatial heterogeneity in the developing utricle, including five groups of hair cells, two groups of supporting cells, and four groups of transitional epithelial cells (TECs). De novo trajectory reconstruction shows that the surrounding rim of transitional epithelial cells contributes to the expansion of the sensory epithelium via an intermediate common supporting cell progenitor prior to subsequent conversion to hair cells. Our study generates a comprehensive, data-rich roadmap revealing the temporal trajectory of the expanding postnatal mammalian utricle with detailed cellular classifications and computationally modeled lineage relationships.
RESULTS
Distinct cell populations in the postnatal mouse utricle
We obtained pure sensory epithelia sheets from utricles of neonatal mice at P2, P4, and P6 (Figure S1A). Because new hair cells and supporting cells are actively being added to the sensory epithelium in the postnatal period, we hypothesized that single cells harvested from the organ would reflect the heterogeneous populations of undifferentiated progenitor cells, specified supporting cells, and maturing hair cells (Géléoc and Holt, 2003; Zheng et al., 2014). We isolated and sequenced a total of 1,002 cells with a median depth count of 427,566 reads per cell and median gene count of 2,835 genes per cell (Figure S1B) prior to quality control. 861 cells passed all quality control metrics. Library size and batch effects were used during quality control steps (Figure S2). Following normalization (Figure S1C), unsupervised clustering with CellTrails identified 14 cell clusters marked as states 1–14 (S1–S14, Figure 1A) (Ellwanger et al., 2018).
Figure 1. Identification and characterization of cell groups in the postnatal mouse utricle.
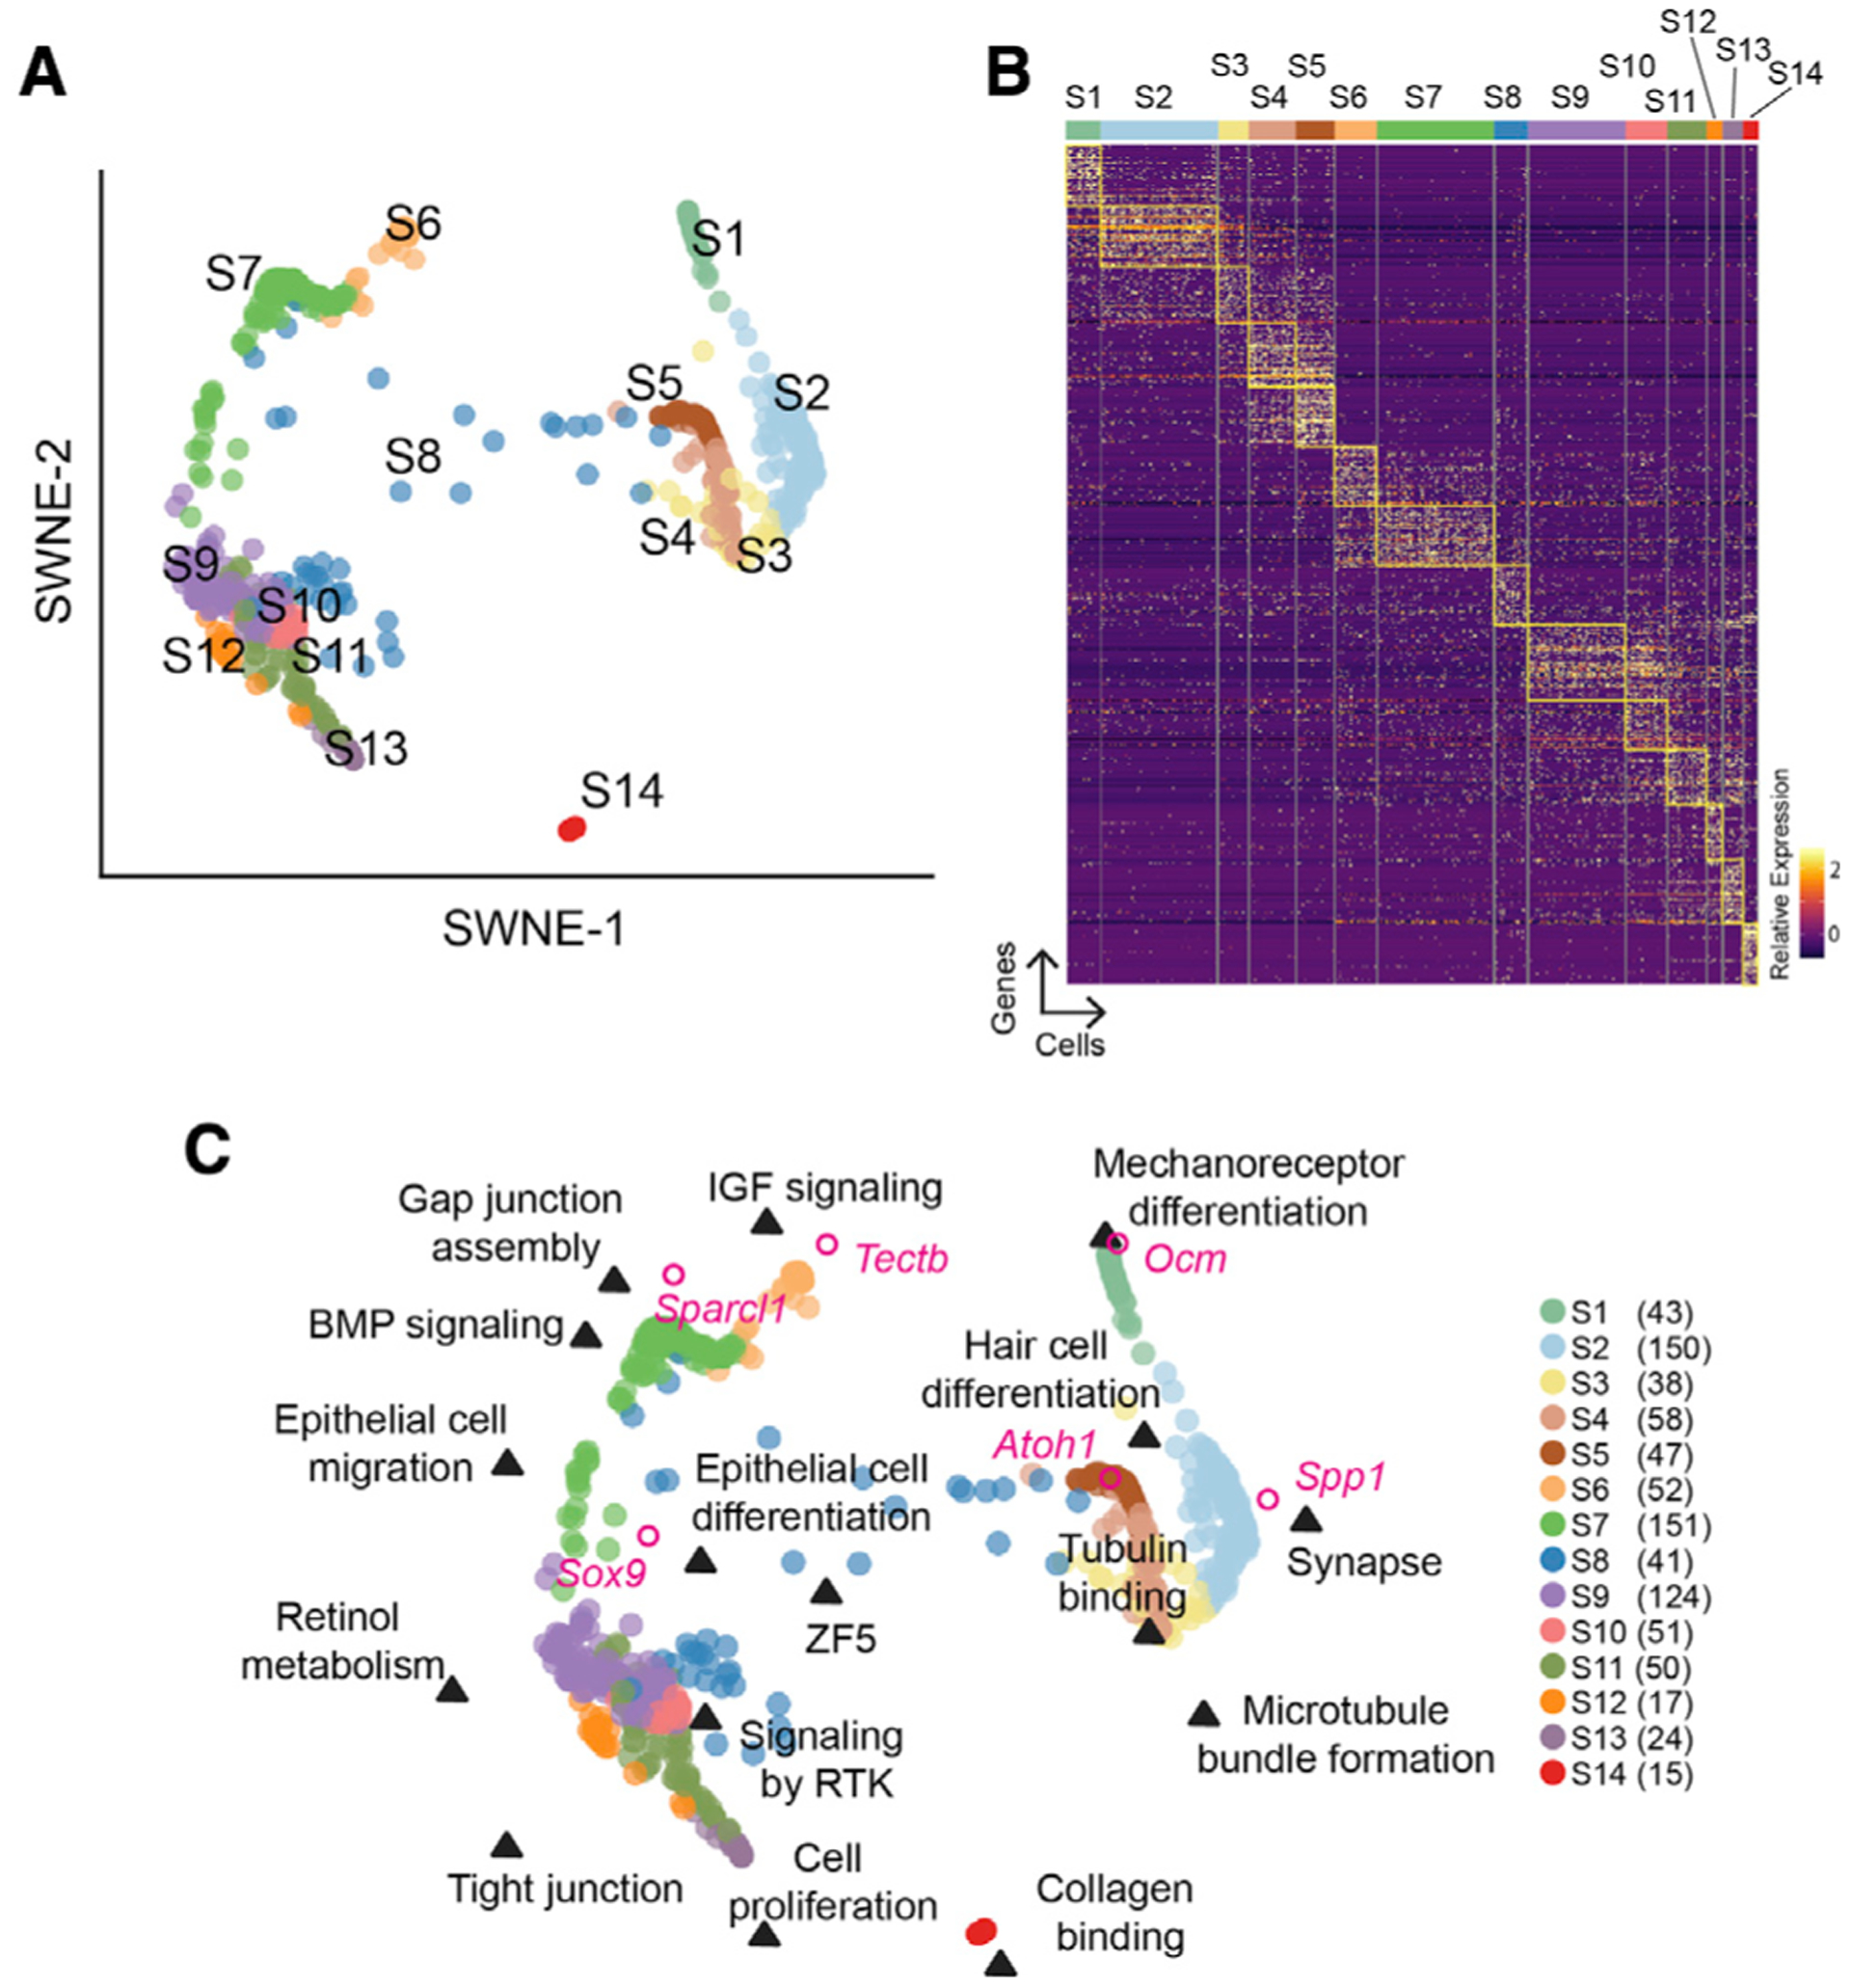
(A) CellTrails analysis of 861 utricular single cells harvested from postnatal day 2 (P2), P4, and P6 mice identified 14 cell clusters (S1–S14) represented in 2D using similarity weighted nonnegative embedding (SWNE).
(B) Heatmap showing differential gene expression of cell clusters in (A). The top 50 genes for each cluster are highlighted. Scaled expression of each gene from high (yellow, 2) to low (dark purple, 0) is indicated.
(C) SWNE of the 14 cell groups in (A) with incorporated key biological processes and genes. We identified three major categories of cell types: hair cells (HCs, on the right, S1–S5), supporting cells (SCs, top left, S6 and S7), and transitional epithelial cells (TECs, bottom left, S9–13). S8, which occupies the space between the SC/TEC and HC, represents HC precursors. S14 represents mesenchymal cells. The number of cells per cluster is indicated in parentheses.
Differential gene expression analysis revealed 1,922 cluster-defining genes at a minimum of 4-fold increased expression compared to other cell types (Figure 1B; Table S1). To delineate how similar gene expression is among cells within a cluster, and also among different clusters of cells, we decomposed the data into latent factors using similarity weighted nonnegative embedding (SWNE) (Wu et al., 2018). Sixteen significant latent factors were identified, which are represented by a weighted list of genes (Table S2) and the relationship of these factors to the 14 cell clusters (Figure 1C; Table S2). In order to perform meaningful pathway enrichment analysis that typically relies on a list of genes, we chose a cutoff using the top 100 genes from each latent factor for further analysis. Pathway enrichment analysis using g:Profiler identified the top biologically relevant processes associated with each latent factor (Figure S1D; Table S2) (Raudvere et al., 2019). Gene expression of known hair cell genes (Ocm, Spp1, Atoh1), supporting cell genes (Tectb, Sparcl1), and an epithelial gene (Sox9) were integrated into the SWNE plot (Figure 1C) (Mak et al., 2009). Based on marker gene and biological process integrations, we identified five general categories of cells: hair cells (S1–S5), supporting cells (S6 and S7), putative transitional epithelial cells (S9–S13), putative hair cell progenitors (S8), and mesenchymal cells (S14).
Transcriptional heterogeneity of hair cells
To validate classified cell types, we examined hair cell genes in P6 utricles. The classic pan-hair cell marker Myosin7a (Myo7a) was expressed in groups S1–S5 (Figure S3A). By comparing all hair cells as a group (S1–S5) to all non-hair cells (S6, S7, and S9–S13), but without the putative hair cell progenitors (S8), we identified 787 differentially expressed genes in hair cells compared to 406 genes in non-hair cells (Figures 2A and 2B; Table S3). As validation, we immunolabeled for MYO7A and SPARCL1, which serve as known markers of hair cells and supporting cells, respectively (Figures 2B and 2C) (Burns et al., 2015; Sahly et al., 1997; Xu et al., 2010). Apba1, Ttll3, and Hsd17b7 were all highly expressed in S1–S5 and predicted to be ubiquitous markers of hair cells similar to MYO7A. We observed Apba1 mRNAs in both type I and II hair cells in the striolar and extrastriolar regions (Figure 2C and S3). Transcripts of Ttll3, a tubulin glycine ligase with microtubule chain-initiating activity, were also localized to both types of hair cells (Figure 2D and S3) (Wloga et al., 2009). Immunostaining showed specific expression of HSD17B7 in all utricular hair cells examined (Figure 2E and S3). These results validate our computational analyses that identify the hair cell group, whose transcriptomes include Apba1, Ttll3, and Hsd17b7 (Figure S3; Table S3).
Figure 2. HC heterogeneity and marker gene validation.
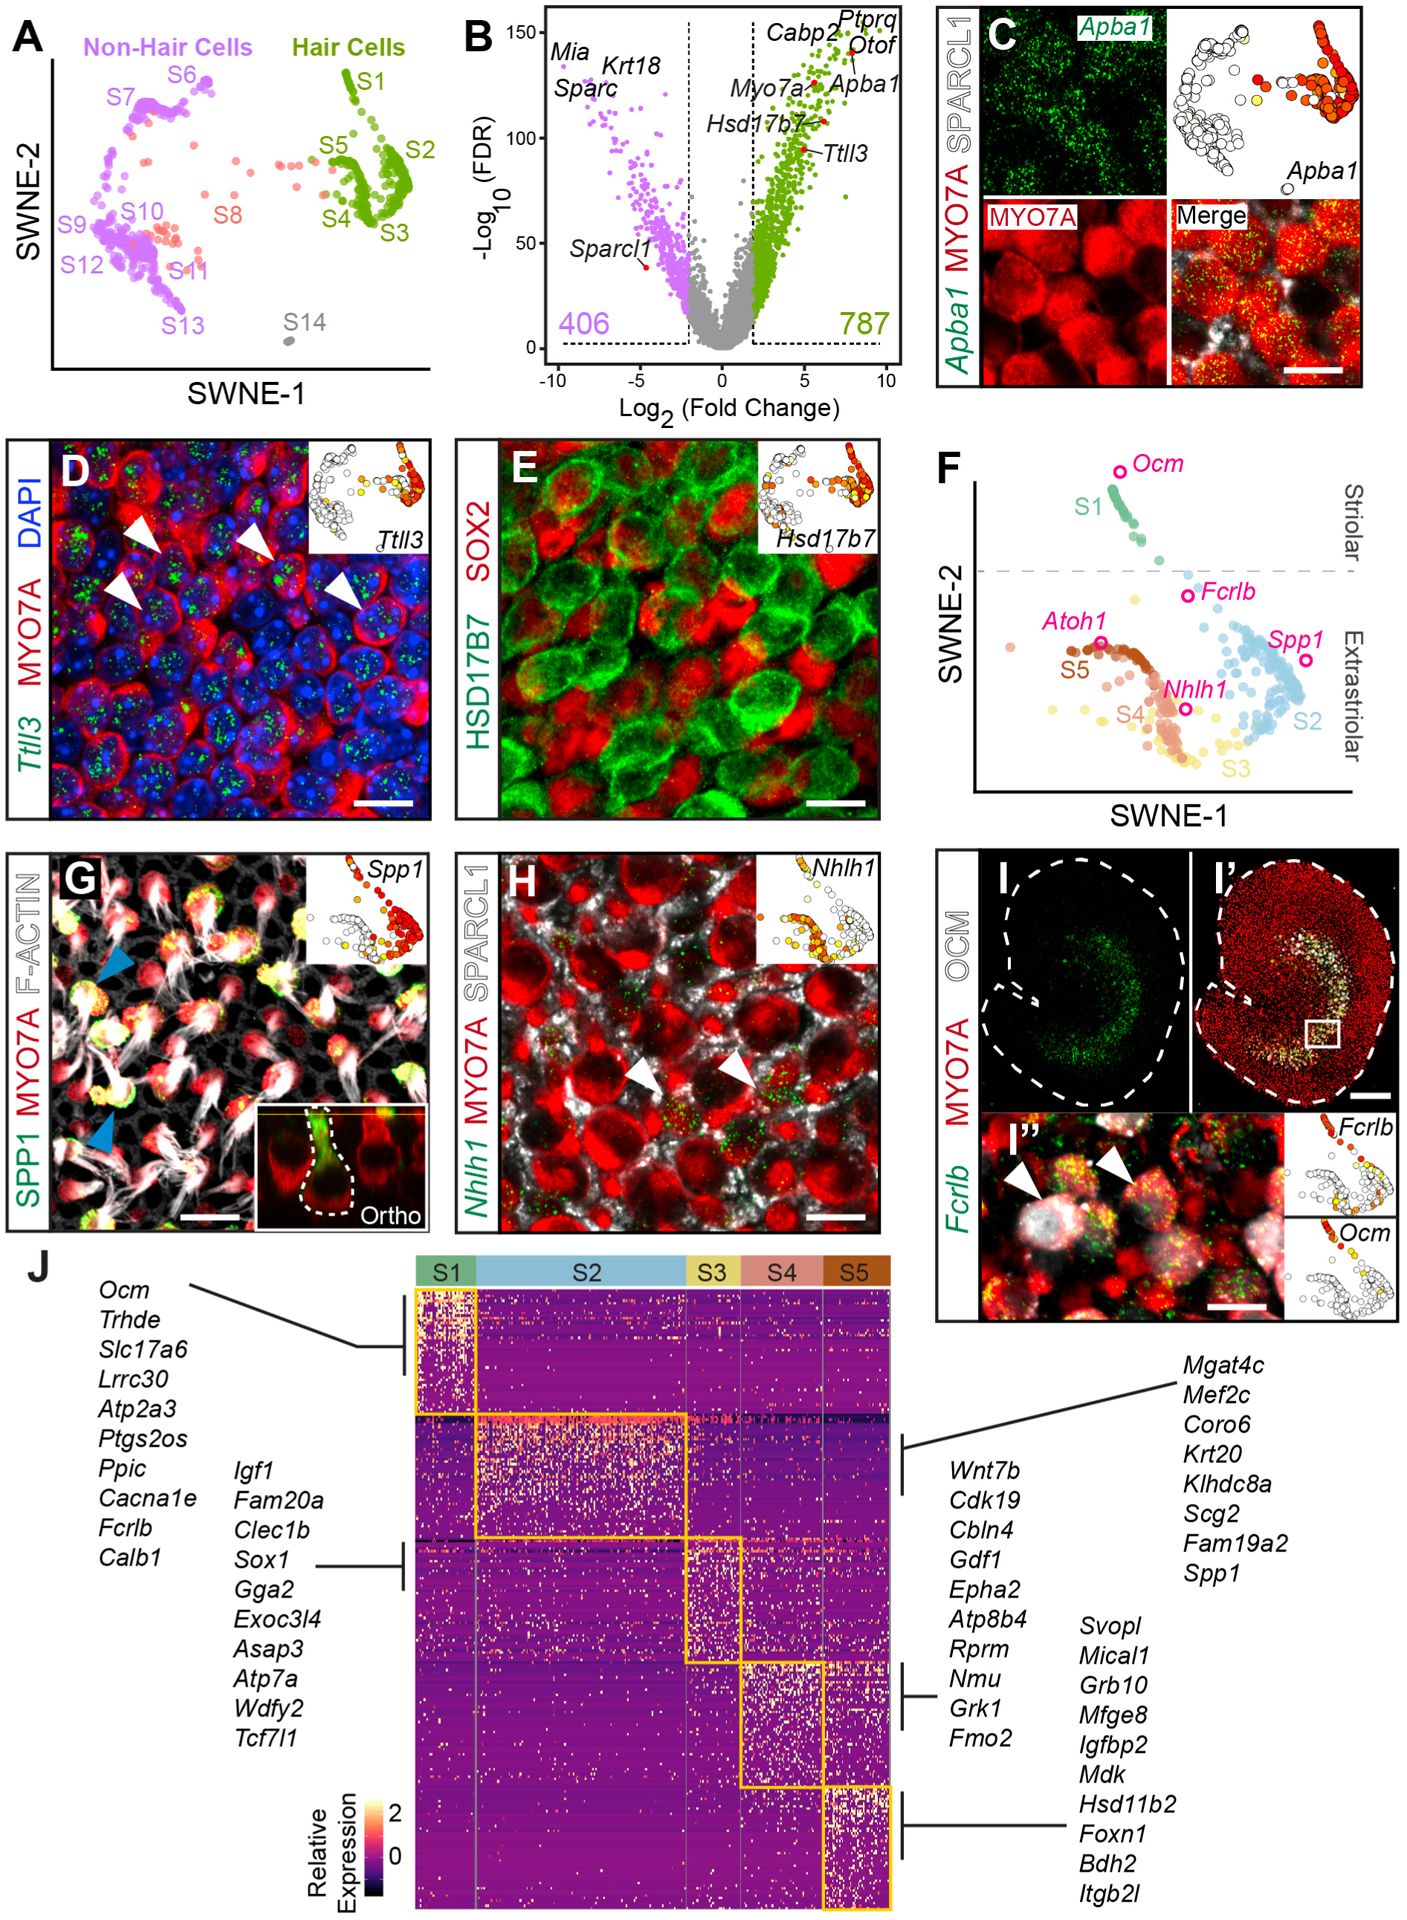
(A) SWNE plot highlighting putative HC groups (S1–S5, green) and non-HC groups (S6, S7, and S9–S13, purple).
(B) Differential gene expression as a volcano plot where each dot represents a gene. The colors represent the SWNE-colored HCs (green) and non-HCs (purple) from (A). The top three differentially expressed genes for both HCs and non-HCs are indicated with validated genes shown with red dots. See Table S3 for the full list.
(C) Immunostaining for the HC marker MYO7A (red) and SC marker SPARCL1 (white) and in situ hybridization (green dots) at the level of HC nuclei showing expression of Apba1 mRNA in HCs. SWNE plot showing single-cell Apba1 expression.
(D) Expression of Ttll3 mRNA (green) in MYO7A+ HCs (HC nuclei level, arrowheads).
(E) Immunostaining showing expression of HSD17B7 (green) in HCs (HC nuclei level).
(F) SWNE embedding of HC states S1–S5 extracted from (A) with integrated genes in pink circles and spatial segregation labeled.
(G) SPP1+ striolar type I HCs (HC bundle level, arrowheads) display MYO7A and phalloidin-labeled bundles. Bottom inset shows orthogonal view of an amphora-shaped type I HC expressing SPP1 (green). Top inset shows SWNE plot depicting single-cell Spp1 expression.
(H) Nhlh1 mRNA (green) is detected in a subset of MYO7A+ HCs and not in SPARCL1+ SCs (white) (type I HC nuclei level). Inset with SWNE plot shows Nhlh1 expression in type II HCs (S4 and S5).
(I) Whole-mount utricle demonstrating Fcrlb mRNA expression in the striolar region.
(I′) Co-localization of Fcrlb with the known striolar HC marker OCM and MYO7A.
(I″) High magnification shows MYO7A+ cells with OCM and Fcrlb mRNA labeling, with insets to the right demonstrating expression of both of these genes in single cells.
(J) Heatmap of differentially expressed genes showing marker genes in all five subsets of HCs. The top 50 genes for each cell state are included, and the most highly expressed genes listed for each group with scaled expression indicated in yellow as high and dark purple purple as no expression. See Table S4 for a full listing. Further sub-clustering of HCs showed eight groups (Table S5).
Scale bars, 10 μm, except 100 μm for I and I′. The SWNE plots in (C)–(E) and (I) show gene expression in a log2 expression scale, from 10 (red) to yellow (low) to white (0). Scales in (G) are 0–16, and in (H) are 0–8. See also Figures S3–S5 and Tables S3, S4, and S5.
The five different hair cell groups (S1–S5, Figure 2F) can be split into type I and type II hair cells characterized by expression of Spp1 (S1–S3, Figures 2G and S4A) and Nhlh1 (S4 and S5, Figures 2H and S4B), respectively (McInturff et al., 2018; Wang et al., 2019). Given that Spp1 is an established type I hair cell marker, we deduced that Nhlh1-expressing cells are type II hair cells based on the complementary expression patterns of the scRNA-seq data and in situ hybridization (Figure 2H). The categorization into different states also revealed spatial segregation of striolar hair cells (S1, n = 43 cells) marked by oncomodulin (OCM) immunolabeling (Figures 2I, S5A, and S5B) (Simmons et al., 2010). Each of the five cell states can be further characterized by a total of 3,662 differentially expressed genes (Figure 2J; Table S4). Striolar hair cells (S1) expressed the hair cell marker Calb1 and two other markers (Cacna1e and Atp2a3), which are involved in calcium regulation (Figure S5). Recently described in maturing inner hair cells in the cochlea, Fcrlb is highly expressed in S1 and in Ocm+ striolar hair cells, but not in extrastriolar hair cells (Figures 2I, 2J, and S5B), thus validating it as a specific marker of striolar hair cells (Chessum et al., 2018).
S2 cells are predominantly type I hair cells as marked by Spp1 and expression of Krt20 and Scg2 (Figures 2F and S5A). The S3 cell state is significantly enriched for Sparc expression. Both S4 and S5 expressed Nhlh1 and Anxa4 and represent type II hair cells (Figures 2F and S5A; Table S4) (McInturff et al., 2018). These are two type II hair cell states with S4 expressing Rprm and Cbln4. Sox2, a widely used type II hair cell marker at the protein level and known immature hair cell marker, shows greater expression in S5, but does not meet statistical significance (Figure S5A) (Oesterle et al., 2008). In addition to Nhlh1 and Anxa4, S5 cells express Mical1 and Foxn1. The hair cell transcription factor Atoh1 is expressed at similar levels in both S4 and S5, suggesting that these may be newly generated or immature hair cells (Figure S5A).
Among the striolar hair cells (S1), most expressed the type I hair cell marker Spp1 (n = 35 cells), while others were Spp1-negative (n = 8 cells). To further investigate hair cell heterogeneity in an unbiased manner, we reanalyzed the 336 hair cells in the S1–S5 groups. Using the method of Brennecke et al. (2013) to detect highly variable genes and CellTrails for re-clustering, we show that there are eight subgroups of hair cells with differentially expressed genes (Figure S5C; Table S5). Our data reveal diverse hair cell subtypes with distinct transcriptomes in the neonatal utricle.
Spatial segregation of supporting cells
Supporting cells are non-sensory cells that surround hair cells to form the sensory epithelium. We used Sparcl1 to identify supporting cells in our transcriptomic data (Figures 3A and 3B) and confirmed its expression in all supporting cells (Figure 3B), consistent with previous studies (Burns et al., 2015; Xu et al., 2010). Comparison between supporting cell and hair cell groups showed 384 and 855 genes that are expressed 4-fold higher, respectively (Figure 3C; Table S6). We validated three previously uncharacterized inner ear genes (Slc22a3, Nptx1, and Rlbp1) to be markers of supporting cells throughout the sensory epithelium (Figures 3D–3F; Figures S6A–S6C).
Figure 3. Identification and validation of SC-specific genes.
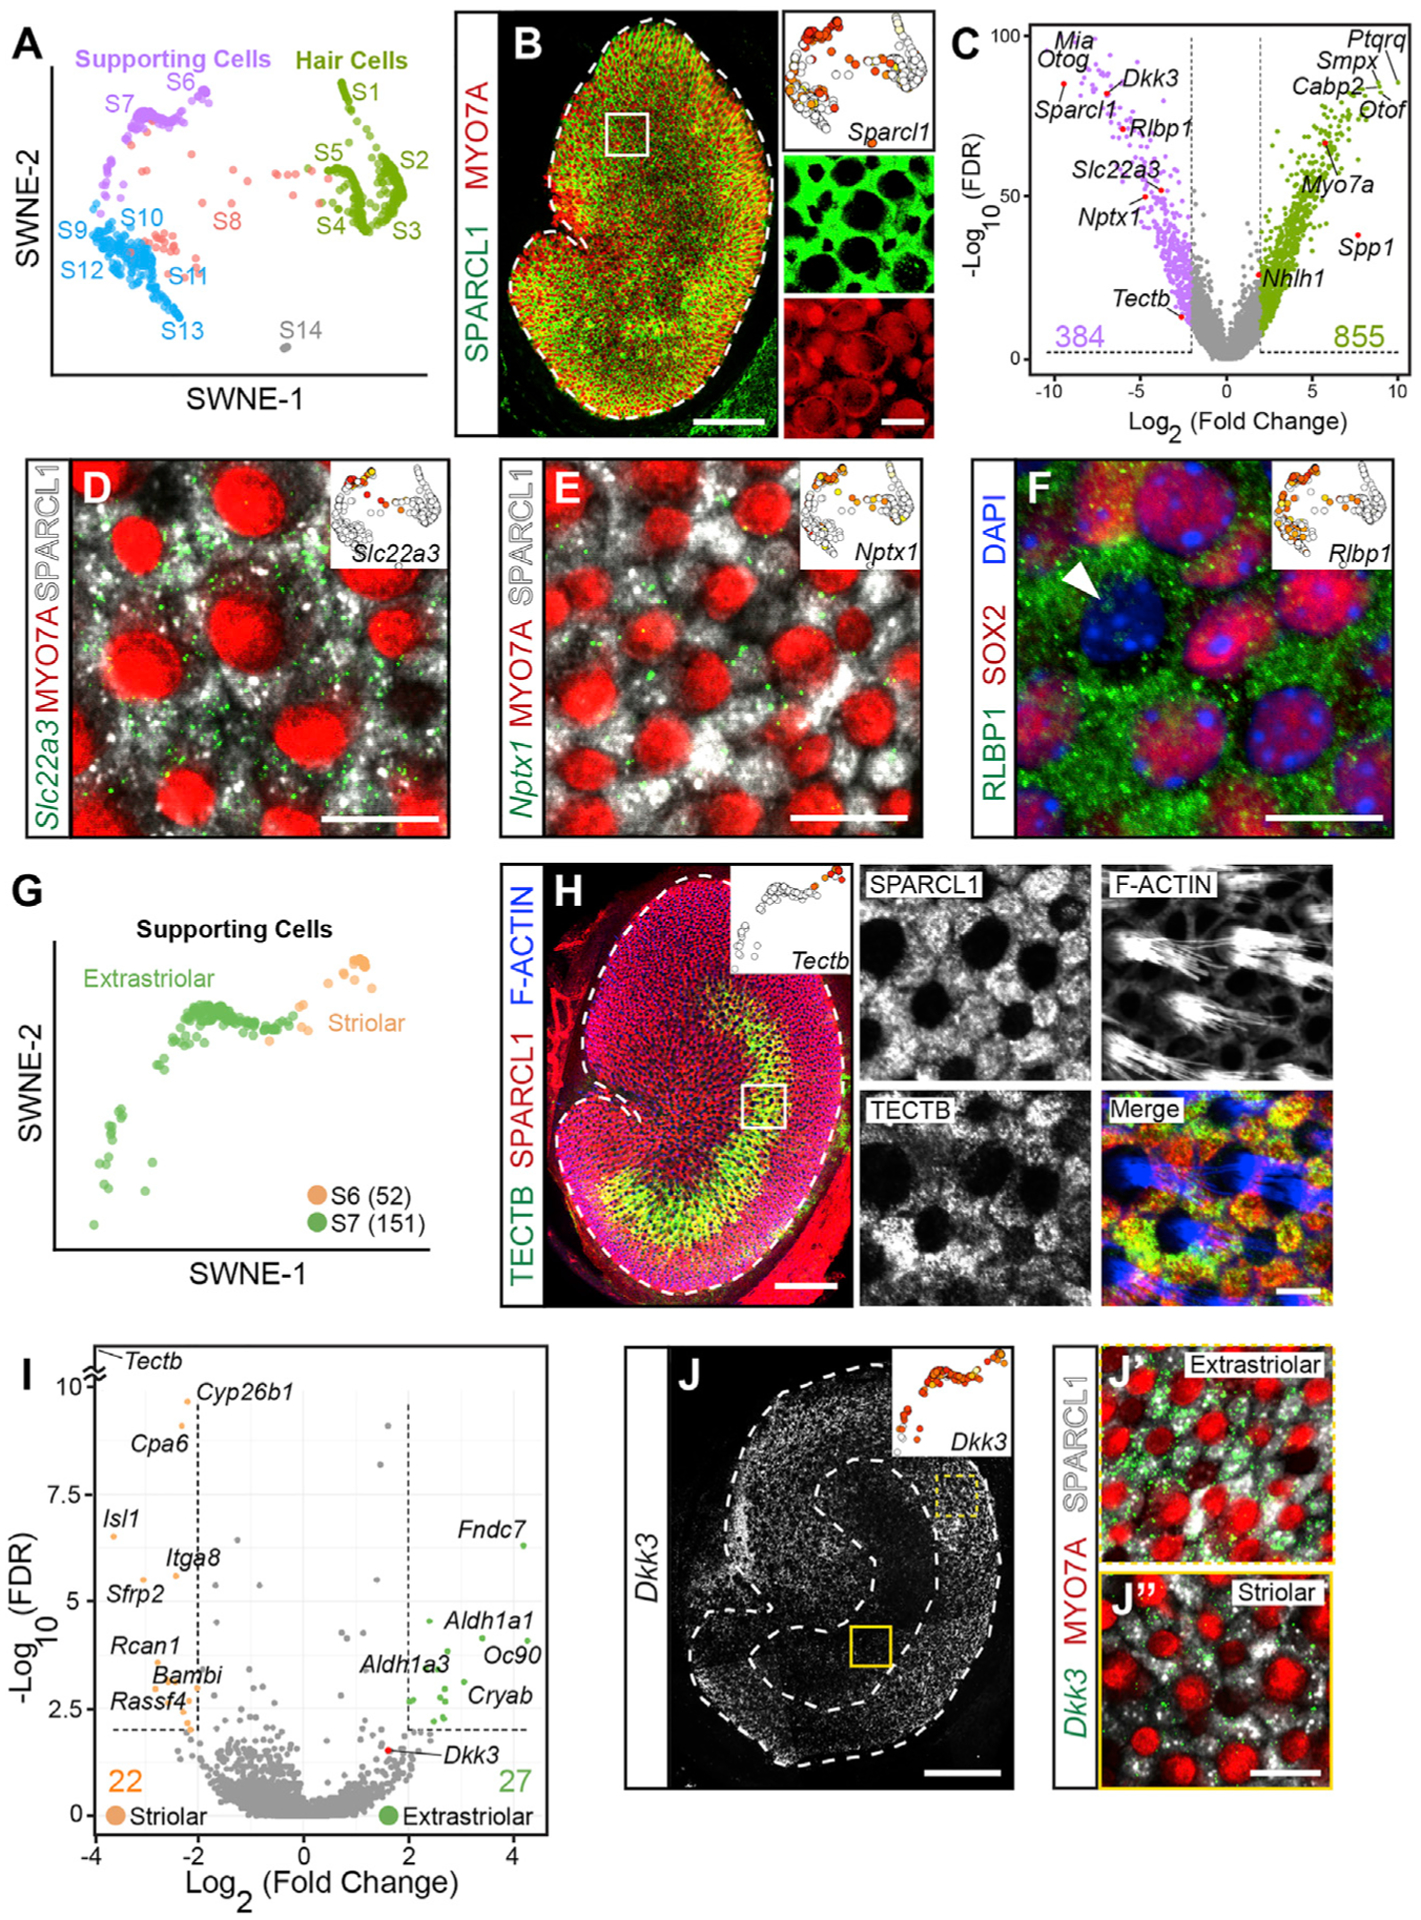
(A) SWNE plot highlighting SC states (S6 and S7, purple) and HC states (S1–S5, green).
(B) Whole-mount utricle immunolabeled for SPARCL1 (SCs) and MYO7A (HCs). Inset shows expression of Sparcl1 mainly in S6 and S7.
(C) Volcano plot displays differentially expressed genes in SCs (purple) and HCs (green). The top three to four most differentially expressed genes are labeled along with the validated genes (red). The number of genes above the threshold are indicated (log2 fold change [LFC] > 2 and FDR < 1%).
(D) In situ hybridization showing Slc22a3 mRNA expression in SPARCL1+ SCs, and not in HCs (striola shown). Inset shows Slc22a3 expression in S6 and S7.
(E) High-magnification image from the extrastriola, showing Nptx1 mRNAs in SPARCL1+ SCs and not MYO7A+ HCs. SWNE inset shows Nptx1 expression in SCs.
(F) Immunostaining showing RLBP1 labeling in SCs (HC nuclei level). A single type I HC nucleus was SOX2-negative (arrowhead). SWNE inset shows high expression of Rlbp1 in S6 and S7 cells.
(G) SWNE plot highlighting the spatial relationships between cells in S6 (striolar) and S7 (extrastriolar) states. The number of cells is in parentheses.
(H) Low-magnification image showing TECTB (green) immunolabeling localized to the striola. Inset shows SWNE plot of S6 and S7 with Tectb expression localized to S6 only. Boxed region at high magnification demonstrating co-localization of SPARCL1 with TECTB in SCs and not phalloidin-labeled HCs.
(I) Volcano plot with differentially expressed genes between striolar (S6) and extrastriolar (S7) SCs. Tectb (upper left corner) has a LFC of 10.5. The total number of genes above threshold (LFC > 2 and FDR < 1%) is indicated. Table S7 lists all genes above threshold.
(J) Tiled images of whole mount showing robust Dkk3 mRNA expression in the extrastriola relative to the striola. Inset shows higher Dkk3 expression in extrastriolar cells.
(J′ and J″) High-magnification images showing that more Dkk3 transcripts localized to SPARCL1+ SCs in the extrastriolar than striolar regions.
Log2 expression shown in SWNE plots range from white (absent), to yellow (low), to red (highest); maximum values are (B) 12.5, (D) 7.5, (E) 12, (F) 9, (H) 10, (J) 9. Scale bars, 100 μm in low-magnification image of (B), (H), and (J), and 10 μm in high-magnification images of (B), (D)–(F), (H), (J′), and (J″). See also Figure S6 and Tables S6 and S7.
Supporting cells displayed less diversity than hair cells. They are spatially segregated into striolar and extrastriolar subgroups, with TECTB marking striolar supporting cells (S6) (Figures 3G and 3H; Table S7) (Killick et al., 1995; Rau et al., 1999). We identified 21 genes specific to striolar supporting cells and 27 genes enriched in extrastriolar supporting cells using a differential expression threshold of 4-fold difference (Figure 3I). When we reduced the fold change threshold to 1-fold difference, we identified 1,387 genes specific to the striolar supporting cells and 890 genes specific to the extrastriolar supporting cells at a false discovery rate (FDR) threshold of 0.01 (Table S7). Comparison of striolar (S6) and extrastriolar (S7) cell states revealed Tectb as a highly specific S6 marker, and the Wnt inhibitor Dickkopf-3 (Dkk3) was highly expressed in S7 (Figures 3I and S6D). We confirmed robust Dkk3 mRNA expression in the extrastriolar region of the P6 utricle and markedly lower levels in the striolar region (Figures 3J and S6D). Our data also show expression of Cyp26b1 in the striolar supporting cells (S6) and Aldh1a3 in the extrastriolar supporting cells (S7) (Figure 3I; Table S7), consistent with their recently reported expression patterns (Ono et al., 2020). These data validate S6 and S7 as spatially distinct supporting cell subtypes marked by unique transcriptomes.
Transcriptional heterogeneity of transitional epithelial cells
The transitional epithelium is a rim of non-sensory cells surrounding the sensory epithelium and is thought to contain a homogeneous group of cells (Burns et al., 2015). Our analysis revealed five cell states of transitional epithelium that have expression profiles that more closely resembled supporting cells than hair cells (S9–S13) (Figures 4A–4C). Direct comparison of these five cell states with hair cells or supporting cells revealed unique sets of genes (Figures 4B and 4C): there are 800 genes expressed 4-fold higher in hair cells compared to 518 genes that are enriched in transitional epithelial cells (Figure 4B; Table S8). In contrast, comparison of supporting cells to transitional epithelial cells showed 127 and 143 enriched genes in each group, respectively (Figure 4C; Table S9). Additional comparison of transitional epithelial cells to combined supporting cells and hair cells revealed 321 and 402 differentially expressed genes, respectively (Figures S7A and S7B; Table S10). A spectral clustering dendrogram based on post hoc differential gene expression confirms that transitional epithelial cells and supporting cells together diverge in the first branch point away from hair cells (Figure S7C). These comparisons support the conclusion that the transitional epithelial cells, although transcriptionally distinct, are more closely related to supporting cells than hair cells.
Figure 4. Distinct subtypes of TECs in the mouse utricle.
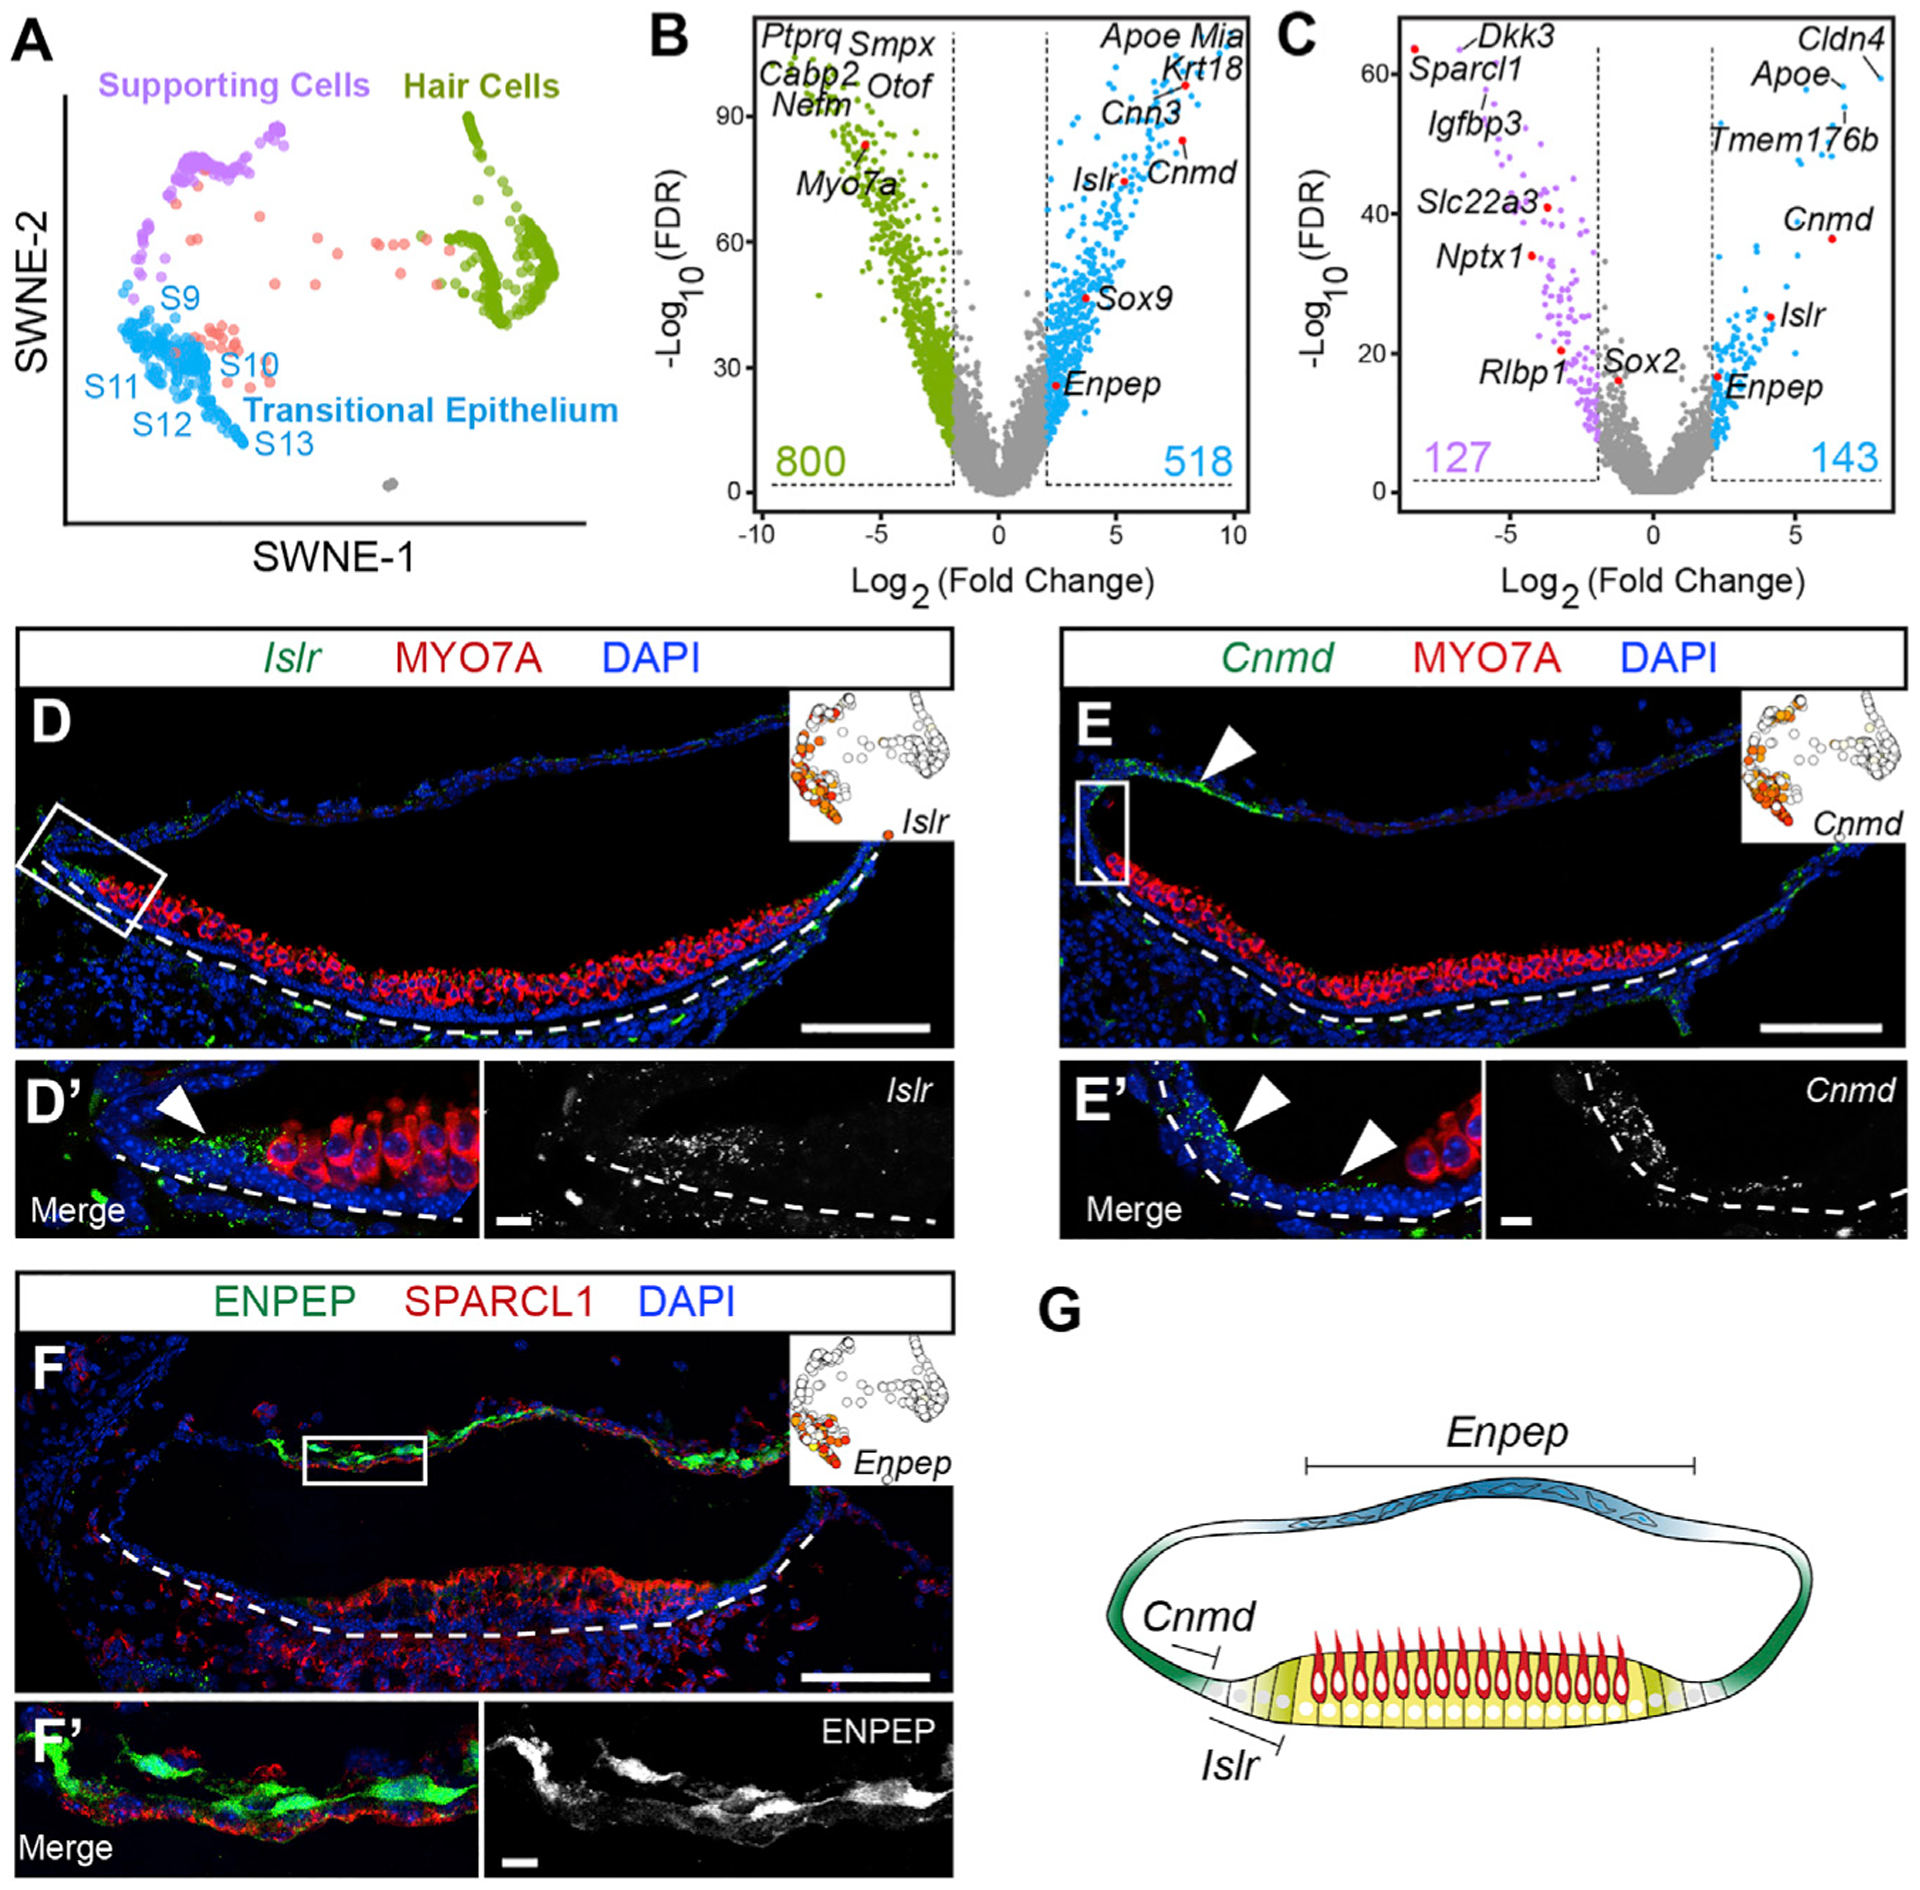
(A) SWNE plot showing five states of TECs (S9–S13, blue) distinct from SCs (S6 and S7, purple) and HCs (S1–S5, green).
(B and C) Differential gene expression volcano plots showing significantly enriched genes between HCs (green) and TECs (blue) (B) and between SCs (purple) and TECs (blue) (C). The top three to five differentially expressed genes in each group and validated genes (in red) are shown. Total genes detected with LFC > 2 and FDR < 1% are indicated. Tables S8 and S9 list all genes in (B) and (C). Expression of three genes was validated in (D)–(F).
(D) In situ hybridization on utricle section showing Islr mRNA expression primarily in the TECs immediately outside the MYO7A+ sensory epithelium. Inset shows scattered lslr expression in cells from S9–S13. Islr mRNA was also detected in mesenchymal cells outside the sensory epithelium. (D′) High-magnification image showing Islr mRNA in TECs.
(E) Cnmd mRNA expression in TECs distant from the sensory epithelium with some overlap with the Islr+ region. Cnmd mRNA expression extends into the roof. Inset highlights expression of Cnmd in S9–S13 cells.
(E′) High-magnification images show expression of Cnmd mRNA in cells more distant from the sensory epithelium.
(F) Immunolabeling of ENPEP of a utricle section shows localization primarily in the epithelial roof. Inset shows Enpep expression scattered among the TEC states with the highest level in S13.
(F′) High-magnification image of the roof region shows ENPEP+ cells. Enpephigh/Cnmdlow and Enephigh/Islrlow cells were removed for further analysis. Re-clustering of TEC shows four groups of cells (Figures S7E and S7F; Table S11).
(G) Cartoon model of expression patterns: Islr+ cells directly adjacent to the sensory epithelium, Cnmd+ cells extending farther out in the periphery, and the epithelial roof marked by Enpep.
Log2 expression levels shown in SWNE plots range from white (absent), to yellow (low), to red (highest); maximum values are (D) 10, (E) 15, and (F) 10. Scale bars, 100 μm in low-magnification images of (D)–(F), and 10 μm in (D′)-(F′). See also Figure S7 and Tables S8, S9, S10, and S11.
We validated three genes enriched in the transitional epithelium: Islr, Cnmd, and Enpep. Islr mRNA marked three to four rows of transitional epithelial cells abutting the MYO7A+ sensory epithelium of the P6 utricle (Figure 4D). In contrast, Cnmd expression was less restricted, marking part of these three to four rows of lslr+ transitional cells and also more peripheral transitional epithelial cells and epithelial cells in the roof region (Figure 4E). Immunolabeling showed that ENPEP exclusively marks the epithelial roof of the utricle (Figures 4F and S7D). To focus our analysis on the transitional epithelial cells and exclude any potentially contaminating Enpep+ epithelial roof cells, we filtered the cells by excluding both Enpephigh/Cnmdlow cells and Enpephigh/Islrlow cells (Figure S7E). Unbiased reclustering following this subtractive approach resulted in four groups of transitional epithelial cells (S9–S12). Differential gene expression of these four subgroups of transitional epithelial cells reveals distinct marker genes (Figure S7F; Table S11). Our interpretation of both the distinct marker expression and in situ hybridization data in the transitional epithelium outside the sensory epithelium, which is marked by MYO7A and SPARCL1, is that two zones exist: Islr marks the three to four cell rows directly adjacent to the sensory epithelium, and Cnmd marks these same cells at a lower level and cells farther into the periphery that connect with the epithelial roof (Figures 4G and S7E).
Transitional epithelial cells are candidate precursors of supporting cells
To determine how the defined cell clusters relate to one another, we performed trajectory analysis using CellTrails (Ellwanger et al., 2018). CellTrails placed hair cells, supporting cells, and transitional epithelial cells into an ordered furcating trajectory tree (Figures 5A, S8A, and S8B). The trajectory tree, which maps continuous variables onto discrete ones, is similar in topography to the SWNE plot (compare Figure 5A with Figure S8A). The trajectory highlighted two key features: (1) supporting cells (S6 and S7) are connected to hair cells (S1–S5) via a hair cell precursor state (S8), and (2) transitional epithelial cells (S9–S12) have a common lineage that involves a subgroup of the supporting cell state (S7) prior to its progression to hair cell precursors (S8) and subsequently hair cells. The validated transitional epithelial genes, Islr and Cnmd, were concentrated in different limbs of the trajectory tree, consistent with distinct observed cell populations (Figures 5B and 5C). Analysis of ratios of cells from different time points (P2, P4, and P6) showed the asynchronous nature of the developing utricle (Figure S8C), whereby cells from P4 contain mature cell types at lower ratios and P6 harboring more mature cells states. Specifically, S11, S9, and S7 are significantly enriched for P4 cells, and S1 and S2 are significantly enriched for P6 cells (Figure S8C).
Figure 5. Trajectory analysis of the expanding sensory epithelium.
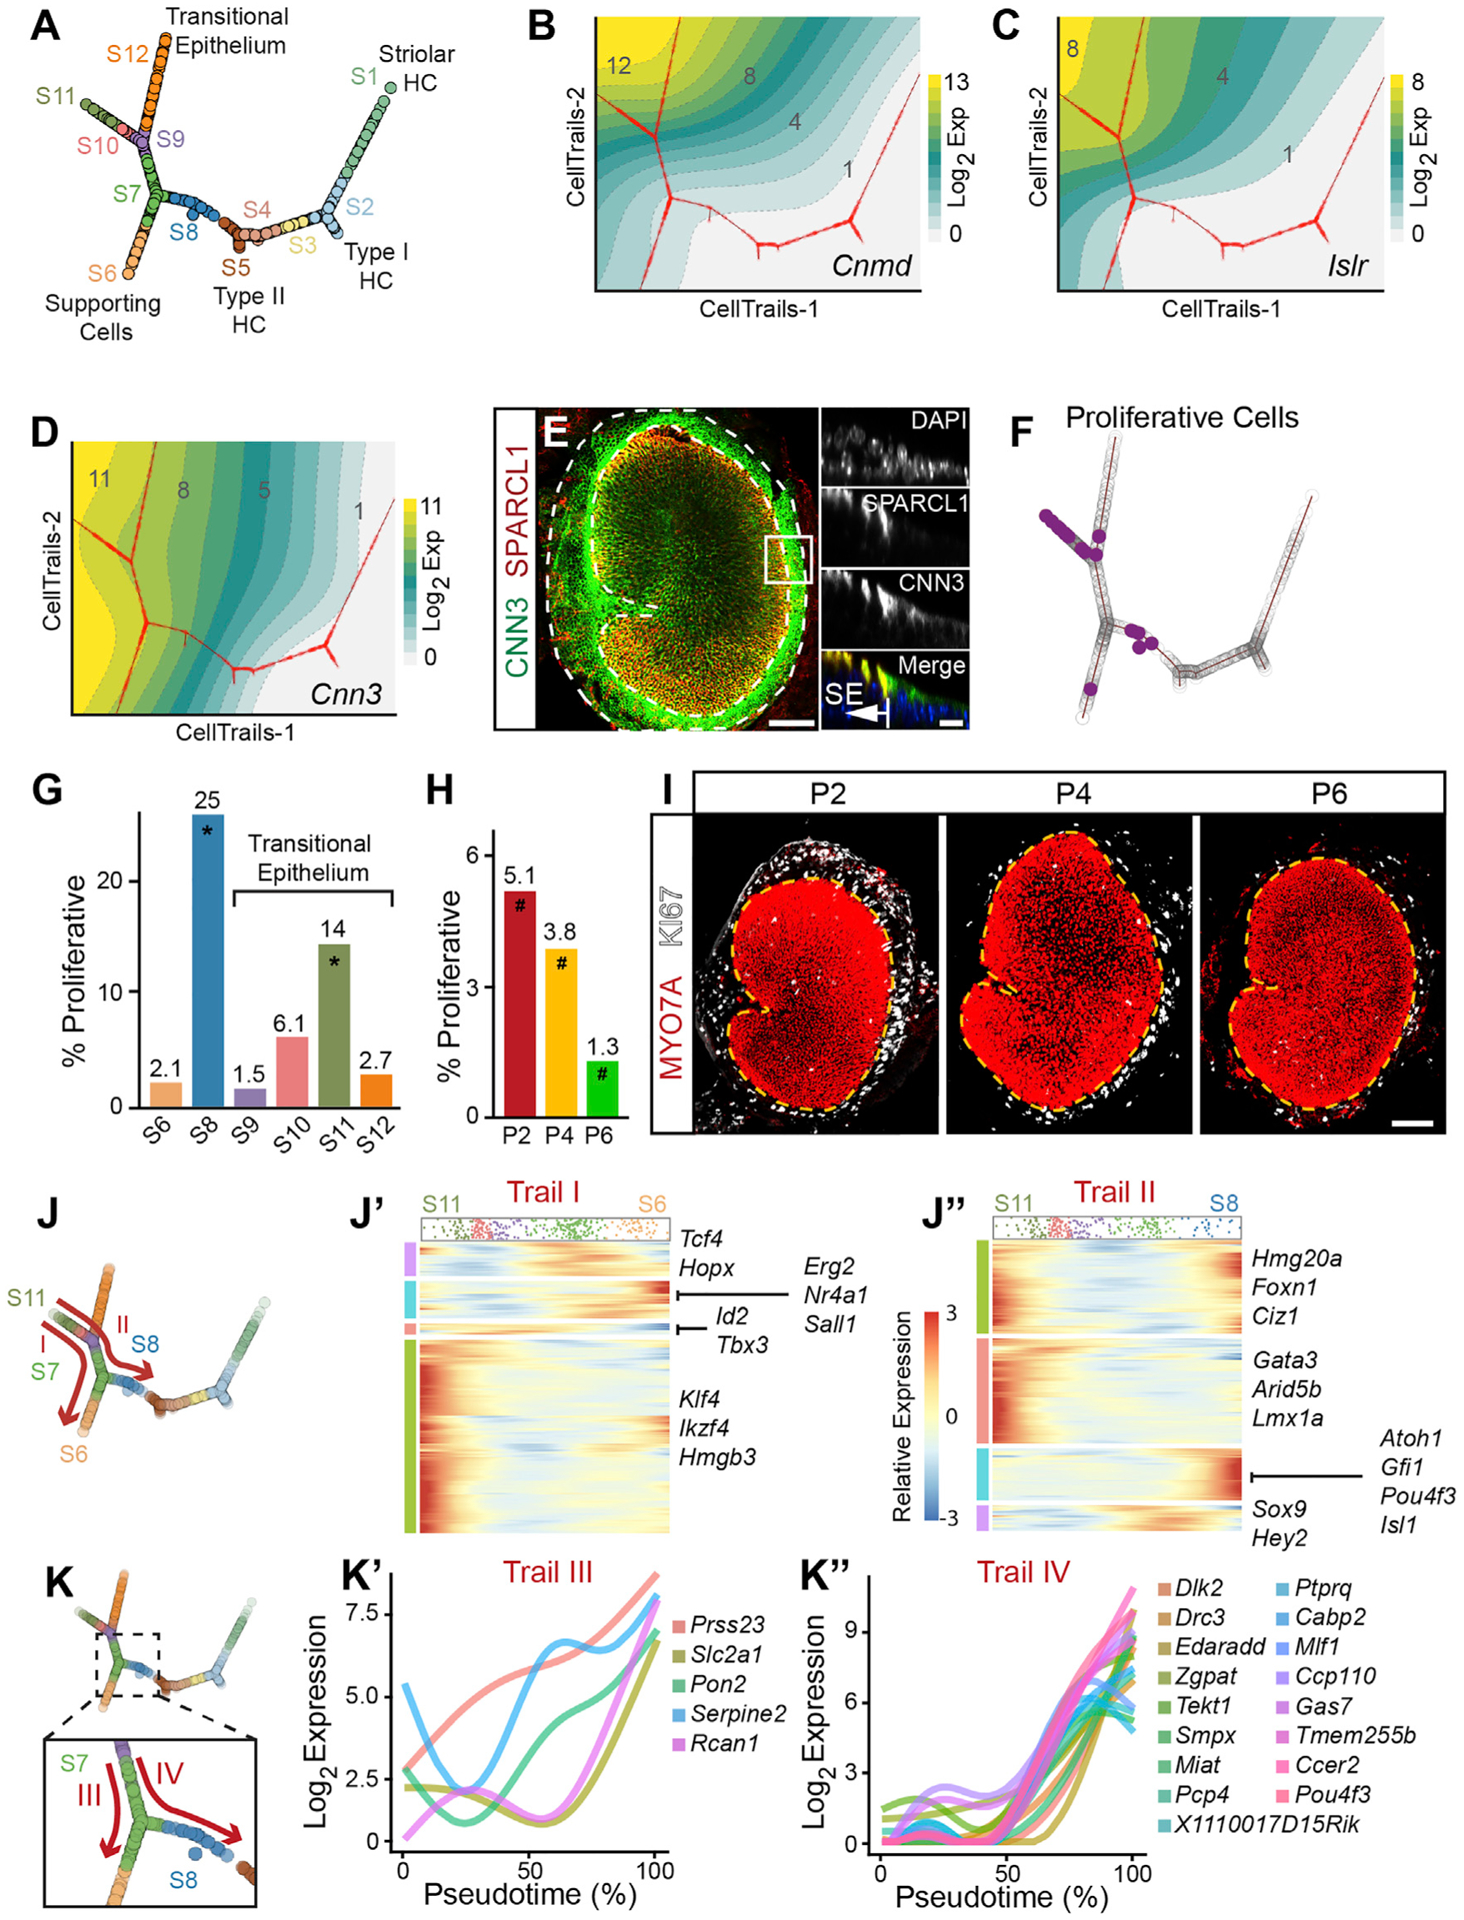
(A) Inferred branching trajectory graph with 12 states ordered by pseudotime. Cell distances along the trajectory correspond to differences in pseudotime. Enpep+ cells and mesenchymal cells were excluded (Figure S7). The corresponding cell states from S1–S12 are indicated along with the validated cell types.
(B and C) CellTrails topographical plot showing the trajectory tree (red line) and gene expression as a fitted smooth surface (yellow indicating the highest and gray the lowest log2 expression). Two limbs of the transitional epithelium were based on Cnmd and Islr.
(D) Topographical trajectory plot showing Cnn3 expression in both SCs and TECs.
(E) Whole-mount immunolabeling shows CNN3 expression in both the TECs and the SCs. Right insets show orthogonal views, displaying the border of SPARCL1+ SCs, and CNN3 labeling, which continues into the TECs.
(F) Trajectory tree highlighting 20 cells predicted to be proliferative (purple) based on gene expression.
(G) Bar graph showing the percentage of proliferative cells in cell groups (one or more proliferative cells). The Islr+ (S11) group and the HC precursor group (S8) are both significantly enriched in proliferative cells (Fisher’s exact test for enrichment, *p < 0.001).
(H) Percentage of proliferative cells significantly decreases with increasing postnatal ages (#p < 0.05).
(I) Immunolabeling of whole-mount utricles with KI67 (white) and MYO7A (red) Ki67+ cells (white) are concentrated along the lateral extrastriolar region and transitional epithelium of P2–P6 utricles.
(J) Gene expression dynamics heatmap along two trails with only transcription factors (TFs) shown (J′ and J″). The cell density of this trail is represented at the top of the heatmap. Trail I starts at S11 with Islr+ cells and ends at the terminal branch of the SCs (S6); trail II starts at S11 and terminates at the last HC precursor cell of S8. Trail I heatmap (J′) demonstrates 247 TFs in four clusters that are dynamically changing. Some genes were transiently expressed early (e.g., Id2 and Tbx3), while others peak transiently later (e.g., Tcf4 and Hopx). Two other gene clusters show TFs that are downregulated (e.g., Klf4 and Hmgb3) or upregulated (e.g., Erg2 and Nr4a). Trail II heatmap (J″) demonstrates four clusters of gene expression patterns with a total of 245 TFs. Some TFs are downregulated (e.g., Gata3 and Lmx1a), upregulated (e.g., Atoh1 and Isl1), and transiently expressed (e.g., Sox9 and Hey2). The fourth group contains TFs that are transiently downregulated (e.g., Ciz1 and Foxn1). All detected TFs from trails I and II are provided in Table S13. Dynamics of all genes above threshold are shown in Figure S8I and Table S12.
(K) Sub-trail comparison in the S7 extrastriolar cells demonstrating dynamically different genes along trail III, which terminates at an extrastriolar SC point, and trail IV, which terminates at the last HC precursor cell (S8). The red arrows of the trails indicate start and stop points along pseudotime. This comparison identifies dynamically changing genes along the branchpoint toward a SC or a HC (K subset). 5 and 17 genes show differential expression along trail III and trail IV, respectively (K′ and K″).
Scale bars, 100 μm in low-magnification image of (E) and in (I), 10 μm in high-magnification images of (E). See also Figure S8 and Tables S12 and S13.
To demonstrate shared gene expression between transitional epithelial cells and supporting cells, we validated two marker genes, Cnn3 and Sox9. Calponin-3 (CNN3) is an actin filament-binding protein that labeled both the transitional epithelial cells and supporting cells (Figures 5D–5E). As previously reported at embryonic stages, SOX9 was expressed in supporting cells, transitional epithelial cells, and in the epithelial roof in the P6 utricle (Figures S8D–S8F) (Mak et al., 2009; Stone et al., 2018).
Fate mapping experiments suggest two potential sources of hair cell addition to the postnatal sensory epithelium: supporting cells or a hitherto undiscovered cell population (Burns et al., 2012a). Our single-cell transcriptomic data suggest that transitional epithelial cells may directly differentiate into supporting cells, specifically, extrastriolar supporting cells (S7). In order for transitional epithelial cells to differentiate into hair cells, our computational model predicts they first pass through the S7 supporting cell state followed by differentiation via a hair cell precursor state (S8) (Figure 5A).
Using 5-ethynyl-2′-deoxyuridine (EdU) pulse experiments, prior studies have found that proliferative transitional epithelial cells may contribute to cells at the periphery of the utricular sensory epithelium (Burns et al., 2012b; Gnedeva et al., 2017; Gnedeva and Hudspeth, 2015). Our trajectory analysis showed that transitional epithelial cells may convert into supporting cells. To verify this trajectory, we computationally identified 20 proliferating cells within our dataset (Tirosh et al., 2016) (Figures 5F, S8G, and S8H). These proliferative cells were found to be significantly enriched within the Islr+ limb of the trajectory tree (S11) and within the hair cell precursor group (S8) (Figure 5G). This is consistent with the idea that transitional epithelial cells undergo mitosis and contribute to the supporting cells in the sensory epithelium (S10 → S9 → S7), and that some supporting cells subsequently convert into the hair cell precursor state (S8) before becoming hair cells. As a control, our computational analysis showed gradually decreasing ratios of proliferating cells from P2 to P6, corroborating declining Ki67-marked cells from P2 to P6 utricles (Figures 5H and 5I) (Burns et al., 2012b; Gnedeva et al., 2017; Gnedeva and Hudspeth, 2015).
To extract gene expression dynamics of the transitional epithelial cells along the trajectory toward supporting cells and hair cells, we focused our analysis on two trails. We designated Islr+ cells as the origin cell pool (S11), as they were the most proliferative population of the transitional epithelium (Figures 5F and 5G). We specifically focused on genes that changed along the trajectory toward supporting cells (trail I: S11 → S10 → S9 → S7 → S6) (Figure 5J). Generalized additive models of gene expression were fitted as a function of pseudotime using CellTrails. This allowed us to systematically define genes that are changing along a specific trail, in this case from Islr+ transitional cells toward supporting cells. We identified 3,788 genes changing along this trail (Figures 5J, trail I, and S8I, trail I; Table S12). k-means clustering of gene expression patterns revealed 10 gene groups, where some were being turned off (e.g., Ccnd2, Fbxo9), others transiently expressed (e.g., Sox9), and additional ones increasing at varying time points (e.g., S100a6, Slc2a3). Focusing on transcription factors within this group, we identified four clusters of gene expression patterns that contain 247 transcription factors (Figure 5J′, trail I; Table S13). These contain genes such as Id2 and Tbx3 that display early transient expression, while others such as Tcf4 are expressed at subsequent pseudotime intervals (Figure 5J′, trail I ). These results highlight dynamic gene expression along the trajectory from transitional epithelial cells to supporting cells.
Trajectory analysis from the Islr+ S11 cells toward nascent hair cells (trail II: S11 → S10 → S9 → S7 → S8) identified 4,310 genes that are dynamically expressed (Figures 5J″, trail II, and S8I′, trail II; Table S12). These genes were clustered into six expression patterns (Figure S8I′). From this group, there were 245 transcription factors identified as dynamically expressed (Figure 5J″; Table S13). These included transcription factors that are downregulated (e.g., Gata3, Arid5b, Lmx1a), ones that are transiently expressed during supporting cell states (e.g., Sox9, Hey2), and others that are turned on during the hair cell precursor state (S8) (e.g., Atoh1, Pou4f3, Gfi1, Isl1) (Figure 5J″; Table S13).
To identify differentially expressed genes along the bifurcation toward either hair cell precursors or striolar supporting cells, we performed detailed sub-trail analysis focused on the extrastriolar supporting cells (Figure 5K, trails III and IV). We specifically asked how the gene expression dynamics are different between these two sub-trails. Five genes (Prss23, Slc2a1, Pon2, Serpine2, and Rcan1) were upregulated in extrastriolar supporting cells (S7) as they progress along pseudotime into more mature extrastriolar supporting cells, and the expression levels of 17 genes were increased as extrastriolar supporting cells (S7) transition through the hair cell precursor state (S8). These data indicate that different gene dynamics may be at play between these two cell fates within the supporting cells. Our trajectory model predicts that proliferating Islr+ transitional epithelial cells can contribute to the expansion of the sensory epithelium.
Trajectory of early hair cell development
To extract gene expression dynamics underlying the generation of hair cells, we focused on the sub-trail starting from the extrastriolar supporting cell branchpoint toward nascent hair cells (S7 → S8 → S5) (Figure 6A). We identified 1,075 genes that segregated into five clusters of expression patterns (Figure 6B; Table S14). Biological processes found enriched by analyses using g:Profiler include those involved in calcium ion binding, nuclear transport, synapse formation, hair cell differentiation, and cilium organization (Figure 6B). We then filtered this gene list to identify 51 transcriptions factors that are dynamically changing over this sub-trail (Figure 6C; Table S14). These transcription factors fell into three separate groups: ones that are upregulated, ones that are transiently expressed, and ones that are downregulated (Figure 6C). Known hair cell transcription factors, such as Atoh1 and Pou4f3, are upregulated. The transcription factor Casz1 is upregulated as Sox2+ supporting cells transition into hair cells (Figure 6C′). The five transcription factors that are transiently expressed are involved in cortisol synthesis (Elf3, Hivep2, Atf2, Tfdp1, and Pbx1). There are eight transcription factors related to notch signaling that are downregulated as supporting cells transition to nascent hair cells. Taken together, this sub-trail reveals dynamic changes in transcriptomes as a hair cell fate is specified among supporting cells.
Figure 6. HC precursors and differentiation trajectory analysis.
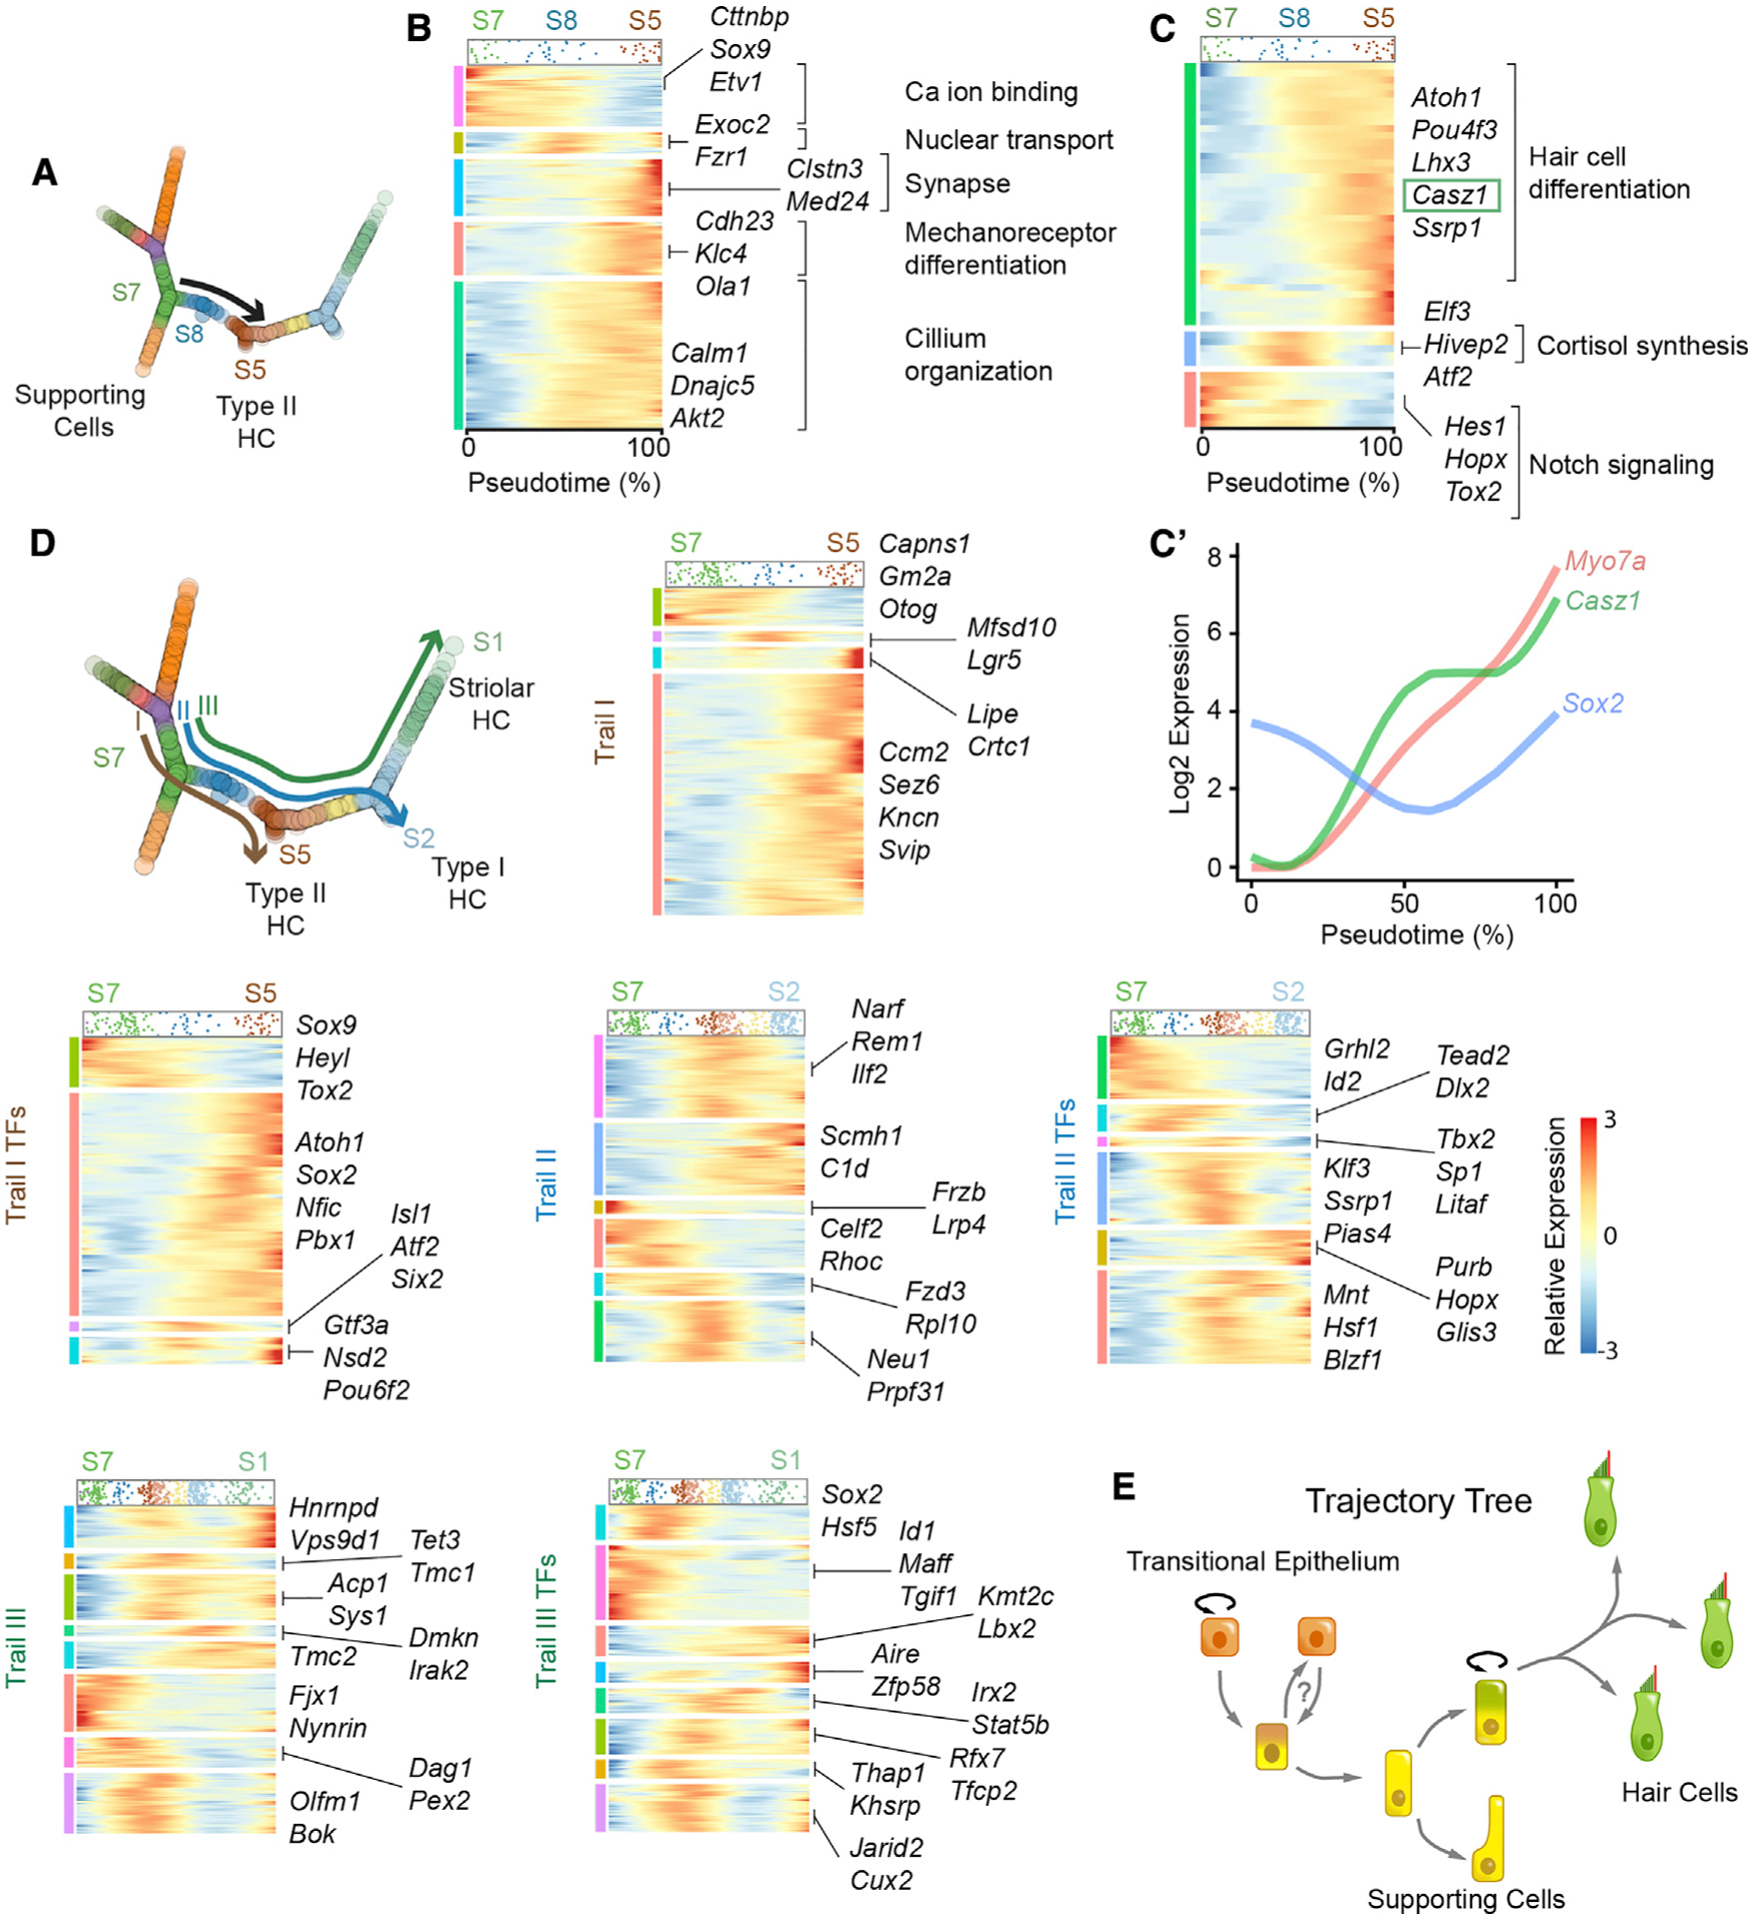
(A) Trail (black arrow) from the bifurcation of extrastriolar SCs (S7) that traverse the HC precursor state (S8) to a nascent HC before branching into HC subtypes.
(B) Dynamic gene expression along the defined trail in (A) reveals five different clusters of gene expression patterns with a total of 1,075 genes. The cell density of this trail is represented at the top of the heatmap. Gene clusters were associated with Gene Ontology (GO) terms, including cilium organization genes (e.g., Calm1, Dnajc5, Akt2) and synapse genes (e.g., Clstn3 and Med24).
(C) Heatmap showing only TFs from (B) with a total of 51 genes detected. These genes fall into three categories: downregulated, transiently expressed, and upregulated. GO term analysis using g:Profiler reveals that HC differentiation TFs are upregulated, which include Atoh1 and Pou4f3. This group also includes markers such as Casz1 and Ssrp1. The downregulated TFs (e.g., Hes1, Hopx, and Tox2) include those related to Notch signaling, and transiently expressed TFs (e.g., Atf2, Elf3, and Hivep2) are involved in cortisol synthesis. Full gene listings are in Table S14.
(C′) Expression dynamics of the TF, Casz1, Sox2, a marker of SCs and type II HCs, and Myo7a. Sox2 remains continuously expressed during this defined period with a transient decline in expression while both Myo7a and Casz1 are monotonically upregulated.
(D) Association test along trails I–III yielded gene dynamics. All three trails start from SC (S7) and traverse through the HC precursor state (S8). Trail I terminates at the end of the type II HC branch, trail II terminates at the end of the type I HC branch, and trail III terminates at the end of the striolar HC branch. Trail I harbors 3,730 genes that are dynamically expressed in four patterns, including downregulated (e.g., Otog and Gm2a), transiently expressed (e.g., Mfsd10 and Lgr5), and upregulated ones (largest). 215 TFs are dynamically changing in four patterns. TFs upregulated include Atoh1 and Nfic. Trail II shows 6,890 genes dynamically expressed in six clusters. This group also includes 398 TFs that are shown in a separate heatmap. Three clusters of genes are downregulated (e.g., Frzb and Lrp4) in sequential fashion, while another two are upregulated (e.g., C1d and Rem1). One larger cluster of genes shows transiently expressed genes (e.g., Neu1 and Prpf31). Trail III contains eight different clusters of 7,258 dynamically expressed genes, of which 433 are TFs. In addition to the three expression patterns (downregulated, transiently expressed, and upregulated), two groups transiently decrease before being turned on again (e.g., Hnrnpd and Olfm1). Sox2 and Hsf5 are downregulated, while Kmt2c and Lbx2 are upregulated early in pseudotime and remain elevated to the end of the trail. Gene lists for all heatmaps are in Table S15.
(E) Model of TEC trajectory and cell fates. Relative expression scale for all pseudotime plots in this figure is shown in (D). See also Figure S9 and Tables S14 and S15.
Divergence of hair cell fates
CellTrails unveiled five transcriptionally distinct groups of hair cells (S1–S5) that were determined to represent type I and type II hair cells from the striolar (S1) and extrastriolar regions (S2–S5) (Figure 2). The trajectory tree delineated close relationships among these five cell states (Figure 5A). Striolar hair cells were primarily type I, and though a small number of cells lacked Spp1 expression, these were not enough to separate out on the trajectory. Extrastriolar cells had small terminal branches for both type I (S2) and type II hair cells (S5), as well as intermediate states (S3 and S4). We chose to investigate three trails (Figure 6D). All trails begin at the earliest detected supporting cells in pseudotime (S7), pass through the hair cell precursor state (S8), and branch into the three terminal branches (S5, S2, and S1) representing type II, type I, and striolar hair cells, respectively (Figure 6D).
We quantified the association between gene expression changes and pseudotime along these three trails (Figure 6D). Transcription factor gene dynamics were assessed separately for each of the three trails. In trail I (S7 → S8 → S5), we found 3,730 genes and 215 transcription factors that are significantly changing along this trajectory (FDR < 0.01) (Table S15). The hair cell transcription factor Atoh1 was upregulated in trail I as hair cells are formed. In trail II (S7 → S8 → S5 → S4 → S3 → S2), 6,890 genes and 398 transcription factors are dynamically expressed in six and four clusters, respectively. In trail III (S7 → S8 → S5 → S4 → S3 → S2 → S1), 7,258 genes and 433 transcription factors are dynamically changing with pseudotime. Transcription factors such as Rfx7 that regulates ciliogenesis in vertebrates and Znf521 that activates neural differentiation were transiently expressed in trail III (Kamiya et al., 2011; Manojlovic et al., 2014). The RFX family of transcriptions factors has been implicated as essential for hair cell development in the auditory system (Elkon et al., 2015).
Hair bundle growth and assembly is a key biological process during hair cell development and maturation. We therefore chose to analyze genes involved in different processes of hair cell formation as previously described in the embryonic chicken utricle using our trajectory map (Ellwanger et al., 2018). We focused on genes for hair bundle crosslinking, hair bundle lengthening and widening, calcium regulation, lipid transport and synthesis, bundle ankle links and tapering, and transduction (Figures S9A–S9F). To determine whether these biologically relevant processes were statistically significant, we performed an association test between the average gene expression and pseudotime trails (Figure S9G; Table S16). These data support the notion that our trajectory provides insight into the developmental dynamics of hair bundle development and maturation. We observed that lengthening and widening occur early along the hair cell trails at S5 and S4, indicative of less mature states (Figure S9C), while calcium regulation was a hallmark of the striolar region as marked by expression of Calb2, Ocm, and Atp2b2 (Figures S9B and S9G). In sum, we define the gene dynamics associated with the specification and maturation of hair cell subtypes from both the striolar and extrastriolar regions.
DISCUSSION
By focusing our investigation on the neonatal utricle, which undergoes dynamic growth and differentiation in the early postnatal period, our study dissects the transcriptional profiles of different sensory and non-sensory cell types as well as modeling their lineage relationships. We extend on previous findings on the transcriptome of 158 single cells from the P1 utricle, and provide a dataset with 861 high-quality cells over three time points, identification of genes not previously reported within the inner ear, and a reconstructed trajectory of the process of postnatal hair cell and supporting cell specification and maturation (Burns et al., 2015). Data from the three time points argues for an asynchronously developing organ whereby at each time point there are cells at different stages of maturity.
The robustness of this dataset is also illustrated by a series of validated genes not previously described or reported on in the inner ear from hair cells and supporting cells (Figures 2 and 3). We validated hair cell genes (Apba1, Hsd17b7, Ttll3) that are known in other cell types to mediate synaptic activity, cholesterol biosynthesis, and microtubule assembly. Similarly, the supporting cell markers validated (Slc22a3, Nptx1, Rlbp1) implicate the potential role of supporting cells in governing synaptic function and immune responses in the developing utricle. It would be of interest to further characterize the functional significance of these genes in future studies.
Spatially, the hair cell and supporting cell states segregate into the known anatomical divisions of the utricle: striolar (central) and extrastriolar (peripheral) regions. Heterogeneity of hair cells in the neonatal utricle has been previously observed based on morphology, innervation patterns, and electrophysiology (Rüsch et al., 1998). Consistent with these observations, our data delineate five distinct expression profiles of hair cells (Figure 2J). When we performed further subgroup analysis of these hair cell groups using defined criteria for variable gene selection, we identified eight hair cell subtypes (Figure S5C). We speculate that this molecular diversity of hair cells during early development may ultimately shed light on the potentially diverse properties of hair cells not simply accounted for by type I and type II hair cell subtypes and their striolar and extrastriolar regions (Eatock and Songer, 2011). Moreover, type I hair cells can be further divided into those with and without calyceal innervation (Rüsch et al., 1998). Such heterogeneity may inform hair cell subtypes categorized by different degrees of maturity and/or innervation patterns, which could be examined in detail in future studies. Intriguingly, such diversity is not observed in the supporting cells, which showed two transcriptionally distinct clusters following spatial patterns. This is unexpected as supporting cells have been described to perform a diverse array of functions, which may be more prevalent in diseased states such as after ototoxic damage (Monzack and Cunningham, 2013; Wan et al., 2013).
In the murine utricle, the sensory epithelium expands postnatally from P0 to P8 with ~50% more hair cells added during this period, with lineage tracing and thymidine analog pulse experiments indicating that hair cells are added at the periphery of the sensory epithelium (Burns et al., 2012b; Gnedeva et al., 2017; Gnedeva and Hudspeth, 2015). Our results suggest stepwise differentiation where transitional epithelial cells transit through an intermediate supporting cell state before acquiring a hair cell or more differentiated supporting cell fate. Consistent with this trajectory prediction, we observed closer similarity in gene expression between the transitional epithelium and supporting cells rather than to hair cells. Moreover, we identified marker genes shared between transitional epithelium and supporting cell groups, including Sox9 and Cnn3. Based on biophysical models showing that elastic force restricts growth of the neonatal mouse utricle, investigators have shown that postnatal growth of the rodent sensory epithelium occurs primarily at the periphery (Gnedeva et al., 2017; Gnedeva and Hudspeth, 2015). In non-mammalian vertebrates, such as sharks, it has been suggested that there are “growth zones” along the periphery (Corwin, 1981). Corwin (1981) demonstrated that the sensory epithelium in utricles of the juvenile shark continues to expand through adulthood, adding up to 80% more hair cells throughout life. In contrast, in avian species such as the chick, there is continuous interstitial cell turnover and addition of hair cells throughout the utricular sensory epithelium (Goodyear et al., 1999; Scheibinger et al., 2018).
The transitional epithelium is a poorly characterized group of non-sensory epithelial cells that surround the sensory epithelium proper. Prior work predicted a homogeneous group of transitional epithelial cells that may either directly contribute to a hair cell or supporting cell fate (Burns et al., 2015). We expanded on these observations by showing four distinct groups of transitional epithelial cells (Figure S7F). Validation of Islr and Cnmd (Figures 4D and 4E) revealed two zones in the transitional epithelium: cells directly adjacent to the sensory epithelium as marked by Islr, and cells overlapping with Islr extending farther out in the periphery marked by Cnmd. Single-cell transcriptomics data and trajectory analysis support a model where lslr+ transitional epithelial cells contribute to the expansion of the sensory epithelium. Unlike the previously proposed trajectory, our data show that Islr+ transitional epithelial cells proliferate and pass through a supporting cell state, which in turn undergoes a bifurcating cell fate decision into either a more mature supporting cell state or to a hair cell precursor state (Figure 6E) (Burns et al., 2015). This stepwise conversion is supported by the finding of a high proportion of proliferative cells between the Islr+ cell state (S11) and the hair cell precursor cell state (S8) (Figures 5F and 5G). One interpretation is that supporting cells are added to the expanding sensory epithelium by transitional epithelial cells, whose proliferation declines as organ growth slows down. Second, a supporting cell can either remain a supporting cell or it can divide once again to give rise to a hair cell precursor (Figure 5). This level of plasticity may allow the expanding utricle to adjust the supporting cells-to-hair cells ratio such that hair cells remain separated from one another. We postulate that this transitional epithelial region serves as a temporary stem cell niche and reservoir of cells for the expanding sensory epithelium. Our trajectory model further supports the notion of a cell state that is more roof cell like (S9, Figure 5A), leading us to speculate that the S11 Islr+ cells are bipotent progenitors that contribute to both the sensory epithelium and the epithelial roof. However, we note that scRNA-seq expression data are not a substitute for fate mapping experiments that would more definitively validate conversion of transitional epithelial cells to supporting cells.
Generation of hair cells requires a reservoir of supporting cells that are competent to become hair cell precursors, which has been defined by known hair cell transcription factors including Atoh1 and Pou4f3 (Atkinson et al., 2018). By computationally modeling a continuum of cellular differentiation and by fitting expression signals along the inferred pseudotime axis, we have identified additional transcription factors that may be important for the generation of hair cells (Figures 6A–6C). For example, Casz1 displays similar temporal expression to Atoh1 and Pou4f3, and it is known to promote early retinal progenitors (Mattar et al., 2015). This example highlights the value of dynamic expression models enabling exploration of transcriptional changes while hair cells differentiate from supporting cells. Detection of transiently expressed transcription factors related to cortisol biosynthesis (Figure 6C) points to the cholesterol to cortisol mechanism of regulation. Lipid synthesis and regulation is a key component of cellular membranes that modulate ion channel activity and has been shown to play a role in outer hair cell motility within the cochlea (Thomas et al., 2014). The development of such mechanisms during hair cell generation is an important consideration that warrants further investigation.
The utricle harbors two types of hair cells, type I and type II, that are morphologically, physiologically, and molecularly distinct (Eatock et al., 1998; Rüsch et al., 1998). It has also been observed that maturity of hair cells throughout the epithelium varies using different parameters of electrophysiological properties and cellular properties such as hair bundle length (Li et al., 2008; Warchol et al., 2019). Trajectory analysis sheds light on the transcriptomic diversity of developing hair cells at different stages, beginning with supporting cells that transition into hair cell precursors (S8) and, ultimately, a nascent hair cell (S5) with features of type II hair cells. We identified dynamic molecular signatures of cells committed to one of three hair cell lineages: type II hair cells, type I hair cells, and striolar hair cells.
Our study demonstrates the transcriptional heterogeneity of the postnatal mouse utricular sensory epithelium, provides insights into the molecular trajectory of hair cell differentiation, and defines a model of how the transitional epithelial cells contribute to the sensory epithelium. Thus far, evidence suggests that maturation steps of postnatal regeneration of hair cells do not necessarily follow those of development (Wang et al., 2019). Therefore, this work defines gene expression at single-cell resolution in the utricle during the postnatal addition of supporting cells and hair cells, which will allow comparison with transcriptional profiles of regenerating cells. We further provide a data-rich transcriptional profile of the postnatal developing utricle as a resource for further exploration.
STAR★METHODS
RESOURCE AVAILABILITY
Lead contact
Further information and requests for resources and reagents should be directed to and will be fulfilled by the Lead Contact, Alan G. Cheng (aglcheng@stanford.edu).
Materials availability
This study did not generate new unique reagents.
Data and code availability
The raw sequencing data, including all FASTQ files, are deposited in the NCBI Gene Expression Omnibus (GEO: GSE155966). This further includes all metadata, unfiltered cells (n = 1,002 cells), processed read count data, and which cells passed our quality metrics and which ones did not. All cells prior to quality control (n = 1,002 cells) are also uploaded into gEAR (https://umgear.org/p?s=bfc9d6c9), which is a publicly available portal for visualization and analysis of multiomic data. Code used to generate figures and plots are from standard indicated R package manuals and are available upon request.
EXPERIMENTAL MODEL AND SUBJECT DETAILS
Wild-type FVB (Jackson Laboratory, #001800), Pou4f3DTR/+ (Jackson Laboratory, #028673) and Atoh1EGFP (Jackson Laboratory, #013593, known as Atoh1tm4.1Hzo) mice of both sexes were used. The Pou4f3DTR/+ transgene was not activated and therefore treated as wild-type. Mice of three ages were used for collection of transcriptomics data: P2, P4, and P6. All validation experiments were performed using P6 wild-type FVB specimens unless otherwise indicated. Mice were maintained in a controlled environment with 12 hour light-dark cycles under the care of the Stanford Veterinary Services Center with accreditation by AAALAC International. All protocols (#18606) were approved by the Institutional Animal Care and Use Committee of Stanford University.
METHOD DETAILS
Tissue preparation and cell isolation
Animals were sacrificed and the utricles were isolated using microdissection techniques in cold RNase-free Hank’s Balanced Salt Solution (HBSS) followed by transfer to Phosphate Buffered Saline. The epithelial roof was trimmed with a remnant left in place on the edges of the sensory epithelium. The whole utricle was then enzymatically digested using thermolysin (0.5 mg/mL; Sigma Aldrich, T7902) for 20 minutes at 37°C prior to mechanical peeling of the sensory epithelial layer. Pooled utricles were then digested using Accutase (Thermo Fisher Scientific, 00-4555-56) for 6 minutes at 37°C and single-cell suspension was obtained by trituration using a p1000 pipette and filtering through a 40 μm filter. DMEM/F12 media (Thermo Fisher Scientific/GIBCO, 11-039-021) was used for this step. Each dissection session utilized between 3–6 mice with 2–6 96-well plates of cells collected per session. In sum, cells from a total of 29 mice were used in this study.
Propidium iodide (PI, BD Biosciences, 556463) was added to the single-cell suspension just before fluorescent-activated cell sorting (FACS). Cells were kept ice-cold and sorted on a Sony SH800 flow cytometer at the Stanford Shared FACS Facility. Gating strategy included removal of debris based on forward and side scatter, followed by exclusion of doublets, and exclusion of nonviable cells that were PI-positive (Figure S1A). Cells were index sorted into pre-prepared 96-well dishes containing 0.5–4 μL of recombinant RNase inhibitor (RRI) (Clontech #2313B), 0.1% Triton X-100 (Thermo Fisher Scientific, PI85111), 2.5 mM dNTP (Thermo 10297018), and 2.5 uM oligodT30VN (IDT). Collection was performed in a 4°C chamber. Cells were then spun down using a swinging-bucket centrifuge briefly and immediately frozen at −80°C. On average, the process from sacrifice of animals to cell sorting took 2.5 hours.
Immunohistochemistry
Whole mount utricles were prepared using established protocols (Wang et al., 2015). Briefly, utricles were isolated in ice-cold HBSS, fixed for 40 minutes on ice with 4% paraformaldehyde (Electron Microscopy Sciences, 15710), then washed with PBS with 0.1% Triton X-100 three times for 10–15min each. Antigen blocking was performed using 5% donkey serum, 0.1% Triton X-100, 1% bovine serum albumin (BSA, Thermo Fisher Scientific, BP1600-100), and 0.02% sodium azide (NaN3, Sigma-Aldrich, S2002-25G) in PBS at pH 7.4 for 1 hour at room temperature followed by primary antibody incubation overnight at 4°C in the same solution. The next day, specimens were washed with PBS with 0.1% Triton X-100 three times at room temperature for 5 minutes each and incubated with secondary antibodies with DAPI for 2 hours at room temperature. Specimens were then washed with PBS three times for 5 minutes each and mounted in mounting media. For anti-HSD17B7 and anti-RLBP1 antibodies, antigen retrieval was performed using RNAscope antigen retrieval reagent for 7 minutes at 65°C after fixation and prior to the blocking step.
In situ hybridization
RNAscope (Advanced Cell Diagnostics) platform was used for validation of identified markers. For whole mount preparations, utricles were dissected in RNase-free PBS (Thermo Fisher Scientific, AM9624) and fixed at room temperature using fresh 4% paraformaldehyde for 2 hours. Utricles were then washed and stored overnight at 4°C. The next day, tissues were dehydrated using serial ethanol, followed by rehydration with water. Antigen retrieval was performed at 65°C followed by protease treatment for 20 minutes at room temperature. Probe hybridization was carried out for 2 hours at 40°C followed by serial amplification steps per manufacturer protocol. Both positive and negative control probes were used with every run. For cryosectioning, the protocol detailed in Jansson et al. was followed (Jansson et al., 2019). Briefly, otic capsules were isolated and fixed in 10% neutral buffered formalin overnight at 4°C followed the next day by washing in PBS and serial sucrose gradients in Tissue-Tek optimum cutting temperature (OCT) compound (Sakura). OCT embedded tissues were then frozen over dry ice and sectioned. Advanced Cell Diagnostics commercial protocol was followed for hybridization with fluorescent detection kit. For co-immunolabeling of tissues, whole mount or cryosections were washed with PBS following the last step of the RNAscope protocol, and incubated with primary antibody in PBS with 0.1% saponin (Sigma, 47036) overnight at 4°C. The next day tissues were labeled with secondary antibody as described above and mounted using Prolong Gold media (Thermo Fisher Scientific P36930). Imaging was carried out with positive and negative controls each time with identical laser power and gain using a Zeiss LSM 880 or LSM 700 microscope. Whole mount utricles were imaged using a 63x objective with tiling feature on an LSM 880 system and stitched using Zen Lite software. All image processing was performed in Fiji (NIH) and Adobe Photoshop 2020. Threshold levels of the probes were set to the positive and negative controls.
QUANTIFICATION AND STATISTICAL ANALYSIS
Library preparation and RNA quality control
Full-length RNA sequencing from single cells was carried out using the Smart-seq2 protocol at the Stanford Functional Genomics Facility (Picelli et al., 2014, 2013). Cells underwent reverse transcription using Smartscribe II or Maxima enzyme prior to 22 cycles of PCR amplification of cDNA. Purification of amplified cDNAs was performed with bead cleanup using a Biomek FX automated platform with 70% Beckman-Coulter AMPure beads. Aliquots were run on a Fragment Analyzer for quantification. Cells were considered of adequate quality if 0.05–0.15 ng/μl of cDNA was detected and at least 35% content within a target range of 400 base pairs (bp) to 4000 bp. All cells were spiked with ERCCs (Invitrogen, Cat no. 4456740) for a final dilution of 12×106. Nextera XT library prep kit with tagmentation was used. Individual single cell cDNA was normalized to the concentration of 150pg/μl with 0.4ul used (60pg cDNA per library prep). 86% of sorted cells met bioanalyzer criteria for inclusion. The remainder of the cells were deemed of inadequate quality and not included for sequencing. IDT-manufactured Illumina-compatible 384 UDI (unique dual indexes) were used for pooling libraries prior to sequencing.
Sequencing and alignment
Four to six 96-well plates were pooled as a single library and sequenced on a NextSeq 500 High Output flow cell. Paired end sequencing of 75–150 bp was performed at a depth of approximately 0.5–1 million reads per cell. Cells from 7 sequencing pools were utilized for this study. Following sequencing, cells were de-multiplexed. Forward and reverse reads from FASTQ files were aligned using STAR alignment package (v2.5.3a) using single-pass mode to the mouse genome (GRCm38 mm10) with GENCODE annotation release vM17 (Dobin et al., 2013). Sequencing quality was assessed using MultiQC package (Ewels et al., 2016). No sequence trimming was performed as this may introduce bias. Read quantification was carried out with RSEM (v1.3.0) to generate count matrices (Li and Dewey, 2011). Alignment and count matrix generation were performed on a local high-performance computing cluster (Sherlock) at the Stanford Functional Genomics Facility. Count matrix files were then loaded on a local desktop computer for downstream analysis using the R statistical computing environment (v3.6.1, https://www.r-project.org/).
Quality control
The scater package was used for gene level and cell level quality control (McCarthy et al., 2017). Count matrices from RSEM were imported into R. As a first step, ERCCs and all mitochondrial genes were removed. Mitochondrial genes were identified using two criteria: genes starting with ‘mt-’ and genes from the Broad Institute’s Mouse MitoCarta2.0 repository (Calvo et al., 2016, p. 20; Pagliarini et al., 2008). Next, using scater’s ‘isOutlier’ function for both read counts (library size) and detected features (genes), we excluded cells with a median absolute deviation of 3. We subsequently chose to only include genes that are expressed in at least 3 cells, leaving a total of 20,939 genes. The following additional metadata was used as part of scater’s ‘runPCA’ function to further identify outliers: sequencing pool, age, genotype, enzyme, and cell position within each 96-well plate (Figure S2). In total, 1,002 cells were sequenced. Following these computational quality control steps, we identified 861 high quality cells with a total of 20,939 detected features (genes). This was comprised of 76 P2 cells, 309 P4 cells, and 476 P6 cells.
Normalization
We chose to normalize our data using a scRNA-Seq specific method contained in the SCnorm package (v1.8.1, https://doi.org/10.18129/B9.bioc.SCnorm) (Bacher et al., 2017). This approach accounts for the unique nature of zero-inflated scRNA-Seq datasets. Each age (P2, P4, and P6) was treated as a separate ‘Condition’ within SCnorm generating count depth estimates and running the ‘SCnorm’ function with default parameter of FilterCellNum equal to 10. All three conditions normalized with a K between 3 to 11. Scaling was carried out on the three conditions with ‘useZerosToScale’ set to FALSE as all downstream analysis methods used scRNA-Seq specific statistical analyses. Further downstream analysis used log2-transformed normalized counts, including for M3Drop and SWNE generation.
Cell state identification
CellTrails package (v1.4.0, https://doi.org/10.18129/B9.bioc.CellTrails) was used for identification of cell states (clusters) (Ellwanger et al., 2018). CellTrails uses a spectral embedding and hierarchical clustering method for identification of latent spaces to determine cell states and to infer trajectory topology. Normalized data was log2 transformed per CellTrails manual. The first step in CellTrails involves identification of variable genes. In order to identify the most variable genes, we took advantage of the M3Drop (v1.12.0, https://doi.org/10.18129/B9.bioc.M3Drop) method for identification of dropouts from the scRNA-Seq dataset using a Michaelis-Menten model (Andrews and Hemberg, 2019). We used the alternative Brennecke method for variable gene selection for hair cells subset reclustering analysis (Figure S5C) (Brennecke et al., 2013). The false discovery method was utilized with a threshold of 1%. From our dataset, we identified 1,662 variable features (genes) using M3Drop. These features were then used as input for CellTrails. A model matrix using cell level quality control metadata was generated to remove the effects of nuisance factors during the spectral embedding step of CellTrails (this included sequencing pool, age, genotype, enzyme, and cell position). We truncated the learned manifold to 8 relevant components using default parameters. Hierarchical spectral embedding identified 14 cell states using default parameters (min_size = 0.01, min_feat = 5, max_pval = 1e-4, min_fc = 2). Since our study focused on cell types in the sensory and non-sensory epithelium, otic mesenchymal cells (S14) that highly express the known mesenchymal marker Tbx18 (n = 15 cells) were considered as contaminants and consequently excluded from further analyses (Trowe et al., 2008).
Data visualization and biological process integration
CellTrails by default provides the Barnes-Hut implementation of t-Distributed Stochastic Neighbor Embedding (tSNE) for 2D visualization of many higher order dimensions to represent cell states. tSNE and the more recent method of UMAP (Uniform Manifold Approximation and Projection) has advantages and disadvantages, but can distort data (Wu et al., 2018). We found the recently described SWNE method most intuitive as it integrates both discrete and continuous latent space information in one plot (Wu et al., 2018). If two cells or clusters of cells are in close proximity on the SWNE plot, this represents a true and potentially biologically relevant relationship. Variable genes from M3Drop and cell states and latent spaces as identified in CellTrails were used for generation of SWNE plots. A shared nearest neighbor matrix was created using default settings without pruning. This allowed for visualization of the CellTrails cell states and capturing continuous variables as demonstrated (Figures 1A and 1C).
The factor embedding function (nonnegative matrix factorization) allowed for identification of potentially biologically relevant genes that were visually incorporated into our data. A k of 16 was determined to be below error threshold, therefore 16 factors were incorporated (Figure S1D). The first 100 genes from each factor were then used for functional enrichment analysis using gProfiler for identification of biologically relevant processes and pathways (Raudvere et al., 2019). SWNE allowed for the visualization of multiple genes and multiple biological factors in one plot (Figure 1C). Further relevant biological processes for each factor are reported in Table S2.
Differential gene expression
We utilized Seurat package’s differential gene expression function for identification of differentially expressed genes among the different cell states with a log2 fold change of 2 or greater using the Wilcoxon rank sum test (Butler et al., 2018). To create the Seurat object, we used the SingleCellExperiment container slots of raw count data and log2 normalized count data prior to running FindAll-Markers function. The adjusted p values are based on the Bonferroni correction using all genes in the dataset (Seurat default). Combined cell states analyses to generate differentially expressed genes used the Wilcoxon rank sum test with a false discovery rate cut off of less than 1% and visualized as volcano plots (Figures 2B, 3C, 3I, 4B, 4C, and S7B). The Wilcoxon rank sum test was also used for comparison of S6 and S7 groups for Dkk3 and Tectb gene expressions (Figure S6D′).
Cell cycle classification
Cell cycle analysis was performed by utilizing a well-defined list of cell cycle genes in scRNA-Seq data provided by Tirosh et al. (2016). This is a list of 43 G1/S and 54 G2/M cell cycle genes. We detected expression of 91 out of these 97 genes in our dataset. Similar to Cui et al. (2019), we used the average log2 expression counts for these two gene sets with a threshold of 1.8. Cells with an average log2 count expression of G1/S or G2/M genes greater than 1.8 were considered proliferative, while the remaining cells were quiescent. In total, we identified 20 cells as proliferative after removal of Enpephigh/Cnmdlow cells, Enpephigh/Islrlow cells, and S14 cells.
Marker gene assignment
Similar to assignment of cell cycle scores, we assigned particular cells as being positive for specific markers. Antibody staining revealed that one of the identified markers, ENPEP, labeled the epithelial roof (Figures 4F and S7D). In order to exclude these cells from further analysis, we scored cells based on their log2 count expression of Enpep with a threshold greater than 2 being designated as Enpephigh. Cells expressing Cnmd or Islr at a log2 less than 2 were considered “low.” In total 19 cells were Enpephigh/Cnmdlow and 22 cells were Enpephigh/Islrlow (41 cells combined) (Figure S7E′).
Trajectory and pseudotime analysis
CellTrails was utilized for trajectory analysis. Enpephigh/Cnmdlow cells and Enpephigh/Islrlow cells likely represent epithelial roof cells and therefore excluded. S14 (Tbx18+ cells, n = 15 cells) were determined to be mesenchymal cells and were therefore also excluded from trajectory analysis (Figure S7E). After these filtering steps, M3Drop was used to determine the most variable features (1,633 genes). Hierarchical clustering was re-run using this set of features on the previously learned manifold with default settings, resulting in a total of 12 cell states (Figure S8A). This narrowed the predicted number of transitional epithelial cell states from 5 to 4. Cell states were then connected using a local neighborhood value of 7 (l = 7) to receive a single trajectory graph component. Cells were fitted onto the backbone of the trajectory graph for pseudotime analysis (Figures 5A and S8B). The yEd program (v3.18.1) was used as per CellTrails manual for visualization of ordered cells. The overall continuous structure of the ordered cells was additionally captured by the SWNE 2D representation of the latent spaces with the S8 state as the intermediate state between an extrastriolar (S7) progenitor cell and hair cells (S1–S5).
Statistical tests of significance for proportions and enrichment
We used the base R function ‘prop.test’ and ‘prop.trend.test’ to determine if 1) the proportions of P2, P4, and P6 are different per cell state, and 2) if there is a linear trend in less/more mature cell states (Figure S8C) (Newcombe, 1998a, 1998b; Wilson, 1927). We further used these same two tests to ask whether proliferative cells are different per age group and if there is a linear trend present (Figure 5H). We then used CellTrails’ ‘enrichment.test’ function to determine for each cell state if each age group is over-represented or not (Figure S8C). This uses a Fisher’s exact test for enrichment. This same enrichment test was used to determine if proliferative cells were over-represented in each cell state where they exist (Figure 5G)
Trajectory gene dynamics and differential gene expression
To determine genes that significantly change their expression during cell development, we utilized CellTrails’ fitDynamic function. We extracted sub-trails for each cell lineage from the branching trajectory graph and calculated their statistical association with gene expression patterns using the R mgcv package (https://doi.org/10.1201/9781315370279) per the CellTrails manual (Figures 5J, 6A–6C, and E). We further characterized the derived set of genes by using the AnimalTFDB 3.0 database, which contains 1,636 annotated transcription factors (Hu et al., 2019). To determine differences in gene expression dynamics between two trails (Figure 5K), the contrastTrailExpr function in CellTrails was used. Differences between trail expressions were estimated using the root-meansquare deviation (RMSD).
Trajectory analysis of hair bundle genes
To assess the hair cell trajectory tree built by CellTrails, we utilized known hair bundle genes to determine where they fall on the pseudotime trajectory. We calculated the bundle expression signature defined by the mean of the scaled gene expression. The log counts for the selected genes were normalized by the maximum value. The summed values were then imposed onto the hair cell trajectory tree (Figure S9). We chose specific markers described by Ellwanger et al. in the embryonic chick and projected their signatures onto the trajectory tree (Ellwanger et al., 2018).
Significant association between expression of a biologically relevant group of genes (in this case categories of bundle genes) and pseudotime was performed by fitting the average gene expression as a function of pseudotime (non-linearly with a generalized additive model) within a specific trail. This was done using CellTrails’ fitDynamic function by adding the average expression per gene group to the SingleCellExperiment object. The R-squared values and p values were extracted from the fit for the three hair cell trails tested (Figures 6D and S9; Table S16).
Supplementary Material
KEY RESOURCES TABLE
| REAGENT or RESOURCE | SOURCE | IDENTIFIER |
|---|---|---|
| Antibodies | ||
| Rabbit anti-MYOSIN7A (1:1000) | Proteus Biosciences | Cat# 25-6790; RRID:AB_10015251 |
| Goat anti-SOX2 (1:200) | R&D Systems | Cat# AF-2018; RRID:AB_355110 |
| Goat anti-SPARCL1 (1:500) | R&D Systems | Cat# AF2836-SP; RRID:AB_2195097 |
| Rabbit anti-RLBP1 (1:500) | Proteintech | Cat# 15356-1-AP; RRID:AB_2178530 |
| Rat anti-KI67 (1:400) | Thermo Fisher Scientific | Cat# 14-5698-80; RRID:AB_10853185 |
| Goat anti-ONCOMODULIN (OCM) (1:500) | Santa Cruz Biotech | Cat# SC-7446; RRID:AB_2267583 |
| Goat anti-OSTEOPONTIN (SPP1) (1:200) | R&D Systems | Cat# AF808; RRID:AB_2194992 |
| Rabbit anti-SOX9 (1:500) | Millipore | Cat# AB5535; RRID:AB_2239761 |
| Rabbit anti-HSD17B7 (1:500) | Proteintech | Cat# 14854-1-AP; RRID:AB_10951483 |
| Rabbit anti-TECTB (1:1000) | Gift from Guy Richardson | Rau et al., 1999 |
| Rabbit anti-CNN3 (1:500) | Proteintech | Cat# 11509-1-AP; RRID:AB_2082140 |
| Rabbit anti-ENPEP (1:500) | Proteintech | Cat# 17655-1-AP; RRID:AB_2099487 |
| Phalloidin (1:100) | Thermo Fisher Scientific | Cat# A22287; RRID:AB_2620155 |
| Alexa Fluor donkey anti-goat 488 | Thermo Fisher Scientific | Cat# A11055; RRID:AB_2534102 |
| Alexa Fluor donkey anti-goat 546 | Thermo Fisher Scientific | Cat# A11056; RRID:AB_142628 |
| Alexa Fluor donkey anti-goat 647 | Thermo Fisher Scientific | Cat# A21447; RRID:AB_141844 |
| Alexa Fluor donkey anti-rabbit 488 | Thermo Fisher Scientific | Cat# A21206; RRID:AB_2535792 |
| Alexa Fluor donkey anti-rabbit 546 | Thermo Fisher Scientific | Cat# A10040; RRID:AB_2534016 |
| Alexa Fluor donkey anti-rabbit 647 | Thermo Fisher Scientific | Cat# A31573; RRID:AB_2536183 |
| Critical commercial assays | ||
| RNAscope® Protease III & IV Reagents | Advanced Cell Diagnostics | Cat# 2007018 |
| RNAscope® Fluorescent Multiplex Detection | Advanced Cell Diagnostics | Cat# 320850 |
| 3-plex Positive Control Probe | Advanced Cell Diagnostics | Cat# 320881 |
| 3-plex Negative Control Probe | Advanced Cell Diagnostics | Cat# 320871 |
| RNAscope® Target Retrieval Reagents | Advanced Cell Diagnostics | Cat# 322000 |
| RNAscope® Wash Buffer Reagents | Advanced Cell Diagnostics | Cat#310091 |
| Mm-Apba1 (Probe) | Advanced Cell Diagnostics | Cat# 585741 |
| Mm-Nhlh1 (Probe) | Advanced Cell Diagnostics | Cat# 585751 |
| Mm-Fcrlb (Probe) | Advanced Cell Diagnostics | Cat# 585761 |
| Mm-Slc22a3 (Probe) | Advanced Cell Diagnostics | Cat# 439051 |
| Mm-Ttll3 (Probe) | Advanced Cell Diagnostics | Cat# 586791 |
| Mm-Dkk3 (Probe) | Advanced Cell Diagnostics | Cat# 400931 |
| Mm-Islr (Probe) | Advanced Cell Diagnostics | Cat# 450041 |
| Mm-Cnmd (Probe) | Advanced Cell Diagnostics | Cat# 585771 |
| Mm-Nptx1 (Probe) | Advanced Cell Diagnostics | Cat# 505421 |
| DapB (negative control) | Advanced Cell Diagnostics | Cat#310043 |
| Polr2A (positive control) | Advanced Cell Diagnostics | Cat#310451 |
| Deposited data | ||
| NCBI Gene Expression Omnibus: “Single cell RNA seq analysis of postnatal mouse utricle” | This paper | GEO: GSE155966 |
| gEAR (gene Expression Analysis Resource): “Single cell RNA seq analysis of postnatal mouse utricle” | This paper | https://umgear.org/p?s=bfc9d6c9 |
| Experimental models: Organisms and strains | ||
| Wildtype FVB mice | Jackson Laboratory | Strain# 001800 |
| Atoh1tm4.1Hzo mice | Jackson Laboratory | Strain#013593 |
| Pou4f3DTR/+ mice | Jackson Laboratory | Strain# 028673 |
| Software and algorithms | ||
| R: A Language and Environment for Statistical Computing (v3.6.1) | The R Project for Statistical Computing | https://www.R-project.org/ |
| CellTrails (v1.8.0) | Ellwanger et al., 2018 | https://bioconductor.org/packages/release/bioc/html/CellTrails.html |
| yEd Graph Editor Software (v3.18.1) | yworks | https://www.yworks.com |
| scater (v1.14.5) | McCarthy et al., 2017 | https://bioconductor.org/packages/release/bioc/html/scater.html |
| SCnorm (v1.8.2) | Bacher et al., 2017 | https://bioconductor.org/packages/release/bioc/html/SCnorm.html |
| swne (v0.6.2) | Wu et al., 2018 | https://github.com/yanwu2014/swne |
| seurat (v3.1.2) | Butler et al., 2018 | https://github.com/satijalab/seurat |
| M3Drop (v1.12.0) | Andrews and Hemberg, 2019 | https://bioconductor.org/packages/release/bioc/html/M3Drop.html |
| ImageJ (Fiji) (v2.0.0-rc-66/1.52b) | Fiji | https://imagej.net/ |
| STAR (v2.5.3a) | Dobin et al., 2013 | https://github.com/alexdobin/STAR |
| RSEM (v1.3.0) | Li and Dewey, 2011 | http://deweylab.biostat.wisc.edu/rsem |
Highlights.
The neonatal mouse utricle contains five transcriptionally unique hair cell subtypes
Islr and Cnmd mark transitional epithelial cells
Transitional epithelial cells contribute to the expanding postnatal utricle
Computational trajectory analysis reveals gene dynamics of the expanding utricle
ACKNOWLEDGMENTS
We would like to thank L. Jansson, M. Scheibinger, M. Weglarz, M.C. Yee, S. Sim, and J. Collar for excellent technical assistance, G. Richardson for sharing anti-TECTB antibody, C. Gralapp for figure illustration, and members of the Cheng and Heller laboratories for fruitful discussion and review of the manuscript. Cell sorting/flow cytometry analysis was done using the Stanford Shared FACS Facility. The Stanford Functional Genomics Facility was funded by NIH grants S10OD018220 and 1S10OD021763. The OHNS Imaging Core was supported by the Stanford Initiative to Cure Hearing Loss through gifts from the Bill and Susan Oberndorf Foundation. This work was supported by the American Society of Pediatric Otolaryngology, Hearing Research, Inc. (to T.A.J.) and by NIH/NIDCD grants K08DC019683 (to T.A.J.), T32DC015209, R01DC013910, and R01DC016919 (to A.G.C.), and R01DC015201 (to S.H.).
Footnotes
SUPPLEMENTAL INFORMATION
Supplemental information can be found online at https://doi.org/10.1016/j.celrep.2021.109358.
DECLARATION OF INTERESTS
S.H. is a paid consultant of Pipeline Therapeutics. D.C.E. is affiliated with Amgen, Inc. A.G.C. is a scientific advisor of Decibel Therapeutics. The remaining authors declare no competing interests.
REFERENCES
- Andrews TS, and Hemberg M (2019). M3Drop: Dropout-based feature selection for scRNASeq. Bioinformatics 35, 2865–2867. [DOI] [PMC free article] [PubMed] [Google Scholar]
- Atkinson PJ, Dong Y, Gu S, Liu W, Najarro EH, Udagawa T, and Cheng AG (2018). Sox2 haploinsufficiency primes regeneration and Wnt responsiveness in the mouse cochlea. J. Clin. Invest 128, 1641–1656. [DOI] [PMC free article] [PubMed] [Google Scholar]
- Bacher R, Chu L-F, Leng N, Gasch AP, Thomson JA, Stewart RM, Newton M, and Kendziorski C (2017). SCnorm: Robust normalization of single-cell RNA-seq data. Nat. Methods 14, 584–586. [DOI] [PMC free article] [PubMed] [Google Scholar]
- Brennecke P, Anders S, Kim JK, Kołodziejczyk AA, Zhang X, Proserpio V, Baying B, Benes V, Teichmann SA, Marioni JC, and Heisler MG (2013). Accounting for technical noise in single-cell RNA-seq experiments. Nat. Methods 10, 1093–1095. [DOI] [PubMed] [Google Scholar]
- Bucks SA, Cox BC, Vlosich BA, Manning JP, Nguyen TB, and Stone JS (2017). Supporting cells remove and replace sensory receptor hair cells in a balance organ of adult mice. eLife 6, e18128. [DOI] [PMC free article] [PubMed] [Google Scholar]
- Burns JC, Cox BC, Thiede BR, Zuo J, and Corwin JT (2012a). In vivo proliferative regeneration of balance hair cells in newborn mice. J. Neurosci 32, 6570–6577. [DOI] [PMC free article] [PubMed] [Google Scholar]
- Burns JC, On D, Baker W, Collado MS, and Corwin JT (2012b). Over half the hair cells in the mouse utricle first appear after birth, with significant numbers originating from early postnatal mitotic production in peripheral and striolar growth zones. J. Assoc. Res. Otolaryngol 13, 609–627. [DOI] [PMC free article] [PubMed] [Google Scholar]
- Burns JC, Kelly MC, Hoa M, Morell RJ, and Kelley MW (2015). Single-cell RNA-seq resolves cellular complexity in sensory organs from the neonatal inner ear. Nat. Commun 6, 8557. [DOI] [PMC free article] [PubMed] [Google Scholar]
- Butler A, Hoffman P, Smibert P, Papalexi E, and Satija R (2018). Integrating single-cell transcriptomic data across different conditions, technologies, and species. Nat. Biotechnol 36, 411–420. [DOI] [PMC free article] [PubMed] [Google Scholar]
- Calvo SE, Clauser KR, and Mootha VK (2016). MitoCarta2.0: An updated inventory of mammalian mitochondrial proteins. Nucleic Acids Res. 44 (D1), D1251–D1257. [DOI] [PMC free article] [PubMed] [Google Scholar]
- Chessum L, Matern MS, Kelly MC, Johnson SL, Ogawa Y, Milon B, McMurray M, Driver EC, Parker A, Song Y, et al. (2018). Helios is a key transcriptional regulator of outer hair cell maturation. Nature 563, 696–700. [DOI] [PMC free article] [PubMed] [Google Scholar]
- Corwin JT (1981). Postembryonic production and aging in inner ear hair cells in sharks. J. Comp. Neurol 201, 541–553. [DOI] [PubMed] [Google Scholar]
- Corwin JT, and Oberholtzer JC (1997). Fish n’ chicks: Model recipes for hair-cell regeneration? Neuron 19, 951–954. [DOI] [PubMed] [Google Scholar]
- Cui Y, Zheng Y, Liu X, Yan L, Fan X, Yong J, Hu Y, Dong J, Li Q, Wu X, et al. (2019). Single-cell transcriptome analysis maps the developmental track of the human heart. Cell Rep. 26, 1934–1950.e5. [DOI] [PubMed] [Google Scholar]
- Dobin A, Davis CA, Schlesinger F, Drenkow J, Zaleski C, Jha S, Batut P, Chaisson M, and Gingeras TR (2013). STAR: Ultrafast universal RNA-seq aligner. Bioinformatics 29, 15–21. [DOI] [PMC free article] [PubMed] [Google Scholar]
- Eatock RA, and Songer JE (2011). Vestibular hair cells and afferents: two channels for head motion signals. Annu. Rev. Neurosci 34, 501–534. [DOI] [PubMed] [Google Scholar]
- Eatock RA, Rüsch A, Lysakowski A, and Saeki M (1998). Hair cells in mammalian utricles. Otolaryngol. Head Neck Surg 119, 172–181. [DOI] [PubMed] [Google Scholar]
- Elkon R, Milon B, Morrison L, Shah M, Vijayakumar S, Racherla M, Leitch CC, Silipino L, Hadi S, Weiss-Gayet M, et al. (2015). RFX transcription factors are essential for hearing in mice. Nat. Commun 6, 8549. [DOI] [PMC free article] [PubMed] [Google Scholar]
- Ellwanger DC, Scheibinger M, Dumont RA, Barr-Gillespie PG, and Heller S (2018). Transcriptional dynamics of hair-bundle morphogenesis revealed with CellTrails. Cell Rep. 23, 2901–2914.e13. [DOI] [PMC free article] [PubMed] [Google Scholar]
- Ewels P, Magnusson M, Lundin S, and Käller M (2016). MultiQC: Summarize analysis results for multiple tools and samples in a single report. Bioinformatics 32, 3047–3048. [DOI] [PMC free article] [PubMed] [Google Scholar]
- Freeman S, Plotnik M, Elidan J, and Sohmer H (1999). Development of short latency vestibular evoked potentials in the neonatal rat. Hear. Res 137, 51–58. [DOI] [PubMed] [Google Scholar]
- Géléoc GSG, and Holt JR (2003). Developmental acquisition of sensory transduction in hair cells of the mouse inner ear. Nat. Neurosci 6, 1019–1020. [DOI] [PMC free article] [PubMed] [Google Scholar]
- Géléoc GSG, Risner JR, and Holt JR (2004). Developmental acquisition of voltage-dependent conductances and sensory signaling in hair cells of the embryonic mouse inner ear. J. Neurosci 24, 11148–11159. [DOI] [PMC free article] [PubMed] [Google Scholar]
- Gnedeva K, and Hudspeth AJ (2015). SoxC transcription factors are essential for the development of the inner ear. Proc. Natl. Acad. Sci. USA 112, 14066–14071. [DOI] [PMC free article] [PubMed] [Google Scholar]
- Gnedeva K, Jacobo A, Salvi JD, Petelski AA, and Hudspeth AJ (2017). Elastic force restricts growth of the murine utricle. eLife 6, e25681. [DOI] [PMC free article] [PubMed] [Google Scholar]
- Goodyear RJ, Gates R, Lukashkin AN, and Richardson GP (1999). Hair-cell numbers continue to increase in the utricular macula of the early posthatch chick. J. Neurocytol 28, 851–861. [DOI] [PubMed] [Google Scholar]
- Hu H, Miao Y-R, Jia L-H, Yu Q-Y, Zhang Q, and Guo A-Y (2019). AnimalTFDB 3.0: A comprehensive resource for annotation and prediction of animal transcription factors. Nucleic Acids Res. 47 (D1), D33–D38. [DOI] [PMC free article] [PubMed] [Google Scholar]
- Hurley KM, Gaboyard S, Zhong M, Price SD, Wooltorton JRA, Lysakowski A, and Eatock RA (2006). M-like K+ currents in type I hair cells and calyx afferent endings of the developing rat utricle. J. Neurosci 26, 10253–10269. [DOI] [PMC free article] [PubMed] [Google Scholar]
- Janesick AS, and Heller S (2019). Stem cells and the bird cochlea—Where is everybody? Cold Spring Harb. Perspect. Med 9, a033183. [DOI] [PMC free article] [PubMed] [Google Scholar]
- Jansson L, Ebeid M, Shen JW, Mokhtari TE, Quiruz LA, Ornitz DM, Huh S-H, and Cheng AG (2019). β-Catenin is required for radial cell patterning and identity in the developing mouse cochlea. Proc. Natl. Acad. Sci. USA 116, 21054–21060. [DOI] [PMC free article] [PubMed] [Google Scholar]
- Kamiya D, Banno S, Sasai N, Ohgushi M, Inomata H, Watanabe K, Kawada M, Yakura R, Kiyonari H, Nakao K, et al. (2011). Intrinsic transition of embryonic stem-cell differentiation into neural progenitors. Nature 470, 503–509. [DOI] [PubMed] [Google Scholar]
- Killick R, Legan PK, Malenczak C, and Richardson GP (1995). Molecular cloning of chick beta-tectorin, an extracellular matrix molecule of the inner ear. J. Cell Biol 129, 535–547. [DOI] [PMC free article] [PubMed] [Google Scholar]
- Li B, and Dewey CN (2011). RSEM: Accurate transcript quantification from RNA-seq data with or without a reference genome 16. BMC Bioinformatics 12, 323. [DOI] [PMC free article] [PubMed] [Google Scholar]
- Li A, Xue J, and Peterson EH (2008). Architecture of the mouse utricle: Macular organization and hair bundle heights. J. Neurophysiol 99, 718–733. [DOI] [PubMed] [Google Scholar]
- Mak ACY, Szeto IYY, Fritzsch B, and Cheah KSE (2009). Differential and overlapping expression pattern of SOX2 and SOX9 in inner ear development. Gene Expr. Patterns 9, 444–453. [DOI] [PMC free article] [PubMed] [Google Scholar]
- Manojlovic Z, Earwood R, Kato A, Stefanovic B, and Kato Y (2014). RFX7 is required for the formation of cilia in the neural tube. Mech. Dev 132, 28–37. [DOI] [PMC free article] [PubMed] [Google Scholar]
- Mattar P, Ericson J, Blackshaw S, and Cayouette M (2015). A conserved regulatory logic controls temporal identity in mouse neural progenitors. Neuron 85, 497–504. [DOI] [PMC free article] [PubMed] [Google Scholar]
- McCarthy DJ, Campbell KR, Lun ATL, and Wills QF (2017). Scater: Pre-processing, quality control, normalization and visualization of single-cell RNA-seq data in R. Bioinformatics 33, 1179–1186. [DOI] [PMC free article] [PubMed] [Google Scholar]
- McInturff S, Burns JC, and Kelley MW (2018). Characterization of spatial and temporal development of type I and type II hair cells in the mouse utricle using new cell-type-specific markers. Biol. Open 7, bio038083. [DOI] [PMC free article] [PubMed] [Google Scholar]
- Monzack EL, and Cunningham LL (2013). Lead roles for supporting actors: Critical functions of inner ear supporting cells. Hear. Res 303, 20–29. [DOI] [PMC free article] [PubMed] [Google Scholar]
- Newcombe RG (1998a). Two-sided confidence intervals for the single proportion: Comparison of seven methods. Stat. Med 17, 857–872. [DOI] [PubMed] [Google Scholar]
- Newcombe RG (1998b). Interval estimation for the difference between independent proportions: Comparison of eleven methods. Stat. Med 17, 873–890. [DOI] [PubMed] [Google Scholar]
- Oesterle EC, Campbell S, Taylor RR, Forge A, and Hume CR (2008). Sox2 and JAGGED1 expression in normal and drug-damaged adult mouse inner ear. J. Assoc. Res. Otolaryngol 9, 65–89. [DOI] [PMC free article] [PubMed] [Google Scholar]
- Ono K, Keller J, López Ramírez O, González Garrido A, Zobeiri OA, Chang HHV, Vijayakumar S, Ayiotis A, Duester G, Della Santina CC, et al. (2020). Retinoic acid degradation shapes zonal development of vestibular organs and sensitivity to transient linear accelerations. Nat. Commun 11, 63. [DOI] [PMC free article] [PubMed] [Google Scholar]
- Pagliarini DJ, Calvo SE, Chang B, Sheth SA, Vafai SB, Ong S-E, Walford GA, Sugiana C, Boneh A, Chen WK, et al. (2008). A mitochondrial protein compendium elucidates complex I disease biology. Cell 134, 112–123. [DOI] [PMC free article] [PubMed] [Google Scholar]
- Picelli S, Björklund ÅK, Faridani OR, Sagasser S, Winberg G, and Sandberg R (2013). Smart-seq2 for sensitive full-length transcriptome profiling in single cells. Nat. Methods 10, 1096–1098. [DOI] [PubMed] [Google Scholar]
- Picelli S, Faridani OR, Björklund AK, Winberg G, Sagasser S, and Sandberg R (2014). Full-length RNA-seq from single cells using Smart-seq2. Nat. Protoc 9, 171–181. [DOI] [PubMed] [Google Scholar]
- Rau A, Legan PK, and Richardson GP (1999). Tectorin mRNA expression is spatially and temporally restricted during mouse inner ear development. J. Comp. Neurol 405, 271–280. [PubMed] [Google Scholar]
- Raudvere U, Kolberg L, Kuzmin I, Arak T, Adler P, Peterson H, and Vilo J (2019). g:Profiler: A web server for functional enrichment analysis and conversions of gene lists (2019 update). Nucleic Acids Res. 47 (W1), W191–W198. [DOI] [PMC free article] [PubMed] [Google Scholar]
- Rüsch A, Lysakowski A, and Eatock RA (1998). Postnatal development of type I and type II hair cells in the mouse utricle: Acquisition of voltage-gated conductances and differentiated morphology. J. Neurosci 18, 7487–7501. [DOI] [PMC free article] [PubMed] [Google Scholar]
- Sahly I, El-Amraoui A, Abitbol M, Petit C, and Dufier JL (1997). Expression of myosin VIIA during mouse embryogenesis. Anat. Embryol. (Berl.) 196, 159–170. [DOI] [PubMed] [Google Scholar]
- Sayyid ZN, Wang T, Chen L, Jones SM, and Cheng AG (2019). Atoh1 directs regeneration and functional recovery of the mature mouse vestibular system. Cell Rep. 28, 312–324.e4. [DOI] [PMC free article] [PubMed] [Google Scholar]
- Scheibinger M, Ellwanger DC, Corrales CE, Stone JS, and Heller S (2018). Aminoglycoside damage and hair cell regeneration in the chicken utricle. J. Assoc. Res. Otolaryngol 19, 17–29. [DOI] [PMC free article] [PubMed] [Google Scholar]
- Simmons DD, Tong B, Schrader AD, and Hornak AJ (2010). Oncomodulin identifies different hair cell types in the mammalian inner ear. J. Comp. Neurol 518, 3785–3802. [DOI] [PMC free article] [PubMed] [Google Scholar]
- Stone JS, Wisner SR, Bucks SA, Mellado Lagarde MM, and Cox BC (2018). Characterization of adult vestibular organs in 11 CreER mouse lines. J. Assoc. Res. Otolaryngol 19, 381–399. [DOI] [PMC free article] [PubMed] [Google Scholar]
- Thomas PV, Cheng AL, Colby CC, Liu L, Patel CK, Josephs L, and Duncan RK (2014). Localization and proteomic characterization of cholesterol-rich membrane microdomains in the inner ear. J. Proteomics 103, 178–193. [DOI] [PMC free article] [PubMed] [Google Scholar]
- Tirosh I, Izar B, Prakadan SM, Wadsworth MH 2nd, Treacy D, Trom-betta JJ, Rotem A, Rodman C, Lian C, Murphy G, et al. (2016). Dissecting the multicellular ecosystem of metastatic melanoma by single-cell RNA-seq. Science 352, 189–196. [DOI] [PMC free article] [PubMed] [Google Scholar]
- Trowe M-O, Maier H, Schweizer M, and Kispert A (2008). Deafness in mice lacking the T-box transcription factor Tbx18 in otic fibrocytes. Development 135, 1725–1734. [DOI] [PubMed] [Google Scholar]
- Wan G, Corfas G, and Stone JS (2013). Inner ear supporting cells: Rethinking the silent majority. Semin. Cell Dev. Biol 24, 448–459. [DOI] [PMC free article] [PubMed] [Google Scholar]
- Wang T, Chai R, Kim GS, Pham N, Jansson L, Nguyen D-H, Kuo B, May LA, Zuo J, Cunningham LL, and Cheng AG (2015). Lgr5+ cells regenerate hair cells via proliferation and direct transdifferentiation in damaged neonatal mouse utricle. Nat. Commun 6, 6613. [DOI] [PMC free article] [PubMed] [Google Scholar]
- Wang T, Niwa M, Sayyid ZN, Hosseini DK, Pham N, Jones SM, Ricci AJ, and Cheng AG (2019). Uncoordinated maturation of developing and regenerating postnatal mammalian vestibular hair cells. PLoS Biol. 17, e3000326. [DOI] [PMC free article] [PubMed] [Google Scholar]
- Warchol ME (2011). Sensory regeneration in the vertebrate inner ear: Differences at the levels of cells and species. Hear. Res 273, 72–79. [DOI] [PubMed] [Google Scholar]
- Warchol ME, Lambert PR, Goldstein BJ, Forge A, and Corwin JT (1993). Regenerative proliferation in inner ear sensory epithelia from adult guinea pigs and humans. Science 259, 1619–1622. [DOI] [PubMed] [Google Scholar]
- Warchol ME, Massoodnia R, Pujol R, Cox BC, and Stone JS (2019). Development of hair cell phenotype and calyx nerve terminals in the neonatal mouse utricle. J. Comp. Neurol 527, 1913–1928. [DOI] [PMC free article] [PubMed] [Google Scholar]
- Wilson EB (1927). Probable inference, the law of succession, and statistical inference. J. Am. Stat. Assoc 22, 209–212. [Google Scholar]
- Wloga D, Webster DM, Rogowski K, Bré M-H, Levilliers N, Jerka-Dziadosz M, Janke C, Dougan ST, and Gaertig J (2009). TTLL3 is a tubulin glycine ligase that regulates the assembly of cilia. Dev. Cell 16, 867–876. [DOI] [PubMed] [Google Scholar]
- Wu Y, Tamayo P, and Zhang K (2018). Visualizing and interpreting single-cell gene expression datasets with similarity weighted nonnegative embedding. Cell Syst. 7, 656–666.e4. [DOI] [PMC free article] [PubMed] [Google Scholar]
- Xu Y, Zhang H, Yang H, Zhao X, Lovas S, and Lundberg YW (2010). Expression, functional, and structural analysis of proteins critical for otoconia development. Dev. Dyn 239, 2659–2673. [DOI] [PMC free article] [PubMed] [Google Scholar]
- Zheng L, Beeler DM, and Bartles JR (2014). Characterization and regulation of an additional actin-filament-binding site in large isoforms of the stereocilia actin-bundling protein espin. J. Cell Sci 127, 1306–1317. [DOI] [PMC free article] [PubMed] [Google Scholar]
Associated Data
This section collects any data citations, data availability statements, or supplementary materials included in this article.
Supplementary Materials
Data Availability Statement
The raw sequencing data, including all FASTQ files, are deposited in the NCBI Gene Expression Omnibus (GEO: GSE155966). This further includes all metadata, unfiltered cells (n = 1,002 cells), processed read count data, and which cells passed our quality metrics and which ones did not. All cells prior to quality control (n = 1,002 cells) are also uploaded into gEAR (https://umgear.org/p?s=bfc9d6c9), which is a publicly available portal for visualization and analysis of multiomic data. Code used to generate figures and plots are from standard indicated R package manuals and are available upon request.