Abstract
Mitogen-activated protein kinase 6 (MAPK6) represents an atypical MAPK also known as extracellular signal-regulated kinase 3 (ERK3), which has been shown to play roles in cell motility and metastasis. ERK3 promotes migration and invasion of lung cancer cells and head and neck cancer cells by regulating the expression and/or activity of proteins involved in cancer progression. For instance, ERK3 upregulates matrix metallopeptidases and thereby promotes cancer cell invasiveness, and it phosphorylates tyrosyl-DNA phosphodiesterase 2, thereby enhancing chemoresistance in lung cancer. Here we discovered that ERK3 plays a converse role in melanoma. We observed that BRAF, an oncogenic Ser/Thr kinase, upregulates ERK3 expression levels by increasing both ERK3 messenger RNA levels and protein stability. Interestingly, although BRAF’s kinase activity was required for upregulating ERK3 gene transcription, BRAF stabilized ERK3 protein in a kinase-independent fashion. We further demonstrate that ERK3 inhibits the migration, proliferation and colony formation of melanoma cells. In line with this, high level of ERK3 predicted increased survival among patients with melanomas. Taken together, these results indicate that ERK3 acts as a potent suppressor of melanoma cell growth and invasiveness.
Keywords: BRAF, cancer, extracellular signal-regulated kinase 3, invasion, mitogen-activated protein kinase 6, melanoma, migration
1 |. INTRODUCTION
Melanoma arises from the pigment-producing cells of the skin. It makes up 75% of skin cancer deaths, even though it only accounts for less than 5% of all skin cancer cases. As with other types of cancer, melanoma is caused by genetic alterations. Notably, v-Raf murine sarcoma viral oncogene homolog B (BRAF) is found frequently mutated in melanoma. Chronic activation of BRAF kinase activity is one of the oncogenic factors that allow these melanomas to grow and divide indefinitely (DeLuca, Srinivas, & Alani, 2008). The substitution of glutamic acid for valine at codon 600 (V600E) accounts for approximately 90% of all BRAF activating mutations (Davies et al., 2002). V600E mutation leads to the constitutive activation of BRAF kinase activity, which is known to promote melanoma initiation and metastatic progression by activating multiple downstream targets such as the mitogen-activated protein kinase (MAPK) family (Goel et al., 2009).
Extracellular signal-regulated kinase 3 (ERK3) is an atypical MAPK; like ERK1 and ERK2, it has a kinase domain and participates in signal transduction to the nucleus in response to extracellular stimuli. Unlike the classical MAP kinases, the upstream signals and downstream effectors of ERK3 are largely unknown (reviewed in Cargnello & Roux, 2011). ERK3 is usually an unstable protein (Coulombe, Rodier, Bonneil, Thibault, & Meloche, 2004; Coulombe, Rodier, Pelletier, Pellerin, & Meloche, 2003); however, it is overexpressed in some cancers (Liang et al., 2005). As more research has focused on ERK3, it has become apparent that it has important roles in regulating cellular functions in several types of cancer. In lung cancer, ERK3 has been shown to promote cell invasion (Long et al., 2012) and chemoresistance (Bian et al., 2016). Similarly, upregulation of ERK3 in head and neck cancers mediates cancer cell migration (Elkhadragy, Chen, Miller, Yang, & Long, 2017). It is therefore important to understand how ERK3 expression and protein stability are regulated in cancers, which may contribute to its metastatic potential.
ERK3 gene transcription was shown to be regulated by BRAF in melanoma cells, but its role in melanoma cell growth and invasiveness is unknown (Hoeflich et al., 2006). We attempted to examine the role of ERK3 in melanoma and determine whether ERK3 acts as a downstream effector of BRAF signaling. When verifying the regulation of ERK3 expression by BRAF, we found that BRAF not only upregulates ERK3 transcript level but also increases its protein stability. We further revealed that BRAF increases ERK3 transcription depending on its kinase activity, but stabilizes ERK3 protein by a kinase-independent mechanism. We then investigated the role of ERK3 in melanoma. Contrary to what has been observed in other cancers, ERK3 represses the migration of melanoma cells, reduces invasion through Matrigel, and reduces melanoma cell growth and colony formation. In line with its cellular functions, ERK3 gene expression decreases during melanoma progression and correlates with worse prognosis.
2 |. MATERIALS AND METHODS
2.1 |. Cell culture
All cell culture supplements and HERAcell® 150i incubator were purchased from Thermo Fisher Scientific (Waltham, MA). The human melanoma A375 and ocular melanoma OCM3 were obtained from Dr. Mitsiades’s Lab, Baylor College of Medicine (Mitsiades et al., 2011). The tumorigenic vertical growth phase primary melanoma WM3211 and human melanoma SK-Mel2 were obtained from Dr. Feng Liu’s Lab, the University of California at Davis (Liu, Gomez Garcia, & Meyskens, 2012). All the other cell lines, including HEK293T, squamous cell skin carcinoma A431 and lung adenocarcinoma NSCLC H23 were originally purchased from American Type Culture Collection.
A375, 293T, A431, and B16F10 cells were maintained in Dulbecco’s modified Eagle’s medium. OCM3, WM3211, and H23 cell lines were cultured in Roswell Park Memorial Institute medium. All media were supplemented with 10% fetal bovine serum and 1% antibiotics penicillin–streptomycin.
2.2 |. Transient small interfering RNA (siRNA) knockdown
DharmaFECT Transfection Reagent (GE Healthcare Dharmacon, Inc.) was used to transiently knockdown messenger RNA (mRNA, Chicago, IL) following the manufacturer’s instructions. siRNA used were: siBRAFs (Dharmacon siGENOME SMART Plus BRAF, Qiagen [Venlo, Netherlands] Hs_BRAF_1 Functionally verified Flexi tube siRNA, SI00299488 and Ambion [Carlsbad, CA] silencer validated siRNA against BRAF ID407); ERK3 knockdown (siERK3) (Ambion Silencer® Select Pre-Designed siRNA); and Negative control siRNA pool (Dharmacon SMART pool: siGENOME siRNA, Qiagen All Stars Negative Control Flexi tube siRNA, and Ambion® Silencer® Select Negative Control siRNA).
2.3 |. Mutagenesis of plasmids and transient overexpression
The plasmids pcDNA3-BRAF (Addgene 40775, Watertown, MA) was used to generate a single point mutation in the kinase domain of BRAF. This kinase-dead (KD) construct contained the mutation (D594A; Heidorn et al., 2010). It was synthesized following Quick Change II XL site-directed mutagenesis kit (Agilent Technologies, Santa Clara, CA) protocol with designed point mutation primers (Invitrogen, Carlsbad, CA): 5′-CTCACAGTAAAAATAGGTGCTTTTGGTCTAGCTACAGTG-3′ and 3′-CACTGTAGCTAGACCAAAAGCACCTATTTTTACTGTGAGG-5′. The synthesized plasmid was amplified using MAX Efficiency® DH5α™ Competent Cells (Invitrogen) followed by purification using GeneJET Plasmid Midiprep Kids (Thermo Fisher Scientific) according to the manufacturer’s protocol. The construct was verified by DNA sequencing (Retrogen, San Diego, CA). Plasmids were transiently overexpressed in cells using FuGENE® HD transfection reagent (Active Motif, Carlsbad, CA) following the manufacturer’s protocol.
2.4 |. Stable expression with lentiviral system
pcDNA3-Myc6-ERK3 lentiviral constructs for ERK3 stable overexpression (with six Myc tags at the N-terminus) was pregenerated as described previously (Long et al., 2012). Lentiviral expression systems include pGIPZ lentiviral short hairpin RNA (shRNA)-mir constructs of shGIPZ-shERK3 (Open Biosystems Inc V3LHS_344615) or shGIPZ-shCtrl (Open Biosystems RHS4346; Bian et al., 2016), and pCDH-Myc6-ERK3 or its empty vector control construct pCDH–CMV-MCS-EF1-Puro (System Bioscience, Lafayette, CO). Following the manufacturer’s protocol, constructs were next packed into packing vectors PAX2, PMD2G lentiviral expressing system (System Bioscience) and transfected using Lipofectamine® 3000 Reagent and P3000™ Reagent (Invitrogen) into HEK 293T cells (Open Biosystems). Lentivirus was collected after 48 hr and concentrated by PEG-it Virus Precipitation Solution (System Biosciences, Palo Alto, CA). shRNAs or complementary DNAs were expressed in melanoma cells using polybrene (5 μg/ml hexadimethrine bromide; Sigma-Aldrich, St. Louis, MO). The stable cell line was generated after puromycin (Sigma-Aldrich) selection (1 μg/ml) for 10 days.
2.5 |. Western blot analysis
EBC lysis buffer was prepared to lyse cell as follows: 50 mM Tris (pH 7.5), 150 mM NaCl, 0.5% NP-40, 1 mM Complete Protease Inhibitors (Roche Diagnostics, Risch-Rotkreuz, Switzerland), and 1 mM Phosphatase Inhibitor Cocktail III (Sigma-Aldrich). The cell lysate was mixed with Laemmli sample buffer then used to perform Western blot analysis following the procedures as described previously (Long et al., 2012). The following primary antibodies were used: anti-BRAF (sc-5284; Santa Cruz Biotechnology, Dallas, TX), anti-ERK3 (ab53277; Abcam, Cambridge, UK), anti-pERK1/2 (4370; Cell Signaling Technology, Danvers, MA), anti-Rictor (A300-459A-M; Bethyl Laboratories, Montgomery, TX), anti-sin 1 (A300–910A-T; Bethyl Laboratories), anti-β-actin (3700; Cell Signaling Technology), anti-GAPDH (ab181602; Abcam). β-Actin and GAPDH were used as loading control. Western blot imaging was performed and analyzed by Amersham Imager 600 and ImageQuantTL software (GE Healthcare Life Sciences, Chicago, IL).
2.6 |. Quantitative reverse transcription polymerase chain reaction
Total RNA of each cell line was extracted using Trizol® reagent (Ambion) following by reverse transcription (RT) using SuperScript® VILO™ MasterMix (Invitrogen) on SimpliAmp™ Thermal Cycler (Applied Biosystems, Foster City, CA) according to the manufacturer’s protocol. Quantitative polymerase chain reaction (qPCR) was performed using TaqMan® Universal Master Mix (Applied Biosystems), designed Roche Universal primers and UniversalProbe (Roche Diagnostics) on the 7900HT Fast Real-Time PCR Systems (Applied Biosystems). Relative expression level was expressed using the CT method with internal control glyceraldehyde 3-phosphate dehydrogenase (GAPDH). Data were expressed as a mean plus with standard deviation. Significance was quantified by Student’s t test where p < 0.05 was considered as statistically significant.
2.7 |. Protein stability assay
Stock protein translation inhibitor cycloheximide (Sigma-Aldrich, 100 mg/ml) was dissolved in 100% ethanol and BRAFV600E kinase inhibitor vemurafenib (Selleckchem, 10 mM, Houston, TX) was dissolved in dimethyl sulfoxide (DMSO; Sigma-Aldrich). Ethanol and DMSO were used as negative control respectively. Pretransfected or plated cells were treated with a decided dose of drugs (100 μg/ml CHX and/or 2 μM vemurafenib) for different time periods (as described in each figure) by adding directly to the plated cells. Protein or total RNA were collected for analyzing by Western blot analysis and RT-qPCR as described previously. The protein level of each time point was normalized with β-actin and then normalized to their first-time point level as 100%. Protein half-life and degradation speeds were calculated from densitometry analysis of the western blots in Image Quant TL (IQTL) as described. Trend lines and standard errors were calculated from multiple replicates of each experiment.
2.8 |. Migration and invasion assays
A modified two-chamber transwell system (8.0 μm pore; BD Biosciences Falcon™, San Jose, CA) was used to analyze cell migration and invasion following the manufacturer’s instructions and the Long lab’s protocol as follows. For invasion assay, inserts were precoated with Dulbecco’s phosphate-buffered saline-diluted 1 mg/ml of Growth Factor-Reduced Matrigel Matrix (Corning Inc., Corning, NY) following the manufacturer’s protocol. Trypsin- ethylenediaminetetraacetic acid (EDTA) detached cells were resuspended in 0.2 ml serum-free medium. 5 × 10⁴–1 × 10⁵ cells were plated for migration and 1.5 × 10⁵ for invasion. Cells were cultured in inserts and placed in wells containing 0.5 ml of complete culture media following with 8–12 hr migration or 20 hr invasion in a 37°C cell incubator. Cells that failed to migrate were removed using cotton swabs. Then, cells that migrated to the outer side of the insert were fixed with 4% paraformaldehyde for 10 min. Migrated cells were stained with water diluted 0.5% crystal violet solution for 5 min and captured to count with a ×20 primovert microscope (Carl Zeiss AG, Oberkochen, Germany) with a Motic camera/software system (Hong Kong).
2.9 |. Scratch healing assay
Cells were grown in complete media on the 24-well plate overnight until they formed a monolayer. Then, pipette tips were used to scratch the center of the well. Images were captured using the microscope and camera system described above at time points described in each figure. Healing distances were measured using Motic camera software following the manufacturer’s instructions.
2.10 |. Cell proliferation assay
Cell proliferation was determined by 3-(4,5-dimethylthiazol-2-yl)-2,5-diphenyltetrazolium bromide assay using the CellTiter 96 Aqueous One Solution Cell Proliferation Assay Kit (Promega, Madison, WI), following the manufacturer’s instructions. Absorbance was measured on a Synergy H1 microplate reader (BioTek, Winooski, VT) at 490 nm.
2.11 |. Soft agar colony formation assay
Three-dimensional in vitro colony formation was performed using the EMD Millipore Sigma Transformation assay kits (Burlington, MA) following the manufacturer’s protocol. 1,500 cells/well of a 24-well plate were grown in 0.25 ml of 0.15% agarose in complete media. 0.25 ml complete media was replenished every 3 days for a total of 2 weeks of culture in a 37°C cell incubator. The colonies’ morphology was captured using a microscope as described above. Then cells in agarose were either stained with 0.5 ml of Cell Stain Solution overnight for counting colonies or 0.08 ml of Cell Quantification Solution for quantification by measuring absorbance at 490 nm using Synergy H1 microplate reader (BioTek).
2.12 |. Survival analysis
The results shown here are based upon data generated by The Cancer Genome Atlas (TCGA) Research Network (http://cancergenome.nih.gov). Kaplan–Meier survival plots were generated using OncoLnc (Anaya, 2016) comparing the lower and upper 10th percentiles for MAPK6 expression in the datasets breast cancer and cutaneous melanoma. Survival curves were compared using the log-rank test (Bewick, Cheek, & Ball, 2004).
2.13 |. Gene expression in oncomine
Expression of MAPK6 (ERK3) was measured in the Talantov Melanoma dataset (Talantov et al., 2005) in Oncomine (https://www.oncomine.org; Rhodes et al., 2004) using Affymetrix probe 207121_s_at as the reporter. Gene expression data were centered against the median for all genes. Normal skin (n = 7) is compared with benign melanocytic nevi (n = 18) and cutaneous melanoma (n = 45).
2.14 |. Microarray analysis
Total RNA was extracted using Trizol® reagent (Ambion) 3 days post-siRNA-transfection. The RNA quality was assessed on an Agilent 2100 Bioanalyzer following the manufacturer’s protocol. Samples with RNA integrity numbers more than six were used for further analysis. The RNA concentration was measured by NanoDrop™ One Spectrophotometer (Thermo Fisher Scientific). Affymetrix microarray system was used for gene expression analysis using Clariom™ S Pico Assay (human) platform with wild-type (WT) PLUS Kit and GeneChip® Hybridization, Wash, and Stain Kit following the manufacturer’s protocols. Data were analyzed using the manufacturer’s software Transcriptome Analysis Console 3.0 and its protocol. Data were deposited at the Gene Expression Omnibus (accession number GSE112040).
3 |. RESULTS
3.1 |. BRAF upregulates ERK3 expression in melanoma cells
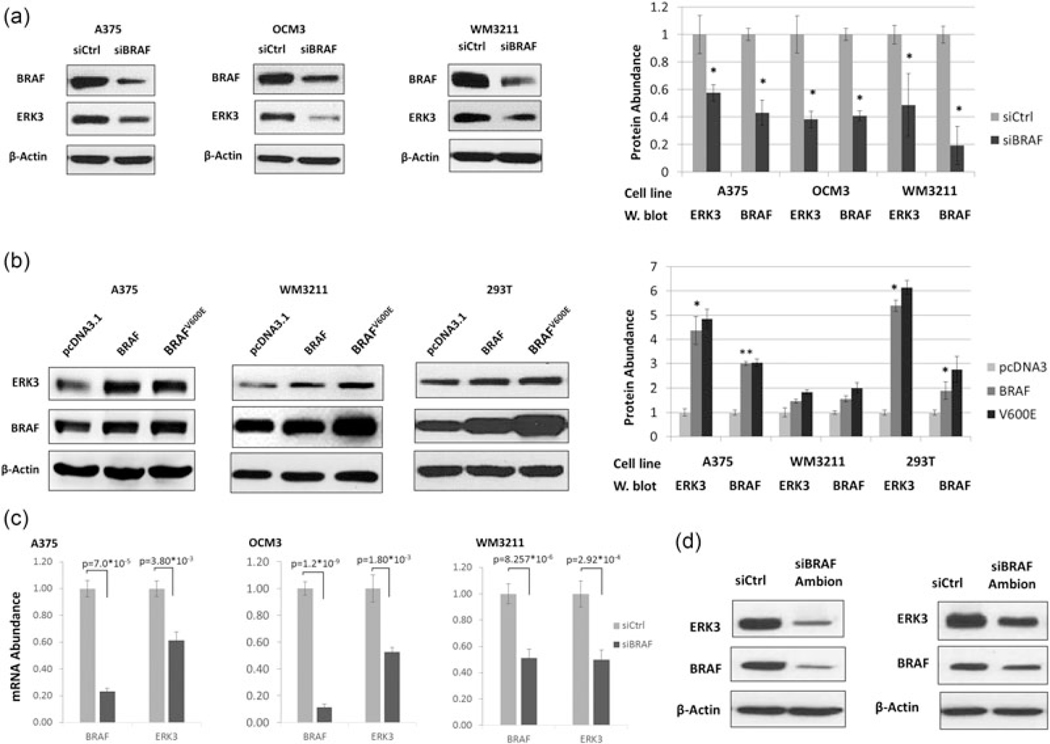
ERK3 was shown to be positively regulated by BRAF in A375 (Hoeflich et al., 2006), a melanoma cell line harboring BRAFV600E. First, we attempted to confirm the positive regulation of ERK3 expression by BRAF in multiple melanoma cell lines harboring either WT or mutant BRAF. Indeed, knockdown of BRAF by RNAi greatly decreased ERK3 protein level in A375 and OCM3, both of which harbor BRAFV600E, as well as in a WM3211, a melanoma cell line with WT BRAF (Figure 1a). Conversely, overexpression of either BRAF WT or BRAFV600E increased the level of ERK3 protein; this was also true in the embryonic kidney cell line 293T (Figure 1b). In each melanoma cell line, the decrease in ERK3 protein level by BRAF knockdown was accompanied by a significant decrease in ERK3 mRNA level (Figure 1c). Transient knockdown of BRAF with a second siRNA also resulted in decreased ERK3 (Figure 1d). Taken together, these results suggest that BRAF, regardless of the mutation status, upregulates ERK3 expression in melanoma cells. The converse is not true, as stable knock-down of ERK3 did not affect BRAF expression (Supporting Information Figure 1).
FIGURE 1.
BRAF upregulates ERK3 expression. (a) Western blot analysis of ERK3 reduction upon the knockdown of BRAF by siRNA in three different melanoma cell lines: A375, WM3211, and uveal BRAFV600E melanoma OCM3. β-Actin serves as a loading control. Western blots are representative of multiple experiments and quantified. (b) Expression plasmids for wild-type (WT) BRAF or constitutively active BRAFV600E were transiently transfected into melanoma cell lines A375 (BRAFV600E) and WM3211 (BRAF WT) or embryonic kidney noncancer cell line 293T (BRAF WT). Western blot analysis analysis reveals an increase in ERK3 protein concomitant with increased BRAF. (c) RT-qPCR was used to measure ERK3 mRNA levels in three melanoma cell lines A375, OCM3, and WM3211. BRAF was knocked down by siRNA for 2 days. Reduced ERK3 mRNA expression corresponds to the reduction in BRAF. Significance (p values) were determined by Student’s t test and expressed as mean ± standard deviation (n = 3). (d) ERK3 protein level was reduced upon BRAF knockdown using a silencer select siRNA (Ambion) in both A375 (left panel) and OCM3 (right panel). ERK3: extracellular signal-regulated kinase 3; mRNA: messenger RNA; RT-qPCR: quantitative reverse transcription PCR; siRNA: small interfering RNA; WT: wild-type
3.2 |. BRAF stabilizes ERK3 protein
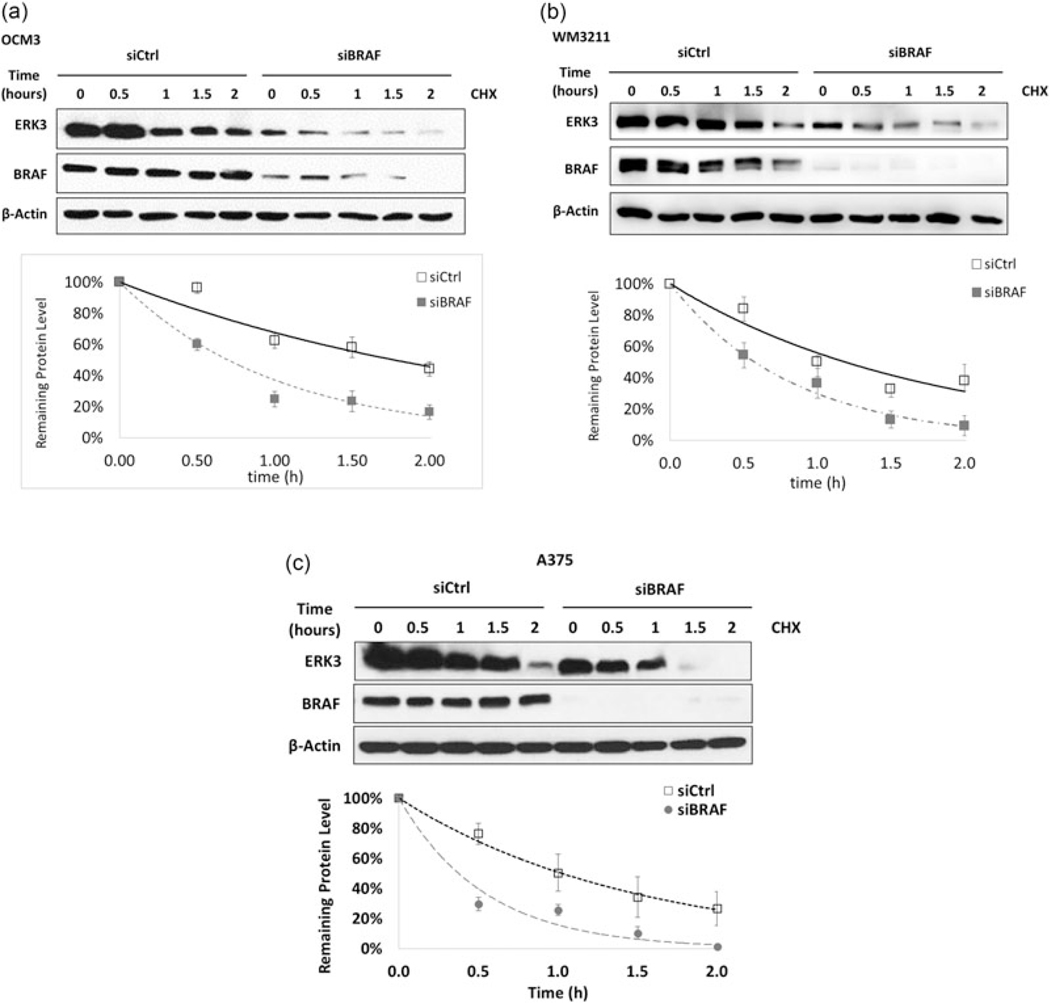
The observation that BRAF is able to affect the transcription of ERK3 confirms previous findings (Hoeflich et al., 2006). Interestingly, we noticed that the decrease of ERK3 protein level (>75%, Figure 1a) is greater than the decrease of ERK3 mRNA level (<50%, Figure 1c) upon BRAF knockdown in both A375 and OCM3, suggesting that besides gene transcription, another mechanism might be involved in the upregulation of ERK3 protein level by BRAF. As ERK3 is known to be a rather unstable protein, we explored the possibility that BRAF regulates ERK3 protein stability. To explore this possibility, melanoma cell lines were transfected with a siRNA against BRAF and then treated with cycloheximide to inhibit protein translation. This revealed a significant decrease in the half-life of ERK3 protein upon knockdown of BRAF in OCM3, WM3211, and A375 (Figure 2). These data suggest that BRAF is able to stabilize ERK3 protein in addition to increasing its transcription.
FIGURE 2.
BRAF knockdown led to a decrease of ERK3 protein stability. (a) OCM3, (b) WM3211, and (c) A375. Western blots indicate ERK3 protein degradation after 100 μg/ml protein translation inhibitor CHX treatment of 0, 0.5, 1, 1.5, and 2 hr. For densitometry analysis in IQTL software, the ERK3 level at each time point was first normalized to β-actin in each lane, then to ERK3 levels at 0 hr of siBRAF or siCtrl. These normalizing controls were set as 100% representing the initial protein levels respectively. Western blots and degradation trend-lines are representative of multiple experiments and expressed as mean ± standard deviation (n > 3). Protein half-life was calculated from the corresponding exponential trend-line equation. CHX: cycloheximide; ERK3: extracellular signal-regulated kinase 3
3.3 |. BRAF increases ERK3 gene transcription and protein stability by a kinase activity-dependent mechanism and a kinase activity-independent mechanism, respectively
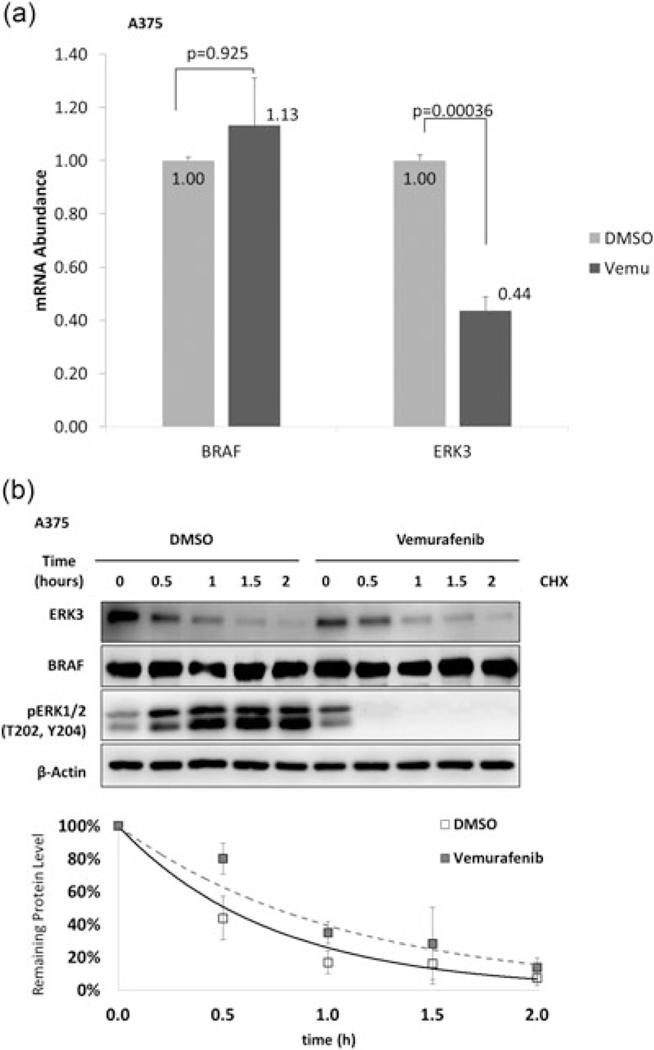
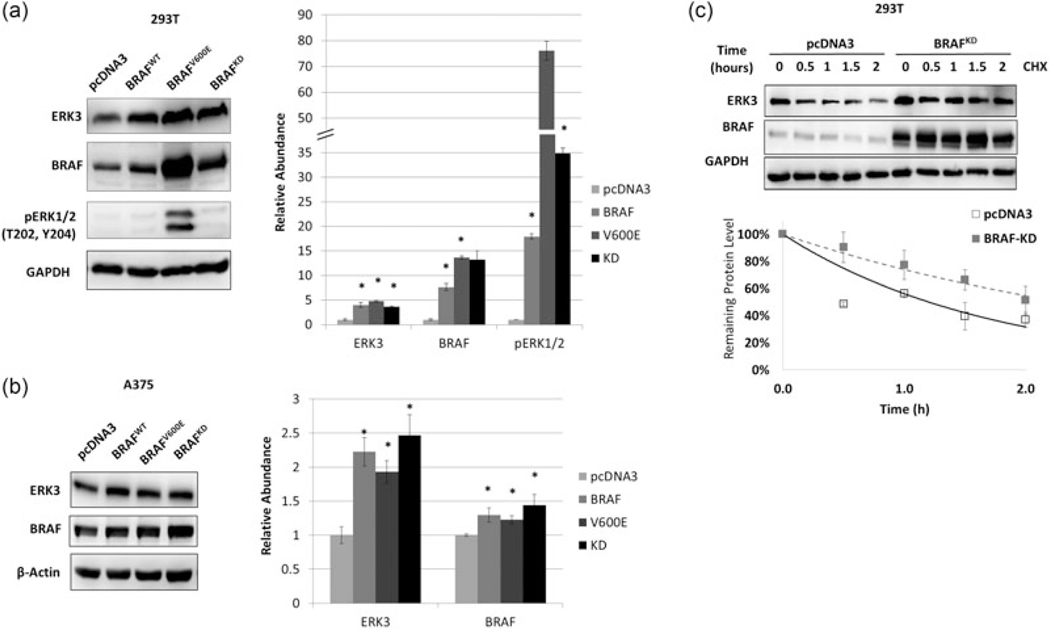
As BRAF has both kinase-dependent and kinase-independent roles (Al-Mahdi et al., 2015; Haling et al., 2014), we next sought to determine whether the kinase activity of BRAF was required for the upregulation of ERK3. Vemurafenib treatment was used to inhibit BRAF kinase activity in A375 cells. By 24 hr, ERK3 mRNA had decreased to less than half the level of the DMSO control (Figure 3a). To see whether protein stability of ERK3 is also affected by BRAF kinase activity, A375 cells were cotreated with vemurafenib and cycloheximide. Vemurafenib rapidly decreased BRAF activity, as indicated by loss of ERK1/2 phosphorylation (Figure 3b). However, inhibition of BRAF had no significant effect on the half-life of ERK3 protein (Figure 3b). These data suggest that BRAF kinase activity is required for increased transcription of ERK3 but not for stabilizing ERK3 protein. To further define the kinase-dependent and independent effects of BRAF on ERK3, A375 and the nonmelanoma 293 T cells were transfected with wild-type BRAF, constitutively active BRAF, or kinase-dead BRAF (Figure 4a and 4b). Importantly, all three BRAF forms were able to increase ERK3 protein levels. In a protein stability assay, kinase-dead BRAF (BRAF-KD) was able to upregulate ERK3 protein through increasing protein stability (Figure 4c), suggesting that BRAF stabilizes ERK3 protein through a kinase-independent mechanism.
FIGURE 3.
BRAF kinase activity is required for control of ERK3 transcription but not protein stability. (a) RT-qPCR analysis of ERK3 mRNA level changes in response to BRAF kinase activity inhibition. ERK3 or BRAF mRNA levels of Vemurafenib treated A375 cells were normalize to DMSO controls. Significance levels (p values) were determined by Student’s t test and expressed as a mean ± standard deviation (n = 3). (b) ERK3 protein stability is not impacted by BRAF kinase activity inhibition. Cycloheximide (CHX) treatment was performed in A375 cell lines simultaneously in vemurafenib or DMSO groups at 0, 0.5, 1, 1.5, and 2 hr. Western blots and degradation trend-line are representatives of three experiments and expressed as a mean ± standard deviation (n = 3). β-Actin serves as a loading control. BRAF: v-Raf murine sarcoma viral oncogene homolog B; DMSO: dimethyl sulfoxide; ERK3: extracellular signal-regulated kinase 3; mRNA: messenger RNA; RT-qPCR: quantitative reverse transcription PCR
FIGURE 4.
BRAF stabilizes ERK3 protein without requiring BRAF kinase activity. (a) Western blot analysis analysis of ERK3 level by BRAF (WT), BRAFV600E and BRAF kinase-dead (KD) plasmids transiently overexpression for 2 days in (a) nonmelanoma cell 293T or (b) A375. All three BRAF constructs are all able to induce ERK3 levels compared with pcDNA3 control in both cell lines. Immunoblots are quantified to the right. (c) BRAF-KD overexpression in 293T results in ERK3 protein stabilization. CHX treatment was performed at 2 days posttransfection of pcDNA3 control or BRAF-KD. Western blots and degradation trend line are representatives of multiple experiments expressed as a mean ± standard deviation (n = 3). β-Actin or GAPDH serves as a loading control. CHX: cycloheximide; ERK3: extracellular signal-regulated kinase 3; GAPDH: glyceraldehyde 3-phosphate dehydrogenase
3.4 |. ERK3 inhibits melanoma cell growth
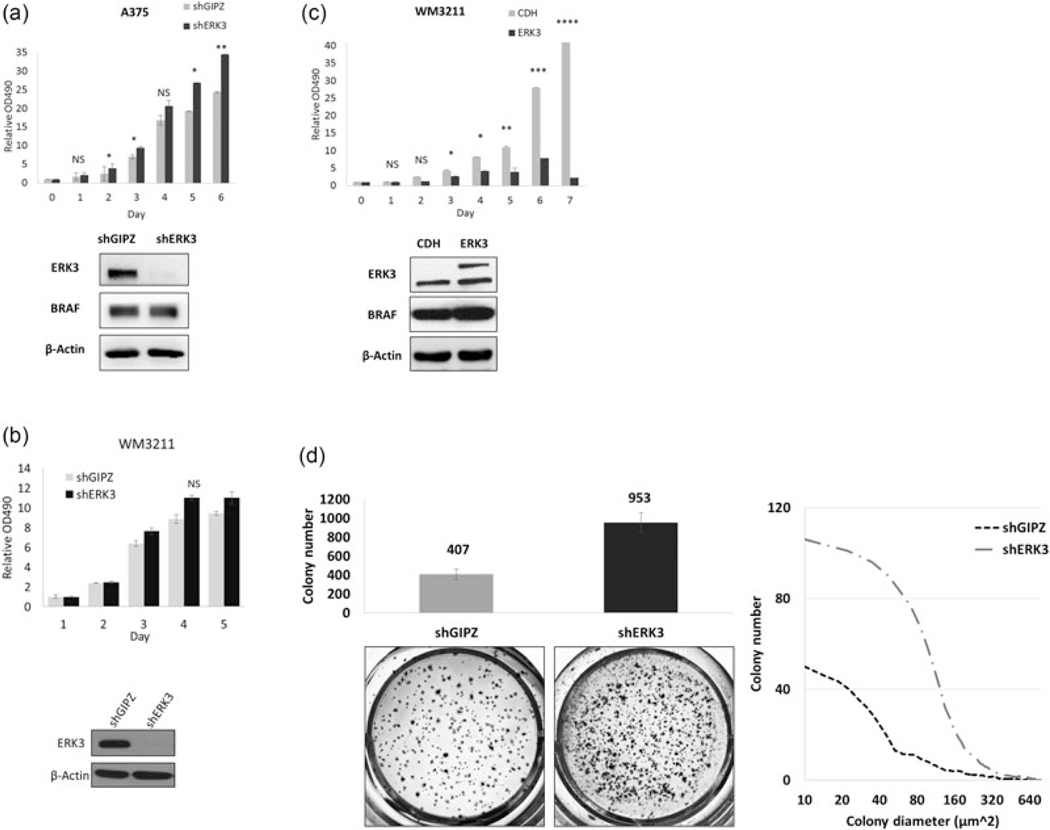
To determine its role in melanoma cell growth, ERK3 was stably knocked down using a lentiviral shRNA against ERK3 in A375 cells. Stable depletion of ERK3 led to a significant increase in proliferation of A375 cells (Figure 5a). While stable knockdown of ERK3 had no significant effect on the growth of WM3211 cells which expresses wild-type BRAF and a relatively low level of endogenous ERK3 (Figure 5b), stable expression of ERK3 in this cell line resulted in dramatic inhibition of proliferation (Figure 5c). Importantly, the depletion of ERK3 in A375 cells was also able to greatly increase colony formation in soft agar (Figure 5d).
FIGURE 5.
ERK3 inhibits melanoma cell proliferation and colony formation. MTT cell proliferation assays were performed in (a) A375 cells and (b) WM3211 cells, in both of which ERK3 was depleted by a lentiviral shRNA system with the empty lentiviral construct shGIPZ serving as a control, as well as (c) WM3211 cells stably overexpressing ERK3. Plasmids expression efficiencies were verified by western blots. The ERK3 overexpression lentiviral system expresses ERK3 with a Myc tag which was indicated by the upper band and larger molecular size compared with the empty expression construct CDH. Significance levels were determined by Student’s t test of an average of four times experiments and expressed as mean ± standard deviation. Asterisks indicate *p < 0.05, **p < 0.001, ***p < 0.0001, and ****p < 0.00001. NS indicates no statistical significance. The second clone of each stable cell line was analyzed to confirm results (not shown). (d) A375 ERK3 stable knock-down using a lentiviral system and its shGIPZ control cell lines were grown in soft agar to mimic in vivo growth for 2 weeks. Tumor morphology captured under ×4 microscope (left) and proliferation measured by MTT assay (right) were affected by ERK3 depletion. ERK3 expression was verified by western blot. Colonies were quantified after staining with a cell staining solution, and colony size distribution was measured using IQTL software. Colony formation ability was determined by the average of five experiments with four technical replicates each time. Presented captures were from the replicate with cell number, morphology, and colony size closest to the average. Significance levels (p values) were determined by Student’s t test and expressed as mean ± standard deviation. ERK3, extracellular signal-regulated kinase 3; MTT, 3-(4,5-dimethylthiazol-2-yl)-2,5-diphenyltetrazolium bromide
3.5 |. ERK3 inhibits migration and invasion of melanoma cell lines
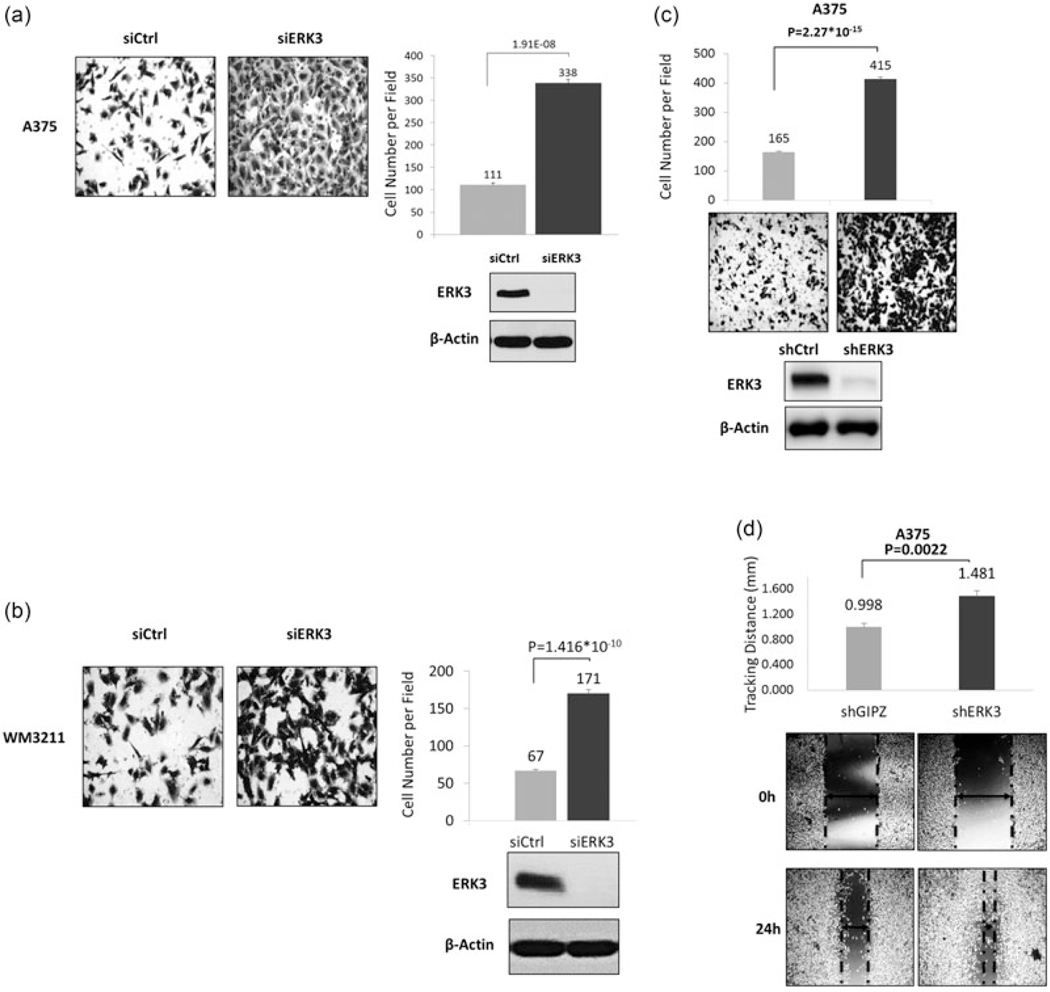
ERK3 has been demonstrated to increase the migration of several cancer cell lines (Al-Mahdi et al., 2015; Mathien, Déléris, Soulez, Voisin, & Meloche, 2017; Wang et al., 2014) and noncancerous vascular smooth muscle cells (Tan, Yang, Liu, & Yan, 2017). To investigate the role of ERK3 in melanoma cell migration, cells with transient expression of a control siRNA or a siRNA targeting ERK3 were compared in transwell migration assays. The siERK3 efficiently reduced ERK3 expression, as revealed by Western blots (Figure 6; lower panels). Migration across a transwell membrane was imaged and quantified for melanoma cells with BRAFV600E (Figure 6a) or BRAFWT (Figure 6b). In both cell lines, ERK3 knockdown led to a remarkable increase of cell migration.
FIGURE 6.
Knockdown of ERK3 promotes melanoma cells migration. Transwell migration assays were performed 2 days posttransfection with siERK3 in (a) BRAFV600E human melanoma cell lines A375, and (b) human WM3211 BRAF WT melanoma cell lines, or using (c) A375 by shRNA stably depleted using a lentiviral system targeting the ERK3 coding region with shGIPZ as empty vehicle control. Transwell migration was consistent with transient knockdowns. Knockdown efficiencies were verified by western blots. Migration was quantified by two-chamber transwell migration assays. Migrated cell numbers were quantified from an average of six captured fields (×20 magnification) per insert for two technical replicates per biological replicate (n > 3) after 8–12 hr depending on the cell line. Presented captures were from the replicate with cell number closest to the average. Significance levels (p values) were determined by Student’s t test and expressed as mean ± standard deviation. (d) Stable shERK3 A375 were used for scratch healing assays. Healing distances were measured under a ×4 magnification microscope field with six wells per cell line after 24 hr. Presented captures were from the one with cell number most close to the average. Significance levels (p values) were determined by Student’s t test and expressed as mean ± standard deviation (n = 6). BRAF: v-Raf murine sarcoma viral oncogene homolog B; ERK3: extracellular signal-regulated kinase 3; siERK3: ERK3 knockdown
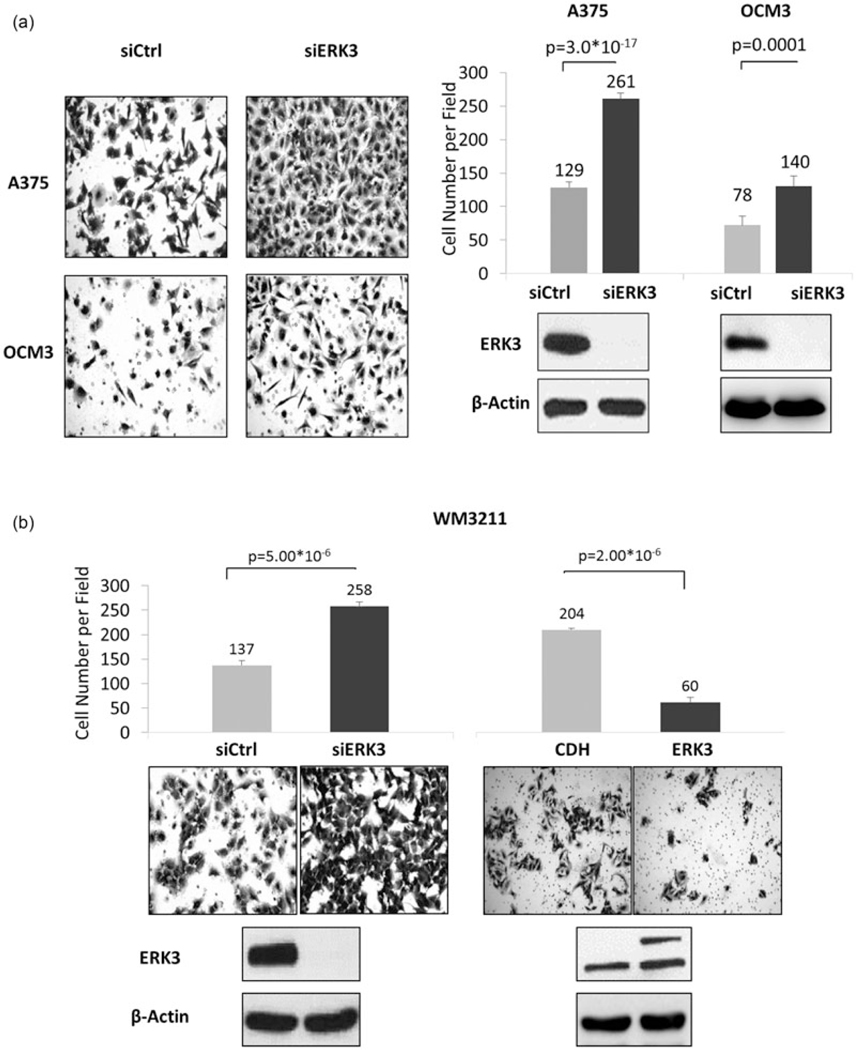
To confirm the inhibitory role of ERK3 in melanoma cell migration, ERK3 was stably depleted by lentiviral expression of a shRNA against ERK3. This efficiently reduced ERK3 expression (Figure 6c, lower panel). Stable knockdown of ERK3 dramatically increased the ability of these cells to migrate (Figure 6c). Similarly, shERK3 cells more rapidly migrated to fill in space in wound healing assays (Figure 6d). Furthermore, depletion of ERK3 greatly increased the invasion of melanoma cells (A375, OCM3, and WM3211) through Matrigel (Figure 7), whereas overexpression of ERK3 decreased invasion of WM3211 cells.
FIGURE 7.
Knockdown of ERK3 promotes melanoma cell invasion. Invasion assays were performed 2 days posttransfection with siERK3 in (a) BRAFV600E human melanoma cell lines A375 and OCM3 and (b) human WM3211 BRAF WT melanoma cell line. Transwell migration was consistent with transient knockdowns. Knockdown efficiencies were verified by western blots. Migration was quantified by two-chamber transwell migration assays. Migrated cell numbers were quantified from an average of six captured fields (×20 magnification) per insert for two technical replicates per biological replicate (n > 3) after 8–12 hr depending on the cell line. Presented captures were from the replicate with cell number closest to the average. Significance levels (p values) were determined by Student’s t test and expressed as mean ± standard deviation. BRAF: v-Raf murine sarcoma viral oncogene homolog B; ERK3: extracellular signal-regulated kinase 3; siERK3: ERK3 knockdown; WT: wild-type
As ERK3 promotes migration and invasion of lung cancer cells (Long et al., 2012) and head/neck cancer cells (Elkhadragy et al., 2017), our findings on ERK3’s inhibitory role in melanoma cell migration and invasion underline the tissue-specific effects of ERK3 in these cellular processes. To further corroborate this, ERK3 expression was suppressed by siRNA in the human skin squamous cell carcinoma A431 and the non-small cell lung adenocarcinoma H23. As expected, ERK3 knockdown reduced migration of H23 lung cancer cells (Supporting Information Figure 2, lower panels). However, similar to its role in melanoma cells, ERK3 knockdown greatly increased migration of A431 skin cancer cells (Supporting Information Figure 2).
3.6 |. Knockdown of ERK3 affects gene expression similar to that found in metastatic melanoma progression
Gene expression in A375 in response to ERK3 knockdown was investigated by microarray. These data were compared with gene expression data from a study that examined gene expression profiles in xenograft tumors derived from highly metastatic A375 variants versus poorly metastatic A375 parental lines (Xu et al., 2008; GEO accession GDS3964). Intriguingly, many genes (including ERK3) with roles in cell growth, migration, and adhesion showed similar expression changes in response to siERK3 as they did in the transition to a highly metastatic phenotype (Supporting Information Figure 3a). Some significantly up and downregulated genes were verified by RT-qPCR (Supporting Information Figure 3b). Fold changes and their significance are indicated in Table 1. These findings imply that downregulation of ERK3 is associated with the increased potential of melanoma metastasis, which is consistent with ERK3’s roles in inhibiting melanoma cell growth, migration, and invasion. To corroborate this, gene expression data were mined from the Gene Expression Omnibus for melanoma versus benign melanocytic nevi and normal skin (GEO series GSE3189; Talantov et al., 2005). The expression of ERK3 was compared between tissue types against the median-centered intensity of all probes on the microarrays. In normal skin (n = 7), ERK3 expression was relatively high and not different than in benign melanocytic lesions (n = 18; p = 0.781). However, in cutaneous melanomas (n = 45), ERK3 was significantly reduced (p = 2.56×10⁻⁸; Supporting Information Figure S4C). Taken together, our microarray data and clinical data support a role for ERK3 in suppressing progression and metastasis of melanoma.
TABLE 1.
Gene expression microarrays were used to compare A375 cells treated with a control siRNA or an siRNA targeting ERK3
| Gene symbol | Selected GO biological process (the gene ontology corsortium, 2017) | Our arrays | GDS3964 arrays | ||
|---|---|---|---|---|---|
|
|
|
||||
| Fold change (siERK3 vs. siCon) | ANOVA p value | Fold change (highly Vs. poorly metastatic) | ANOVA p value | ||
| ERK3 | Cell cycle, signal transduction | −8.15 | 1.20E–05 | −1.63 | 7.34E–11 |
| MGP | Cell differentiation | 9.88 | 3.05E–04 | 14.17 | 8.10E–10 |
| A2M | Extracellular matrix disassembly, regulation of small GTPase mediated signal transduction | 5.36 | 7.88E–04 | 16.15 | 7.83E–08 |
| SERPINF1 | Cell proliferation | 2.56 | 1.42E–03 | 7.01 | 1.62E–11 |
| TGFB2 | Activation of protein kinase activity, cell proliferation | 2.32 | 1.35E–03 | 1.28 | 4.67E–05 |
| SPP1 | Cell adhesion, inflammatory response | 2.26 | 4.49E–03 | 7.21 | 1.51E–10 |
| CHPT1 | Regulation of cell growth | 1.59 | 7.66E–03 | 1.66 | 7.23E–07 |
| CXCL1 | Actin cytoskeleton organization, signal transduction | −1.55 | 9.42E–03 | −2.39 | 3.91E–06 |
| PIK3CB | Activation of MAPK activity, cell migration | −1.59 | 1.30E–05 | −1.64 | 3.36E–09 |
| MAP2K1 | Activation of MAPK activity, cell motility | −1.6 | 4.80E–03 | −1.94 | 6.70E–15 |
| FOSL1 | Positive regulation of cell cycle | −1.76 | 3.08E–03 | −2.81 | 3.17E–11 |
| CXCL3 | Inflammatory response, chemokine-mediated signaling pathway | −2.01 | 3.98E–02 | −1.57 | 2.33E–04 |
| JAG1 | Notch signaling pathway | −2.3 | 3.22E–03 | −2.35 | 1.36E–06 |
| NT5E | DNA metabolic process | −3.02 | 5.82E–04 | −13.41 | 5.59E–14 |
| CCL20 | Cell-cell signaling, positive regulation of ERK1 and ERK2 cascade | −3.04 | 1.91E–03 | −1.72 | 1.99E–05 |
| SERPIND1 | Chemotaxis, posttranslational protein modification | −4.21 | 3.26E–03 | −1.51 | 1.11E–06 |
| PTX3 | Extracellular matrix oprganization | −4.76 | 8.30E–05 | −4.68 | 9.47E–08 |
Note. ANOVA, analysis of variance; ERK3, extracellular signal-regulated kinase 3; MGP, matrix gla protein; SPP1, secreted phosphoprotein 1.
Linear fold changes and significance were determined as described. These data were compared with a published study (Xu et al., 2008) of gene expression in A375 cells versus a highly metastatic derivative of the A375 cell line, also by microarray. Similarities in the expression of genes involved in cell growth and/or migration were noted. Several of the genes upregulated by siERK3 fall into the gene ontology categories of Cell Motility (GO:0006928) and/or Cell Migration (GO:0016477). Selected biological process gene ontology terms are presented (The Gene Ontology C., 2017). These represent potential direct or indirect ERK3 targets through which ERK3 could be impacting migration in melanoma.
4 |. DISCUSSION
Recent studies have revealed a tumor-promoting role for ERK3 in lung cancer and head/neck cancer (Bian et al., 2016; Elkhadragy et al., 2017; Long et al., 2012). Although ERK3 expression was shown to be positively regulated by BRAF signaling in A375 melanoma cells, ERK3’s role in melanoma is unclear. Consistent with the earlier work (Hoeflich et al., 2006), the present study shows that BRAF promotes the expression of ERK3 mRNA (Figure 1), and BRAF upregulates ERK3 mRNA through a mechanism dependent on its kinase activity (Figure 3). Interestingly, we had a new finding that BRAF also increases ERK3 protein stability through a kinase-independent mechanism (Figures 3 and 4). BRAF is known to have kinase-independent roles. For example, kinase-inactive BRAF forms a heterodimer with and then activates c-Raf (Haling et al., 2014). While the exact mechanism underlying ERK3 stabilization by kinase-dead BRAF is unclear, we are attempting to elucidate it and to determine whether ERK3 and BRAF physically interact.
We originally thought ERK3 would play a similar role in melanoma to that observed in other cancers (i.e, promoting migration and invasion). To our surprise, however, ERK3 was found to play the opposite role in melanoma. Knockdown of ERK3, either transiently by siRNA or stably by shRNA, promotes migration and invasion in each melanoma cell line tested. This was the case in A375 and OCM3, melanoma cell lines which carry BRAFV600E (Figure 6a and data not shown), and in melanoma cell lines with wild-type BRAF such as WM3211 and B16F10 (Figure 6b and data not shown). Interestingly, migration of A431, a skin squamous carcinoma cell line, was also promoted by ERK3 knockdown (Supporting Information Figure 2), indicating that this role of ERK3 is not unique to melanoma. In contrast, migration of the nonsmall cell lung adenocarcinoma H23 was inhibited by reduced ERK3 (Supporting Information Figure 2), consistent with the demonstrated role of ERK3 in promoting lung cancer invasiveness (Long et al., 2012). There is a clear tissue-specific effect of ERK3 on migration and invasion.
Whereas ERK3 has been observed to have little effect on the growth of lung cancer cells and head/neck cancer cells (Elkhadragy et al., 2017; Long et al., 2012), we observed that it inhibits cell proliferation and colony formation in soft agar in melanoma. Stable knockdown of ERK3 promoted proliferation (Figure 5a), while stable overexpression of ERK3 dramatically inhibited proliferation (Figure 5c). Given that BRAF is known to promote melanoma cell growth and invasiveness and positively regulates ERK3 expression level, we wanted to make sure long-term knockdown of ERK3 did not induce compensatory pathways to alter BRAF expression and confound these results. No significant change in BRAF was seen at the protein or mRNA levels in response to ERK3 knockdown (Supporting Information Figure 1).
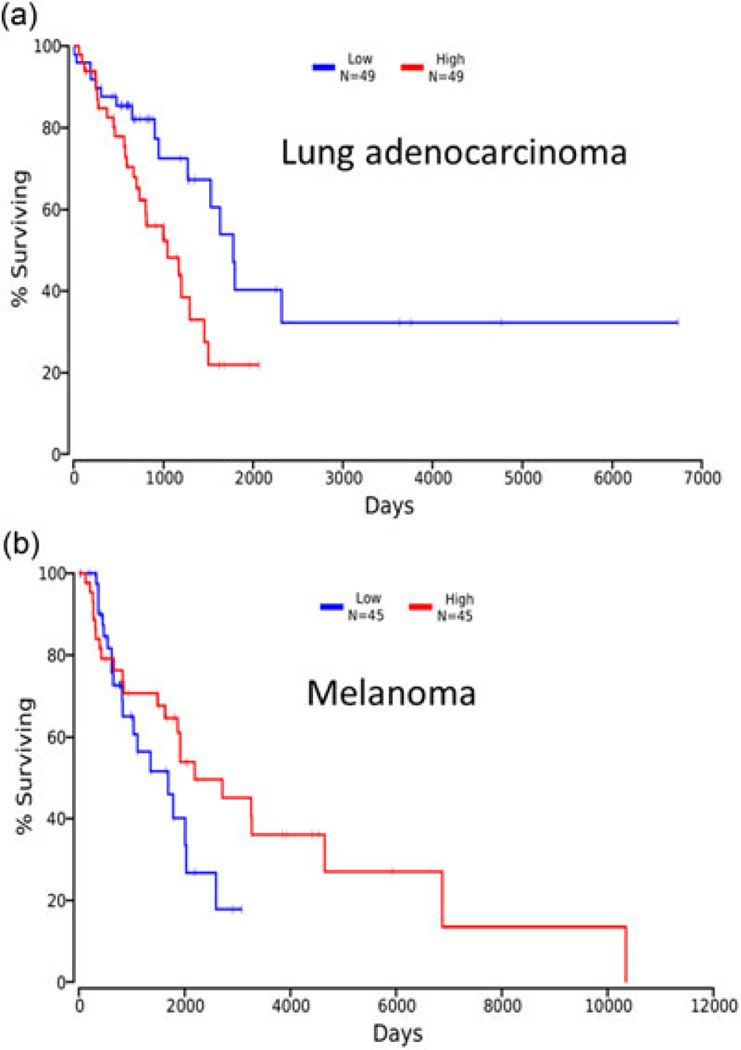
The differential cellular functions of ERK3 in different cancer types are actually corroborated by cancer patient survival data taken from TCGA study (http://cancergenome.nih.gov/). When we compare the survival between patients with the lowest 10% of ERK3 expression level in lung tumors and those with the highest 10% of ERK3 expression level, we see that higher ERK3 expression correlates to reduced survival (p = 0.0203; Figure 8a), consistent with its role in promoting invasion and metastasis in lung cancer. However, when we look at ERK3 expression levels and the patient survival in cutaneous melanoma, we see that lower ERK3 expression indicates a trend toward worse survival (p = 0.167), consistent with its role in suppressing melanoma cell growth and invasiveness (Figure 8c). The expression of ERK3 in the Talantov Melanoma dataset (Talantov et al., 2005) is also suggestive of a selective pressure against ERK3 expression in melanoma. In these data (Supporting Information Figure 3c), benign melanocytic nevi do not have significantly different expression of ERK3 versus normal skin (p = 0.781), but cutaneous melanomas have significantly less ERK3 than benign lesions (p = 2.56×10⁻⁸).
FIGURE 8.
Kaplan–Meier plots were generated from TCGA data using the datasets LUAD (lung adenocarcinoma; a) and SKCM (cutaneous melanoma; b) to compare survival data for patients with the highest and lowest ERK3 expression (10th and 90th percentiles). ERK3, extracellular signal-regulated kinase 3; TCGA, the cancer genome atlas
Taken together, our study has revealed a new role for ERK3 in inhibiting melanoma cell growth, migration, and invasion. Indeed, we also observed ERK3’s inhibitory effect on cell migration in a skin squamous cell carcinoma cell line (Supporting lnformation Figure 2). However, the mechanism by which ERK3 inhibits migration and invasion remains to be determined. As an initial attempt to elucidate the underlying mechanisms, we analyzed gene expression changes after ERK3 knockdown in both A375 melanoma and A549 lung cancer cells. Importantly, we found that several genes involved in the process of cell migration, such as matrix gla protein (Mertsch, Schurgers, Weber, Paulus, & Senner, 2009; Zandueta et al., 2016), TGFB2 and secreted phosphoprotein 1 (Rangaswami, Bulbule, & Kundu, 2006), are upregulated upon ERK3 knockdown in melanoma (Table 1). These are not the same genes that are changed in response to ERK3 knockdown in A549 cells (data not shown). We speculate that ERK3 may target different transcriptional factors in different cancer tissues, which account for the differences in gene expression changes and the ultimate effects on cellular processes. This remains a direction of the active investigation.
Supplementary Material
ACKNOWLEDGMENT
This study was partially supported by NCI 1R01CA193264-01 (to W. L.).
Funding information
National Cancer Institute, Grant/Award, Number: 5R01 CA193264
Footnotes
CONFLICTS OF INTEREST
The authors declare that there are no conflicts of interest.
SUPPORTING INFORMATION
Additional supporting information may be found online in the Supporting Information section at the end of the article.
REFERENCES
- Al-Mahdi R, Babteen N, Thillai K, Holt M, Johansen B, Wetting HL, … Wells CM (2015). A novel role for atypical MAPK kinase ERK3 in regulating breast cancer cell morphology and migration. Cell Adhesion & Migration, 9(6), 483–494. [DOI] [PMC free article] [PubMed] [Google Scholar]
- Anaya J. (2016). OncoLnc: Linking TCGA survival data to mRNAs, miRNAs, and lncRNAs. PeerJ Computer Science, 2, e67. [Google Scholar]
- Bewick V, Cheek L, & Ball J. (2004). Statistics review 12: Survival analysis. Critical Care, 8(5), 389–394. [DOI] [PMC free article] [PubMed] [Google Scholar]
- Bian K, Muppani NR, Elkhadragy L, Wang W, Zhang C, Chen T, … Long W. (2016). ERK3 regulates TDP2-mediated DNA damage response and chemoresistance in lung cancer cells. Oncotarget, 7(6), 6665–6675. [DOI] [PMC free article] [PubMed] [Google Scholar]
- Cargnello M, & Roux PP (2011). Activation and function of the MAPKs and their substrates, the MAPK-activated protein kinases. Microbiology and Molecular Biology Reviews, 75(1), 50–83. [DOI] [PMC free article] [PubMed] [Google Scholar]
- Coulombe P, Rodier G, Bonneil E, Thibault P, & Meloche S. (2004). N-Terminal ubiquitination of extracellular signal-regulated kinase 3 and p21 directs their degradation by the proteasome. Molecular and Cellular Biology, 24(14), 6140–6150. [DOI] [PMC free article] [PubMed] [Google Scholar]
- Coulombe P, Rodier G, Pelletier S, Pellerin J, & Meloche S. (2003). Rapid turnover of extracellular signal-regulated kinase 3 by the ubiquitin-proteasome pathway defines a novel paradigm of mitogen-activated protein kinase regulation during cellular differentiation. Molecular and Cellular Biology, 23(13), 4542–4558. [DOI] [PMC free article] [PubMed] [Google Scholar]
- Davies H, Bignell GR, Cox C, Stephens P, Edkins S, Clegg S, … Futreal PA (2002). Mutations of the BRAF gene in human cancer. Nature, 417(6892), 949–954. [DOI] [PubMed] [Google Scholar]
- DeLuca AM, Srinivas A, & Alani RM (2008). BRAF kinase in melanoma development and progression. Expert Reviews in Molecular Medicine, 10, e6. [DOI] [PubMed] [Google Scholar]
- Elkhadragy L, Chen M, Miller K, Yang MH, & Long W. (2017). A regulatory BMI1/let-7i/ERK3 pathway controls the motility of head and neck cancer cells. Molecular Oncology, 11(2), 194–207. [DOI] [PMC free article] [PubMed] [Google Scholar]
- Goel VK, Ibrahim N, Jiang G, Singhal M, Fee S, Flotte T, … Haluska FG (2009). Melanocytic nevus-like hyperplasia and melanoma in transgenic BRAFV600E mice. OncoGene, 28(23), 2289–2298. [DOI] [PMC free article] [PubMed] [Google Scholar]
- Haling JR, Sudhamsu J, Yen I, Sideris S, Sandoval W, Phung W, … Malek S. (2014). Structure of the BRAF-MEK complex reveals a kinase activity independent role for BRAF in MAPK signaling. Cancer Cell, 26(3), 402–413. [DOI] [PubMed] [Google Scholar]
- Heidorn SJ, Milagre C, Whittaker S, Nourry A, Niculescu-Duvas I, Dhomen N, … Marais R. (2010). Kinase-dead BRAF and oncogenic RAS cooperate to drive tumor progression through CRAF. Cell, 140(2), 209–221. [DOI] [PMC free article] [PubMed] [Google Scholar]
- Hoeflich K, Eby M, Forrest W, Gray D, Tien J, Stern H, … Seshagiri S. (2006). Regulation of ERK3/MAPK6 expression by BRAF. International Journal of Oncology, 29(4), 839–849. [PubMed] [Google Scholar]
- Liang B, Wang S, Zhu XG, Yu YX, Cui ZR, & Yu YZ (2005). Increased expression of mitogen-activated protein kinase and its upstream regulating signal in human gastric cancer. World Journal of Gastroenterology, 11(5), 623–628. [DOI] [PMC free article] [PubMed] [Google Scholar]
- Liu F, Gomez Garcia AM, & Meyskens FL Jr. (2012). NADPH oxidase 1 overexpression enhances invasion via matrix metalloproteinase-2 and epithelial-mesenchymal transition in melanoma cells. The Journal of Investigative Dermatology, 132(8), 2033–2041. [DOI] [PubMed] [Google Scholar]
- Long W, Foulds CE, Qin J, Liu J, Ding C, Lonard DM, … O’Malley BW (2012). ERK3 signals through SRC-3 coactivator to promote human lung cancer cell invasion. The Journal of Clinical Investigation, 122(5), 1869–1880. [DOI] [PMC free article] [PubMed] [Google Scholar]
- Mathien S, Déléris P, Soulez M, Voisin L, & Meloche S. (2017). Deubiquitinating enzyme USP20 regulates extracellular signal-regulated kinase 3 stability and biological activity. Molecular and Cellular Biology, 37(9). [DOI] [PMC free article] [PubMed] [Google Scholar]
- Mertsch S, Schurgers LJ, Weber K, Paulus W, & Senner V. (2009). Matrix gla protein (MGP): An overexpressed and migration-promoting mesenchymal component in glioblastoma. BMC Cancer, 9, 302. [DOI] [PMC free article] [PubMed] [Google Scholar]
- Mitsiades N, Chew SA, He B, Riechardt AI, Karadedou T, Kotoula V, & Poulaki V. (2011). Genotype-dependent sensitivity of uveal melanoma cell lines to inhibition of B-Raf, MEK, and Akt kinases: Rationale for personalized therapy. Investigative Ophthalmology & Visual Science, 52(10), 7248–7255. [DOI] [PMC free article] [PubMed] [Google Scholar]
- Rangaswami H, Bulbule A, & Kundu GC (2006). Osteopontin: Role in cell signaling and cancer progression. Trends in Cell Biology, 16(2), 79–87. [DOI] [PubMed] [Google Scholar]
- Rhodes DR, Yu J, Shanker K, Deshpande N, Varambally R, Ghosh D, … Chinnaiyan AM (2004). ONCOMINE: A cancer microarray database and integrated data-mining platform. Neoplasia, 6(1), 1–6. [DOI] [PMC free article] [PubMed] [Google Scholar]
- Talantov D, Mazumder A, Yu JX, Briggs T, Jiang Y, Backus J, … Wang Y. (2005). Novel genes associated with malignant melanoma but not benign melanocytic lesions. Clinical Cancer Research, 11(20), 7234–7242. [DOI] [PubMed] [Google Scholar]
- Tan J, Yang L, Liu C, & Yan Z. (2017). MicroRNA-26a targets MAPK6 to inhibit smooth muscle cell proliferation and vein graft neointimal hyperplasia. Scientific Reports, 7, 46602. [DOI] [PMC free article] [PubMed] [Google Scholar]
- The Gene Ontology Consortium (2017). Expansion of the gene ontology knowledgebase and resources. Nucleic Acids Research, 45(D1), D331–D338. [DOI] [PMC free article] [PubMed] [Google Scholar]
- Wang W, Bian K, Vallabhaneni S, Zhang B, Wu RC, O’Malley BW, & Long W. (2014). ERK3 promotes endothelial cell functions by upregulating SRC-3/SP1-mediated VEGFR2 expression. Journal of Cellular Physiology, 229(10), 1529–1537. [DOI] [PMC free article] [PubMed] [Google Scholar]
- Xu L, Shen SS, Hoshida Y, Subramanian A, Ross K, Brunet JP, … Hynes RO (2008). Gene expression changes in an animal melanoma model correlate with aggressiveness of human melanoma metastases. Molecular Cancer Research, 6(5), 760–769. [DOI] [PMC free article] [PubMed] [Google Scholar]
- Zandueta C, Ormazábal C, Perurena N, Martínez-Canarias S, Zalacaín M, Julián MS, … Lecanda F. (2016). Matrix-Gla protein promotes osteosarcoma lung metastasis and associates with poor prognosis. The Journal of Pathology, 239(4), 438–449. [DOI] [PubMed] [Google Scholar]
Associated Data
This section collects any data citations, data availability statements, or supplementary materials included in this article.


