

Abstract
Aims
The coordinated gene and metabolic programs that facilitate cardiomyocyte entry and progression in the cell cycle are poorly understood. The purpose of this study was to identify the metabolic changes that influence myocyte proliferation.
Methods and results
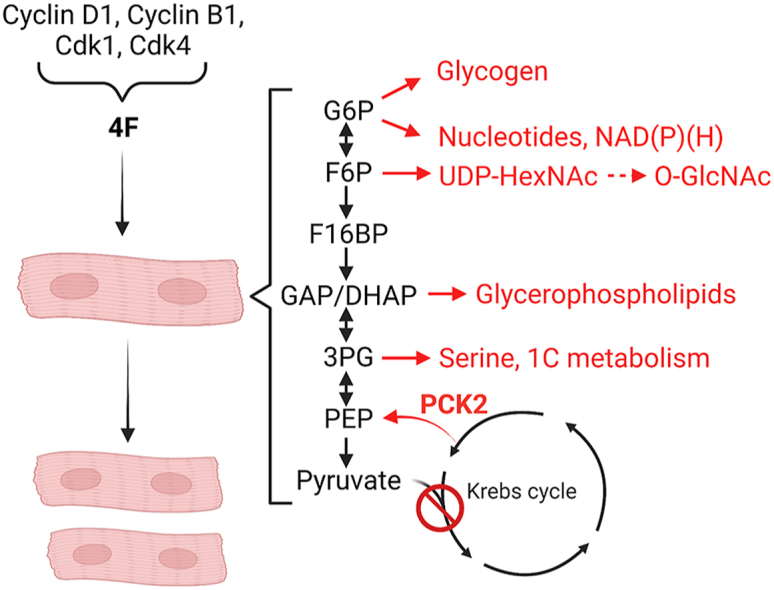
In adult mouse cardiomyocytes and human induced pluripotent stem cell cardiomyocytes (hiPS-CMs), cell cycle initiation by ectopic expression of Cyclin B1, Cyclin D1, CDK1, and CDK4 (termed 4F) downregulated oxidative phosphorylation genes and upregulated genes that regulate ancillary biosynthetic pathways of glucose metabolism. Results from metabolic analyses and stable isotope tracing experiments indicate that 4F-mediated cell cycle induction in hiPS-CMs decreases glucose oxidation and oxidative phosphorylation and augments NAD+, glycogen, hexosamine, phospholipid, and serine biosynthetic pathway activity. Interventions that diminish NAD+ synthesis, serine synthesis, or protein O-GlcNAcylation decreased 4F-mediated cell cycle entry. In a gain of function approach, we overexpressed phosphoenolpyruvate carboxykinase 2 (PCK2), which can drive carbon from the Krebs cycle to the glycolytic intermediate pool, and found that PCK2 augments 4F-mediated cell cycle entry.
Conclusions
These findings suggest that a metabolic shift from catabolic to anabolic activity is a critical step for cardiomyocyte cell cycle entry and is required to facilitate proliferation.
Graphical abstract
1. Introduction
Successful cardiac repair involves coordinated remodeling of the extracellular matrix (ECM), neovascularization, and cardiomyocyte repopulation. In the early developmental phases of mammals, these events harmonize to promote complete cardiac regeneration after injury. For example, apical resection or infarction during the first two days after birth leads to cardiac regeneration via a robust proliferative response of pre-existing cardiomyocytes [1,2], similar to that observed in amphibians and zebrafish [[3], [4], [5], [6], [7]]. Robust cardiomyogenesis in the early neonatal period also appears to occur in humans, as suggested by a case report in a newborn human patient with myocardial infarction [8]. Unfortunately, the capacity for cardiomyocyte cytokinesis is lost in mammals by day 4 after birth. After this time, the cardiac repair response appears limited to replacement fibrosis [1,9] and modest vascular remodeling [10,11], suggesting that the recalcitrance of the adult myocardium to regenerate is caused in part by insufficient cardiomyocyte proliferation. Attempts to augment cardiomyocyte proliferation have had limited success, and progress is limited by our poor understanding of the biology of cardiomyocyte division.
Several studies have indicated that metabolism is a regulatory feature of cardiomyocyte proliferation. Glycolysis [12,13], glucose and fatty acid oxidation [14,15], fatty acid synthesis [16], and the mevalonate pathway [17] influence myocyte proliferation, yet the different metabolic reprogramming steps that are essential for cardiomyocyte proliferation remain unclear. Studies in cancer cells show that although ATP is required for normal homeostasis, proliferating cells also exhibit increased requirements for anabolic metabolism [18]. Such metabolic reprogramming is consistent with the need in daughter cells for biomass to form the building blocks for cell membranes, proteins, RNA and DNA. In most proliferating cells, glucose and glutamine contribute most to the core metabolic functions that support proliferation; however, recent studies indicate that other substrates, including branched chain amino acids, lactate, serine, and glycine, also provide material resources required for replication [19,20]. Nevertheless, the changes in metabolism that occur when cardiomyocytes divide and how those changes influence cardiomyocyte cell cycle decisions remain unclear.
Because of the lack of efficient methods to induce cardiomyocyte proliferation, our understanding of the biochemical changes occurring with cardiomyocyte cell cycle induction has been limited to comparisons between fetal (proliferating) and adult (non-proliferating) cardiomyocytes [1,21,22]. Recently, we found that ectopic expression of Cdk1/CyclinB1 and Cdk4/CyclinD1 complexes (referred to as “4F”) promoted cell division in 15–20% of mouse and human cardiomyocytes in vitro [23]. Currently, this approach is one of the most robust methods to induce cardiomyocyte proliferation, which provides new opportunities for understanding the underlying processes that modulate cardiomyocyte cell cycle progression. A pertinent question in the field of cardiac regeneration is why all viral or in vivo transgenic approaches to induce adult cardiomyocyte proliferation, e.g., 4F [23,24], YAP [[25], [26], [27], [28]], and CyclinA2 [[29], [30], [31], [32]], promote proliferation in only a subset of cardiomyocytes. This general finding suggests that factors or conditions beyond cell cycle induction influence the probability and perpetuation of cardiomyocyte division. Because metabolic activity is thought to be a critical determinant of a cell's decision to progress through the cell cycle [33], in this study, we characterized the metabolic phenotypes of human induced pluripotent stem cell cardiomyocytes (hiPS-CMs) coaxed to enter the cell cycle via 4F expression [23] and elucidated the role of particular metabolic pathways during cell cycle progression.
2. Methods
2.1. Cell culture
The methods used in this study were performed in accordance with biosafety guidelines approved by the University of Louisville. Human iPSC cardiomyocytes (hiPSC-CMs) were purchased from Fujifilm Cellular Dynamics (cat. R1106). Cells were seeded in Plating Medium (Fujifilm Cellular Dynamics M1001) into plates coated with 0.02% gelatin (Sigma Aldrich 9000-70-8) and 0.01% fibronectin (Sigma Aldrich cat. F1141). The hiPSC-CMs were maintained for a minimum of 3–4 weeks prior to experimentation in maintenance medium (Fujifilm Cellular Dynamics cat. M1003) supplemented with 1% penicillin/streptomycin (ThermoFisher 15070063).
2.2. Adenoviral transduction
hiPSC-CMs were transduced with adenovirus at the following MOI: LacZ and 4F (Cdk1, Ccnb, Cdk4, Ccnd) 10 MOI each; NAMPT, NAMPT shRNA , control shRNA OGT, OGA, GLUT1 50 MOI, PCK2 100 MOI; Adenoviruses were removed after 24 h and replaced with maintenance medium.
2.3. Drug intervention
NCT 503 (Millipore sigma, SML 1659) and nicotinamide mononucleotide (NMN) (Cayman,16411) were diluted to 10 mM in DMSO then diluted to the required concentration in maintenance media.
2.4. Bulk RNAseq analysis
RNA from hiPS-CMs were isolated using the Qiagen, miRNeasy Micro Kit, #210874, following homogenization of the tissue in QIAzol (Qiagen). Using the Ovation RNA-seq System v2 Kit (NuGEN), total RNA (20–50 ng) was reverse transcribed to synthesize first-strand cDNA using a combination of random hexamers and a poly-T chimeric primer. The RNA template was then partially degraded by heating and the second-strand cDNA was synthesized using DNA polymerase. Double-stranded DNA was then amplified using single primer isothermal amplification (SPIA). Random hexamers were then used to linearly amplify the second-strand cDNA. cDNA samples were fragmented to an average size of 200 bp using the Covaris S2 sonicator. Libraries were made from the fragmented cDNA using the Ovation Ultralow V2 kit (NuGen).
Following end repair and ligation, the libraries were PCR amplified with 9 cycles. Library quality was assessed by a Bioanalyzer on High-Sensitivity DNA chips (Agilent) and concentration was quantified by qPCR (KAPA). The libraries were sequenced on a HiSeq 2500 sequencer with a single-read, 50-cycle sequencing run (Illumina). We utilized the RNAseq-analysis pipeline reported previously [34]. For the readers' convenience and completeness of the current manuscript, we review the important steps/features and/or statistics of the pipeline below. Known adapters and low-quality regions of reads were trimmed using Fastq-mcf (http://code.google.com/p/ea-utils). Sample QC was assessed using FastQC (http://www.bioinformatics.babraham.ac.uk/projects/fastqc/). Reads were aligned to either the mouse genome (for MADM mouse studies) or the human genome (for human iPS-CMs). Finally, we calculated differential expression P-values using edgeR 8. Here, we first filtered out any genes without at least two samples with a CPM (counts per million) between 0.5 and 5000. CPMs below 0.5 indicates nondetectable gene expression, and CPMs above 5000 are are commonly observed for mitochondrial-encoded genes. If these high-expression genes were not excluded, their counts would disproportionately affect the normalization. After excluding these genes, we renormalized the remaining ones using “calcNormFactors” in edgeR, then calculated P-values for each gene with differential expression between samples using edgeR's assumed negative–binomial distribution of gene expression. We calculated the false discovery rates (FDRs) for each P-value with the Benjamini-Hochberg method 9 based on the built-in R function “p.adjust”.
2.5. Stable isotope resolved metabolomics
Human iPSC-CMs cells were plated at 300,000 cells per well in a 6-well plate then transduced with adenovirus as described above. After 24 h, the cells were incubated in medium containing 11 mM 13C6-glucose (Sigma Aldrich 389374) for 3, 8, or 16 h in RPMI 1640 media (Gibco 11879–020) for 16 h. Media in both treatments was supplemented with B27 supplement (ThermoFisher 17504044) and penicillin/streptomycin (ThermoFisher 15070063). Metabolism was quenched and metabolites were extracted in an ice-cold acetonitrile:water:chloroform solution at a final ratio of 2:1.5:1 [35,36]. Polar fractions were lyophilized using a Freezone 2.5L −84 °C benchtop freeze dryer (Labconco, Kansas City, CO, USA). The dried sample was reconstituted in 100 μl 20% acetonitrile and used for LC-MS analysis.
2.6. LC-MS analysis
All samples were analyzed on a Thermo Q Exactive HF Hybrid Quadrupole-Orbitrap Mass Spectrometer with a Thermo DIONEX UltiMate 3000 HPLC system (Thermo Fisher Scientific, Inc., Germany). Separation was performed in parallel mode on a reversed phase (RP) Waters ACQUITY UPLC HSS T3 column (150 × 2.1 mm i.d., 1.8 μm, part number: 186003540) and a hydrophilic interaction chromatography (HILIC) Thermo Accucore HILIC column (100 × 3 mm i.d., 2.6 μm, part number: 17526–103030). The temperature of both columns was set to 40 °C. The HILIC column was operated as follows: mobile phase A was 10 mM ammonium acetate (pH adjusted to 3.25 with acetate) and mobile phase B was acetonitrile. The gradient was: 0 min, 100% B; 0–5 min, 100% B to 35% B; 5–12.7 min, 35% B; 12.7–12.8 min, 35% B to 95% B; 12.8–14.3 min, 95% B. The flow rate was set 0.3 mL/min. For the RP column, the mobile phase A was water with 0.1% formic acid and mobile phase B was 100% acetonitrile. The gradient was as follows: 0 min, 0% B; 0–5 min, 0% B; 5–6.1 min, 0–15% B; 6.1–10 min, 15–60% B; 10–12 min, 60% B; 12–14 min, 60%–100% B; 14–14.1 min, 100%–5% B; 14.1–16 min, 5% B. The flow rate was 0.4 mL/min.
The electrospray ionization probe was fixed at level C. The parameters for the probe were set as follows: sheath gas = 55 arbitrary units, auxiliary gas = 15 arbitrary units, sweep gas = 3 arbitrary units, spray voltage = 3.5 kV, capillary temperature = 320 °C, S-lens RF level = 65.0, auxiliary gas heater temperature = 450 °C. The method of mass spectrometer was set as follows: full scan range = 50 to 750 (m/z); resolving power R = 30,000 at m/z = 200, 10% valley; maximum injection time = 50 ms; automatic gain control (AGC) = 106 ions for both positive and negative modes.
Unlabeled samples were analyzed in full MS scan and data-dependent MS/MS modes, while the labeled specimens were only analyzed in full MS mode. The LC methods and electrospray ionization conditions were set as follows: for full MS scan, scan range = 50–750 (m/z), R = 30,000 at m/z = 200, 10% valley, maximum injection time = 50 ms, automatic gain control (AGC) = 106 ions; for data dependent MS/MS scan, R = 15,000, maximum injection time = 100 ms, automatic gain control (AGC) = 5 × 10⁴, loop count = 6, isolation window = 1.3 m/z, dynamic exclusion time = 1.2 s, the collision energy was set 10, 20, 40, 60 and 150 eV, respectively.
2.7. Stable isotope data analyses
Full MS.raw files were first converted to.mzML format with msConvert tool, a part of an open-source ProteoWizard suite, described in detail by Adusumilli and Mallick [37]. Isotopologue peak deconvolution and assignments were performed using El-MAVEN. Peaks were assigned using a metabolite library first generated and verified using full scan MS and MS/MS spectra of unlabeled samples, as described previously [38,39]. The library contained metabolite names and corresponding molecular formulae used for generation of theoretical m/z values for all possible isotopologues, and retention times for each entry. The El-MAVEN parameters for compound library matching were as follows: EIC Extraction Window ±7 ppm; Match Retention Time ±0.60 min. For 13C isotopologue peak detection, the software criteria were set as follows: Minimum Isotope-parent correlation 0.5; Isotope is within 7 scans of parent; Abundance threshold 1.0; Maximum Error To Natural Abundance 100%. All assignments were visually inspected and compared to unlabeled samples for reference. Any peak groups assigned in error, e.g. not present or having different retention time than in the unlabeled samples, were deleted and correct peak assignments were added manually. Finally, the peak list with corresponding abundances was exported to a comma-separated (.cvs) file and uploaded to the Polly workflow to perform natural abundance correction and to calculate total pool size for each metabolite (by summing peak areas of each detected isotopologue) using Polly Isocorrect. Finally, the data were analyzed and plotted with GraphPad Prism 9.0 (GraphPad Software, San Diego, CA, USA).
2.8. Extracellular flux analysis
Mitochondrial activity in hiPS-CMs was measured using a Seahorse XF96e analyzer (Agilent) [40]. hiPSC-CMs were plated at 20k per well in a 96-well XF plate. XF media was prepared using phenol red- and sodium bicarbonate-free DMEM (Corning 90-113-PB) supplemented with 11 mM glucose (Sigma Aldrich G7528), 1 mM pyruvate (Sigma Aldrich P5280), and 4 mM glutamine (Corning 61-030-RO). The basal oxygen consumption rate was normalized to protein content.
2.9. Lucid RESIPHER
hiPS-CMs cells were plated in a 96-well plate at discrete densities and 10,000–30,000 cells per well was found to be optimal. These cells were transduced with LacZ or 4F adenovirus as described above. Oxygen consumption rate was monitored throughout maturation and transduction using a RESIPHER real-time cell analyzer (Lucid). Data were monitored in real-time, exported from aaq.lucidsci.com, and analyzed using GraphPad Prism v9. OCR values were normalized to baseline and LacZ control.
2.10. Tritiated glucose catabolism assay
hiPS-CMS were transduced with 4F or LacZ adenoviruses for 48 h. The media was then changed with a culture medium containing 1 μCi/ml [5-3H]-glucose (Moravek Biochemicals, Brea, CA, USA) for glucose utilization assay, as described previously [36]. Following incubation for 4 h, 100 μl of media was added to a cap-less microcentrifuge tube containing 100 μl of 0.2 N HCl. Then the tube was placed in a scintillation vial containing 500 μl of dH2O to allow for evaporation diffusion of [3H]2O at 37 °C for 72 h. Then, the microcentrifuge tubes were removed from the scintillation vials, and 10 ml of scintillation fluid were added. Scintillation counting was performed using a Tri-Carb 2900 TR Liquid Scintillation Analyzer (Packard Bioscience Company, Meriden, CT, USA). Glucose utilization was then calculated, with considerations for the specific activity of [5-3H]-glucose, incomplete equilibration and background, dilution of [5-3H]-to unlabeled-glucose, and scintillation counter efficiency. Data were normalized to protein content.
2.11. Immunocytochemistry and EdU incorporation
hiPS-CMs were fixed in 4% formaldehyde for 20 min (Thermos Scientific Cat#28908). Fixed cells were washed three times with PBS. The fixed cells were permeabilized with 0.1% Triton X-100 for 15 min (Milipore Cat# 55163804), and then blocked with 3% bovine serum albumin (BSA) in PBS for 60 min at room temperature (VWR Cat# 0332). The cells were then probed with Mouse Monoclonal Cardiac Troponin T Antibody (Thermos Fisher, MA5-12960) and rabbit monoclonal Anti-Histone H3 (phospho S10) antibody - ChIP Grade (Abcam; ab5176) primary antibody (1:200 in 1% BSA) for 1.5 h. Then washed with three time with PBS. Then labeled with Goat anti-Mouse IgG (H + L), FITC (Thermos fisher, A16079) and Texas Red Goat anti-Rabbit IgG (H + L) (Thermos fisher, T-6391) secondary fluorescent antibody respectively (1:200 in 1% BSA). Cells were then washed three times with PBS and stained with DAPI 1 μg/ml (Biotium Cat# 40043) to stain the nucleolus blue. For EDU detection, the cells were also treated with 5 μM 5-ethyl-2-deoxyuridine (EDU) for the course of the experiment which will incorporate in the newly synthesized DNA. After fixation, permeabilization and blocking of the cells the EDU incorporation was visualized using Click it EDU-Alexa-Flour647 imaging kit (Thermo Fisher, C10340). Imaging was conducted for the whole well using the high content imaging instrument, Cytation 1. The percentage of co-localization of PHH3, EDU, Troponin-T was quantified using Gen 5.05 software.
2.12. NAD(H) measurements
NAD and NADH levels were measured using a colorimetric assay kit (Abcam 65348). In addition, the NADH/NAD ratio was measured using the NADH-sensitive cytoplasmic sensor, Peredox-mCherry [41]. Briefly, hiPS-CMs were transduced with adenoviruses to express Peredox-mCherry and 4F or LacZ for 48 h, followed fluorescent measurements of mCherry and T-sapphire using the Keyence Imaging platform and BZ-X800 software. The ratio of NADH/NAD was calculated as instructed in Ref. [41].
2.13. Immunoblotting
The hiPS-CMs were lysised in RIPA lysis buffer (VWR, N653) plus 1% Halt™ Protease and Phosphatase Inhibitor Cocktail (Thermofisher scientific, 78440). The protein was denatured at 95 °C for 5 min and separated by 4–12% Bis Tris gel (Invitrogen, NW64120) and blotted onto PVDF membranes (Invitrogen, IB401001). Blots were blocked with 3% bovine serum albumin (BSA) in Tris Buffered Saline (TBS) at room temperature for 1.5 h (VWR Cat# 0332). The blots were then incubated overnight at 4 °C with primary antibody (1:1000 in 1% BSA). Then washed three time with TBST, and labeled with secondary antibody (1:2500 in 1% BSA). The blots were then stripped with stripping buffer (Thermos scientific, 46428) for 15 min at RT. The blots were then probed with Recombinant HRP Anti-GAPDH antibody [EPR16891] (Abcam, ab201822). The image was captured by ChemiDoc imaging system and analyzed with ImageJ software. The antibodies used in this study are found in Supplementary Table 2.
2.14. Statistical analyses
Graphpad prism 9.01 software was utilized to carry out statistical analysis. All data were presented as mean ± standard deviation (SD). The difference between groups was judged using t-test or one-way ANOVA, where appropriate. For stable isotope enrichment results, the fractional enrichment data for each metabolite were subjected to Logit transformation to provide log-odds values, which were then used for t-test. A p value < 0.05 was considered statistically significant.
3. Results
3.1. Transcriptional changes associated with cell cycle induction in cardiomyocytes
We previously showed that simultaneous ectopic expression of four human cell cycle genes (CDK1, CDK4, CCNB and CCND; 4F) induces cardiomyocyte proliferation in vitro and in vivo [23]. To determine how metabolic pathways may change in vivo after 4F-mediated induction of cardiomyocyte proliferation, we first mined transcriptomics data from cardiomyocytes isolated from hearts of MADM lineage tracing mice (from Ref. [23]), which identifies cardiomyocytes that have proliferated based on the presence of a single color (red or green) or that are not likely to have proliferated based on the presence of both red and green colors (double color). As shown in Supplementary Fig. 1, single-colored cells showed decreased levels of transcripts related to fatty acid oxidation and increased transcripts of numerous enzymes related to several ancillary biosynthetic pathways, suggesting that marked metabolic remodeling occurs with myocyte proliferation.
To examine this phenomenon further, we chose hiPS-CMs as a model to understand how metabolism might influence cardiomyocyte proliferation. We infected 60-day-old, mature hiPS-CMs with either LacZ (control) or 4F adenovirus, and, 48 h later, measured EDU, which marks new DNA synthesis, and phosphohistone H3 (PHH3), which marks cells in the G2/M phase of the cell cycle. As predicted from our previous studies [23], expression of 4F markedly increased pHH3 and EDU positivity (Fig. 1A and B). To determine how gene expression changes with cell cycle stimulation, we overexpressed 4F and examined gene transcript abundance by RNAseq. As shown in Fig. 1C, multivariate analysis suggested striking differences in the transcriptome caused by 4F expression. Compared with LacZ controls, overexpression of 4F promoted prominent decreases in the expression of transcripts related with the Krebs cycle, oxidative phosphorylation, amino acid oxidation, and fatty acid oxidation (Fig. 1D). In contrast, stimulation of the cell cycle with 4F increased expression of biosynthetic pathway enzymes, such as those involved in NAD(P)+ synthesis (NAMPT, NADK1, NNT), the hexosamine biosynthetic pathway (HBP) and protein O-GlcNAcylation (GFPT1, OGT, OGA), and the serine biosynthesis pathway (SBP; PHGDH, PSAT1, SHMT2) (Fig. 1D), a finding that largely phenocopies findings from the 4F viral administration in vivo (see Supplementary Fig. 1). These results suggest that cycling myocytes downregulate oxidative metabolism and upregulate enzymes important for biosynthesis.
Fig. 1.

Cell cycle induction in cardiomyocytes is associated with significant alteration in the expression of metabolic genes. (A) Representative images of hiPS-CMs treated with LacZ or 4F adenoviruses for 48 h, and immuno-stained for troponin-T (green), PHH3 (red), and EDU (gray), scale bar = 200 μm. (B) Quantification of percentage increase in cell cycle markers (PHH3 and EDU) (n = 3 independent experiments conducted in duplicate, ***P < 0.001 , Student's t-test was used). (C) Principal component analysis (PCA) of RNA-seq data from hiPS-CMs infected with either LacZ (control) or 4F for 48 (n = 3). (D) Row normalized Z score heatmap of the top 50 differentially expressed genes related to metabolism (n = 3 per group). (For interpretation of the references to color in this figure legend, the reader is referred to the Web version of this article.)
3.2. Stimulation of the cell cycle is associated with marked changes in metabolism
To determine how inducing the cardiomyocyte cell cycle affects intermediary metabolism, we transduced hiPS-CMs with 4F or LacZ adenoviruses and measured the relative abundance of intermediary metabolites by LC/MS/MS. As shown in Supplementary Figs. 2A and 2B, partial least squares-discriminant analysis (PLS-DA) and variable importance in projection (VIP) score analysis of a library containing 83 metabolites of central carbon metabolism demonstrate clear discrimination between the LacZ and 4F groups. Group separation was driven mostly by 4F-mediated increases in glycogen intermediates, glycolytic intermediates, and Krebs cycle metabolites (e.g., UDP-hexose; hexose; fructose 1,6-bisphosphate, F16B; aconitate; 2-oxoglutarate; citrate) and intermediates in phospholipid (CDP-ethanolamine) and pyrimidine (orotate) synthesis. Also important for group separation were the levels of some amino acids (e.g., proline, alanine, asparagine), NAD+, and cyclic ADP-ribose, which decreased in 4F-transduced cells. Heatmap analysis of the top 50 statistically different metabolites suggests that 4F expression changes numerous ancillary pathways of glucose metabolism, including the pentose phosphate pathway and the purine and pyrimidine biosynthetic pathways (e.g., erythrose 4-phosphate, adenine, uracil), the hexosamine biosynthetic pathway (UDP-HexNAc), and the serine biosynthesis pathway and one-carbon metabolism (serine, S-adenosylmethionine) (Supplementary Fig. 2C). To determine which pathways were likely affected most by 4F, we performed pathway analysis using the list of significantly different metabolites shown in Suppl. Table 1. As shown in Supplementary Fig. 2D, pathway impact appears driven by changes in glycine, serine and threonine metabolism, glycoxylate and dicarboxylate metabolism, the TCA cycle, aminosugar and nucleotide metabolism, and alanine, asparate and glutamate metabolism.
3.3. Cardiomyocyte cell cycle induction decreases oxygen consumption and glucose catabolism
Because our metabolomics results suggest changes in Krebs cycle metabolites and glucose-derived intermediates, we next examined mitochondrial metabolism by respirometry and by tracking the fate of labeled glucose. After 48 h of transduction of hiPS-CMs with LacZ or 4F, we found by extracellular flux analysis lower rates of oxygen consumption (OCR) (Fig. 2A). Continuous tracking of OCR after viral addition using RESIPHER technology suggest that 4F-mediated decreases in OCR commence ~30 h after addition of 4F (Fig. 2B). Furthermore, using tritiated glucose assay, we found that 4F expression decreases glycolytic activity (Fig. 2C).
Fig. 2.

Stimulation of the cell cycle decreases glucose catabolism in cardiomyocytes. hiPSC-CMs were transduced with 4F or LacZ adenovirus and mitochondrial metabolism was measured by respirometry and stable isotope resolved metabolomics. (A) Basal oxygen consumption rate (OCR) in hiPSCMs 48 h after viral transduction. Data represent three independent experiments. *p < 0.05; (B) Baselined oxygen consumption values measured using RESIPHER technology before and after LacZ or 4F adenoviral infection. Inset: Relative OCR values at 48 h after viral transduction. n = 7–8 technical replicates per group. ****p < 0.0001; (C) Glycolytic activity measured using 5-3H-glucose assay. Data represent three technical replicates per group. *p < 0.05; (D–H) Fractional enrichment (FE) and relative abundance of metabolic intermediates: Twenty-four h after viral transduction, hiPSC-CM maintenance medium was supplanted with medium containing 13C6-glucose. After 16 h, metabolites were extracted and fractional enrichment of individual isotopologues (m + x) and relative abundance were measured by LC/MS/MS. Bolded metabolites represent those measured in this study. For FE, total enrichment values were subjected to Logit transformation, followed by t-test; significance is denoted by asterisks above fractional enrichment plots. For relative metabolite abundance, Student's t-test was used. n = 3 replicates per group. *p < 0.05, **p < 0.01.
Because a decrease in mitochondrial oxygen consumption and lower glycolytic activity could alter the fate of glucose, especially in cardiomyocytes [42], we next examined 13C metabolite enrichment in hiPS-CMs transduced with the LacZ or 4F adenoviruses. Twenty-four hours after transduction with virus, the medium was exchanged for medium containing 13C6-glucose, and the cells were allowed to incubate for 16 h followed by metabolite extraction and assessment of 13C fractional enrichment (FE) by LC/MS/MS. As shown in Fig. 2D–H, TCA cycle intermediate levels trended higher in 4F-transduced cells compared with LacZ controls, with significantly higher levels of citrate and α-ketoglutarate. Despite their higher abundance, glucose-derived 13C enrichment was lower in all TCA metabolites detected. These data indicate that, in cycling cardiomyocytes, the contribution of glucose to mitochondrial metabolism is diminished. Collectively, these data suggest that oxygen consumption and glucose oxidation are diminished during cardiomyocyte cell cycle stimulation.
3.4. Cell cycle stimulation increases biosynthetic pathway activity stemming from glucose 6-phosphate
Metabolites of glucose metabolism comprise several amphibolic metabolites that can enter into ancillary biosynthetic pathways for synthesis of cellular building blocks and for regulation of redox balance [40,42]. In particular, glucose 6-phosphate (G6P), fructose 6-phosphate (F6P), dihydroxyacetone phosphate (DHAP), 3-phosphoglycerate (3 PG), and 2-phosphoglycerate (2 PG) lie at metabolic branchpoints between glycolysis and biosynthetic pathways. As shown in Fig. 3A, G6P can be used to make glycogen through the glycogen synthesis pathway or to make purines, pyrimidines, and NAD+. To determine how stimulation of the cell cycle regulates the fate of glucose-derived carbon into these ancillary biosynthetic pathways, we measured incorporation of 13C derived from 13C6-glucose. Although fractional enrichment (FE) and the levels of pentose phosphate pathway intermediates (e.g., erythrose 4-phosphate; E4P) and end products of nucleotide biosynthesis (AMP, UMP) were unchanged (Fig. 3B–D), cell cycle stimulation with 4F increased enrichment of 13C into NAD+, especially the m+5 isotopologue, which corresponds with ribose incorporation; however, NAD+ abundance was diminished by more than 50% (Fig. 3E), which suggests that NAD+ biosynthesis is elevated but its utilization may outstrip its formation. Similar to NAD+, we found that the FE of 13C glucose into the glycogen synthesis intermediate, UDP-hexose, was higher in cells transduced with 4F; however, unlike NAD+, the relative abundance of UDP-hexose was higher (Fig. 3F), which could suggest either higher rates of glycogen synthesis or decreased glycogenolysis. These findings indicate that stimulation of the cardiomyocyte cell cycle influences ancillary biosynthetic pathways branching from G6P.
Fig. 3.

Activation of the cell cycle markedly affects NAD+ and glycogen metabolism. Stable isotope resolved metabolomics analysis of metabolites and endproducts of the pentose phosphate, nucleotide synthesis, and glycogen synthesis pathways: (A) Simplified schematic of pathways branching from G6P. Bolded metabolites are those measured in this study. (B–F) 13C fractional enrichment (FE) and relative abundance of: erythrose 4-phosphate, E4P; adenosine monophosphate, AMP, uridine monophosphate, UMP; nicotinamide adenine mononucleotide, NAD+; and uridine diphosphate-hexose, UDP-hexose. Twenty-four h after viral transduction, hiPSC-CM maintenance medium was supplanted with medium containing 13C6-glucose. After 16 h, metabolites were extracted and fractional enrichment of isotopologues (m + x) and relative abundance were measured by LC/MS/MS. For FE, total enrichment values were subjected to Logit transformation, followed by t-test; significance is denoted by asterisks above fractional enrichment plots. For relative metabolite abundance, Student's t-test was used. n = 3 replicates per group. *p < 0.05, **p < 0.01, ****p < 0.001.
3.5. Influence of cardiomyocyte cell cycle entry on HBP activity and protein O-GlcNAcylation
UDP-N-acetyl hexosamines such as UDP-GlcNAc and UDP-GalNAc, collectively referred to as UDP-HexNAc, are used as glycosyl donors for O-linked (and N-linked) glycosylation reactions. Synthesis of UDP-HexNAc requires end products or intermediates from several metabolic pathways, including F6P from glycolysis (Fig. 4A). To determine how cell cycle stimulation affects glucose-derived carbon allocation into the hexosamine biosynthetic pathway (HBP), we measured 13C fractional enrichment in hiPSC-CMs transduced with 4F or LacZ virus. After 16 h of 13C6-glucose incubation, >75% of the UDP-HexNAc pool integrated 13C-glucose-derived carbon, with 4F-transduced hiPS-CMs displaying significantly higher levels of 13C incorporation than LacZ-transduced cells. Stimulation of cell cycle activity also increased the relative abundance of UDP-HexNAc (Fig. 4B). Because UDP-GlcNAc is a precursor for protein O-GlcNAcylation and because OGT transcripts were higher in 4F-transduced cells (see Fig. 1), we next examined levels of protein O-GlcNAcylation in 4F and LacZ-transduced iPSC-CMs. As shown in Fig. 4C, despite higher levels of 13C incorporation into the HBP and higher UDP-HexNAc levels, stimulation of the cell cycle with 4F decreased levels of O-GlcNAcylated proteins, which may suggest dynamic cycling of O-GlcNAc protein modifications [43]. Collectively, these results suggest that stimulation of the cardiomyocyte cell cycle augments HBP flux and alters protein O-GlcNAc levels.
Fig. 4.

Cardiomyocyte cell cycle entry is associated with changes in hexosamine biosynthetic pathway activity and protein O-GlcNAcylation. Stable isotope resolved metabolomics analysis of UDP-HexNAc: (A) Simplified schematic of contribution of F6P to UDP-N-acetyl hexosamine formation. (B) Fractional enrichment (FE) of 13C glucose and relative abundance of UDP-HexNAc. Twenty-four h after viral transduction, hiPSC-CM maintenance medium was supplanted with medium containing 13C6-glucose. After 16 h, metabolites were extracted and fractional enrichment of isotopologues (m + x) and relative abundance were measured by LC/MS/MS. n = 3 replicates per group. *p < 0.05. For FE, total enrichment values were subjected to Logit transformation followed by t-test; significance is denoted by asterisks above fractional enrichment plots. For relative metabolite abundance, Student's t-test was used. (C) Protein O-GlcNAcylation in 4F- and LacZ-infected cells 24, 48, 72 h after transduction. n = 3 independent experiments, *p < 0.05, **p < 0.01, two-way ANOVA with Tukey's post-test.
3.6. Stimulation of cardiomyocyte cell cycle alters pathways associated with serine and phospholipid synthesis
Glycolytic intermediates provide critical precursors for glycerophospholipid and amino acid synthesis. For example, phosphatidylethanolamine is one of the most abundant phospholipids in mammalian cell membranes and requires CDP-ethanolamine for headgroup biosynthesis and esterification [44]. Glycerol 3-phosphate (G3P), stemming from dihydroxyacetone phosphate (DHAP) or from 2-phosphoglycerate (2 PG)-engendered glycerate, provides the glycerol backbone for phosphatidic acid formation, to which are esterified fatty acyl chains and phospholipid headgroups. Both 3-phosphoglycerate (3 PG) and 2 PG can provide carbons for serine biosynthesis (Supplementary Fig. 3A). To determine whether stimulation of the cell cycle influences these pathways, we examined 13C-glucose derived carbon allocation into CDP ethanolamine, glycerate, and serine. hiPS-CMs transduced with 4F showed higher relative abundance of CDP-ethanolamine and nearly 50% higher 13C incorporation from 13C6-glucose compared with LacZ-transduced cells. The increase in enrichment in CDP-ethanolamine comprised mostly the m+5 isotopologue derived from PPP-derived ribose 5-phosphate (Supplementary Fig. 3B). We found that glycerate, which could contribute to the phosphoglycerol backbone, also had higher 13C enrichment and relative abundance in 4F-transduced cells (Supplementary Fig. 3C); similar results were found with serine (Supplementary Fig. 3D). Collectively, these data suggest that cell cycle stimulation may activate the glycerophospholipid and serine biosynthetic pathways.
3.7. NAD(H) biosynthesis is important for cell cycle progression in cardiomyocytes
To determine how the NAD(H) synthesis affects myocyte cell cycle progression, we overexpressed NAMPT or knocked it down by expressing NAMPT shRNA in hiPS-CMs 48 h prior to LacZ or 4F transduction (Supplementary Figs. 4A and B). Although overexpression of NAMPT did not affect these markers in the presence or absence of 4F (Supplementary Fig. 5), NAMPT knock down decreased PHH3 and EDU staining in 4F-transduced hiPS-CMS (Fig. 5). As a pharmacological approach, we also treated LacZ and 4F-transduced hiPS-CMs with nicotinamide mononucleotide, which augmented PHH3 staining in 4F-infected cells but did not further increase EDU staining (Supplementary Fig. 6). These data suggest that NAD(H) biosynthesis is important for augmenting cardiomyocyte entry into the cell cycle.
Fig. 5.

NAD+ synthesis is essential for cardiomyocyte cell cycle progression. (A) Representative images of hiPS-CMs transduced with Control ShRNA, ShRNA NAMPT for 48 h then treated with 4F or LacZ control for 48 h, and immuno-stained for troponin-T (green), DAPI (blue), PHH3 (red), EDU (gray) (scale bar = 200 μm). (B) Quantification of percentage increase in cell cycle markers (PHH3 and EDU). n = 3 independent experiments. *p < 0.05, ***p < 0.001, one-way ANOVA with Tukey's post-test. (For interpretation of the references to color in this figure legend, the reader is referred to the Web version of this article.)
3.8. O-GlcNAcylation is required for 4F-induced cardiomyocyte cell cycle entry
To investigate the role of O-GlcNAcylation during cardiomyocyte proliferation, we transduced hiPS-CMs with adenoviruses to overexpress O-GlcNAc transferase (OGT) or O-GlcNAcase (OGA) 48 h prior to LacZ or 4F transduction. Although 4F increased transcript levels of OGA and OGT (see Fig. 1D), protein levels of these enzymes were not significantly changed by 4F (Supplementary Fig. 7A). Nevertheless, as expected, overexpression of OGT or OGA increased or decreased protein O-GlcNAcylation, respectively (Supplementary Fig. 7B). Although OGT overexpression did not significantly affect proliferation markers in the presence or absence of 4F, OGA overexpression completely abolished 4F-mediated increases in PHH3 and EDU staining (Fig. 6A and B). These data suggest that OGA-mediated regulation of O-GlcNAc post-translational modifications is required for cardiomyocyte cell cycle entry.
Fig. 6.

Protein O-GlcNAcylation is required for cardiomyocyte cell cycle entry. (A) Representative images of hiPS-CMs transduced with LacZ control, OGT, or OGA. After 48 h the cells were then transduced with 4F or LacZ adenoviruses for an additional 48 h, followed by (immuno)staining for troponin-T (green), DAPI (blue), PHH3 (red), and EDU (gray) (scale bar = 200 μm). (B) Quantification of percentage increase in cell cycle markers (PHH3 and EDU). n = 3 independent experiments, ****p < 0.0001, one-way ANOVA with Tukey's post-test. (For interpretation of the references to color in this figure legend, the reader is referred to the Web version of this article.)
3.9. Inhibition of serine biosynthesis decreases cycle progression in hiPS-CMs
To determine the significance of serine biosynthesis in cell cycle stimulation, we used the small molecule inhibitor (NCT503) [45] of the first enzyme of serine biosynthesis, 3-phosphoglycerate dehydrogenase. Provision of NCT503 dose-dependently decreased PHH3 and EDU staining in 4F-infected cells (Supplementary Fig. 8). These data suggest that activation of the serine biosynthesis pathway is important for cardiomyocyte cell cycle progression.
3.10. Augmenting carbon availability for biosynthetic reactions by ectopic expression of PCK2 enhances myocyte cell cycle entry
As indicated above, activation of ancillary biosynthetic pathways derived from glycolytic metabolites seems essential for cell cycle progression in cardiomyocytes. Because glucose is a carbon source for these biosynthetic pathways [42,46], we next determined whether increasing glucose availability or uptake influences hiPS-CM cell cycle progression. Five days prior to 4F or LacZ transduction, the medium was switched to media containing 5 mM, 11 mM, or 25 mM glucose. Then, 48 h after 4F or LacZ transduction, we assessed cell cycle induction through PHH3 and EDU staining. We found that alteration of glucose concentration in the culture media did not affect cell cycle markers in presence of 4F (Supplementary Fig. 9). Alternatively, we attempted to increase glucose uptake by cardiomyocytes through overexpression of the glucose transporter 1 (Glut1) in hiPS-CMs (Supplementary Fig. 4C). This approach was recently shown to promote neonatal heart regeneration in mice [47]; however, in human iPS-CMs, overexpression of Glut1 did not influence cell cycle progression under control (LacZ) or 4F-stimulated conditions (Supplementary Fig. 9).
Another way to increase glycolytic intermediate availability is via gluconeogenic pathways. In particular, phosphoenolpyruvate carboxykinase (PCK) can catalyze conversion of oxaloacetate to phosphoenolpyruvate, thereby supplementing the glycolytic intermediate pool [48]. Therefore, we overexpressed the mitochondrial form of PCK, i.e., PCK2, in hiPS-CMs (Supplementary Fig. 4D) and determined how it affects 4F-triggered cell cycle induction. Interestingly, PCK2 expression further increased PHH3 and EDU positivity in hiPS-CMs transduced with 4F (Fig. 7).
Fig. 7.

Overexpression of PCK2 promotes myocyte cell cycle progression. (A) Representative images of hiPS-CMs transduced with LacZ, PCK2, 4F, 4F + PCK2 and (immuno)stained for troponin-T (green), DAPI (blue), PHH3 (red), and EDU (gray) (scale bar = 200 μm). (B) Quantification of cell cycle markers (PHH3 and EDU). n = 3 independent experiments. *p < 0.05 vs. LacZ, one-way ANOVA with Tukey's post-test. (For interpretation of the references to color in this figure legend, the reader is referred to the Web version of this article.)
Because we found that ectopic expression of the 4F depleted intracellular levels of NAD(H), which may limit cell cycle progression, we next assessed whether overexpression of PCK2 influences NAD(H) abundance after LacZ or 4F transduction. We found by colorimetric assay that overexpression of PCK2 prevented NAD(H) depletion caused by 4F-mediated stimulation of the cell cycle (Supplementary Figs. 11A and B). To confirm these biochemical findings, we expressed NADH-sensitive Peredox-mCherry biosensors [49,50] and then assessed the NAD(H) redox state of cardiomyocytes transduced with LacZ, 4F, and 4F + PCK2 adenoviruses. The reliability of this biosensor was verified by an increase in T-sapphire green fluorescence when hiPS-CMs were provided with 10 mM lactate and a decrease in T-sapphire green fluorescence in the presence of 10 mM pyruvate; the signals were normalized to a co-expressed mCherry control that is insensitive to NAD(H) redox state [41] (Supplementary Fig. 11C). In hiPS-CMs expressing 4F, we found a lower NADH/NAD ratio, which was partially rescued by expressing PCK2 (Supplementary Figs. 11D and E). Collectively, these data indicate that PCK2 augments myocyte cell cycle progression and restores NAD(H) levels in cells stimulated to proliferate.
4. Discussion
Despite progress in unveiling the biology of cardiomyocyte proliferation, our understanding of the integrated mechanisms that underlie successful cardiomyocyte cell cycle progression remains unclear. To gain knowledge of how metabolism influences the cell cycle in cardiomyocytes, we characterized the metabolic changes that occur with induction of the cell cycle and identified how biosynthetic pathways contribute to cardiomyocyte responsiveness to cell cycle stimulation. In mature hiPS-CMs, we found that ectopic expression of Cyclin B1, Cyclin D1, CDK1, and CDK4 (termed 4F) promotes cell cycle entry and is associated with downregulation of oxidative machinery and upregulation of enzymes involved in anabolic metabolism. Metabolic analysis revealed that 4F-mediated stimulation of the cardiomyocyte cell cycle decreases glucose oxidation and augments glucose-derived carbon allocation into the NAD+, glycogen, hexosamine, phospholipid, and serine biosynthetic pathways. Pathway-specific interventions to lower NAD+ synthesis, serine biosynthesis, or protein O-GlcNAcylation decreased or completely prevented cardiomyocyte cell cycle entry. Furthermore, we found that overexpression of PCK2—the metabolic function of which is to drive carbon from the Krebs cycle to the glycolytic pool—augments 4F-mediated cell cycle entry and increases NAD(H) levels. These findings elucidate the coordinated changes in metabolism during cardiomyocyte cell cycle progression and provide new metabolic pathways as targets for optimizing cardiac repair. The fact that these findings are similar to the metabolic changes that occur in cancer cells provides additional confidence in the reliability of the findings. However, this is the first demonstration of such clear metabolic reprogramming events during cell cycle progression in cardiomyocytes.
While it is clear that metabolism is tightly linked with the cell cycle [51], how metabolism regulates cardiomyocyte proliferation remains ambiguous. Recent studies suggest that glycolysis [12,13], glucose oxidation [14], succinate dehydrogenase [52], and the mevalonate pathway [17] influence myocyte proliferation; our results build upon these previous reports and develop new insights into the reprogramming of catabolic and anabolic pathways, which appear essential for myocyte division. Furthermore, we expand those findings and identify changes in ancillary biosynthetic pathways of glucose metabolism as critical regulators of cardiomyocyte cell entry. Biosynthetic pathways could influence cardiomyocyte proliferation by several means. One particularly critical roadblock to proliferation could be the capacity of myocytes to synthesize appropriate amounts of precursors for new cells: de novo synthesis of nucleotides is required for RNA and DNA synthesis and DNA repair; amino acid synthesis is required to make new proteins and enzymes; and phospholipid synthesis is needed to build membranes for daughter cells. Moreover, the pentose phosphate and serine biosynthesis pathways are important for NADPH regeneration and the NAD+ synthesis pathway may be important for sustaining adequate levels of NAD(H) for dehydrogenase reactions [53]. The ability of metabolism to convey information may also be important for cell cycle entry. For example, it remains possible that changes in NAD could influence poly(ADP-ribosyl) polymerase and sirtuin activity, thereby affecting ADP-ribosylation, acetylation, and gene transcription. Furthermore, the hexosamine biosynthetic pathway end product, UDP-GlcNAc, is required for protein O-GlcNAcylation, which has been suggested in other cell models to be important for proliferation. Nevertheless, how these pathways contribute to cardiomyocyte cell cycle entry has not been addressed. Furthermore, the fact that all pharmacological or genetic interventions occurred prior to 4F expression indicates that activation of NAD synthesis, O-GlcNAcylation, and SBP pathways are essential prerequisites for cardiomyocytes to enter the cell cycle.
Our findings suggesting that 4F decreases oxidative phosphorylation and glucose catabolism and increases the activity of several biosynthetic pathways are consistent with the idea that carbon fate is rerouted to support anabolism and growth. Although it is possible that the decrease may be due simply to lower ATP demand, transcriptomic results from cardiomyocytes transduced in vivo with 4F and from hiPS-CMs transduced in vitro suggest downregulation of many genes of oxidative metabolism. Conversely, 4F upregulated many genes in biosynthetic pathways, which suggests a coordinated restructuring of metabolic flux to direct carbon toward anabolic fates. Indeed, stable isotope resolved metabolomics revealed 4F-engendered decreases in the contribution of glucose to the Krebs cycle pool, but increased contributions to NAD+ biosynthesis, glycogen, UDP-HexNAc, and phospholipid metabolism. Notably, most of the end products or intermediates of these pathways were elevated in hiPS-CMs stimulated to enter the cell cycle; however, NAD+ showed overall lower levels in 4F-transduced cells, despite higher levels of 13C enrichment. This could be significant because highly proliferative cells, such as cancer cells, require an abundance of NAD+ [54,55], and cells preparing to divide require high levels of NAD+ to maintain the dehydrogenase reactions that regulate metabolism. Moreover, NAD+ is consumed by regulatory processes required for mitosis, such as ADP-ribosylation [56]. We posit that mature cardiomyocytes may not be primed to make sufficient amounts of NAD+ for efficient and healthy cell division. Although in our study overexpression of NAMPT was not sufficient to further augment proliferation, provision of the NAD precursor, NMN, modestly increased PHH3 positivity. Conversely, NAMPT knockdown decreased 4F-mediated cell cycle activation, which is in line with findings suggesting that low NAD biosynthesis may contribute to cell cycle arrest [57].
We also found with 4F-induced stimulation changes in the hexosamine biosynthetic pathway. Not only was 13C fractional enrichment in UDP-HexNAc higher in 4F-transduced cells, but the total pool of UDP-HexNAc was higher as well. Interestingly, O-GlcNAc levels were lower in 4F-stimulated cardiomyocytes, which could suggest an important role of O-GlcNAc cycling in proliferation [58]. It is likely that one or several targets of O-GlcNAc, which may or may not be visualized by our immunoblotting methods, contribute to cardiomyocyte cell cycle entry. Regardless, our finding that overexpression of OGA, which removes O-GlcNAc protein modifications, completely prevents 4F-mediated cardiomyocyte cell cycle entry suggests that O-GlcNAc modifications are important regulators of proliferation. This makes teleological sense given that the HBP has numerous metabolic inputs and could thus monitor levels of nutrients and environmental stressors and coordinate transcription, thereby linking metabolism with the replication machinery. Indeed, numerous studies suggest that O-GlcNAcylation is essential for mitosis in other cell types [59]; however, to our knowledge, this is the first study to show that it is critical for cardiomyocyte proliferation.
Although our analysis did not cover lipids extensively, we found that precursors for phospholipids showed higher 13C enrichment as well as higher abundance. This could indicate higher synthesis of glycerophospholipids in cardiomyocytes entering the cell cycle. Similarly, we did not extensively cover amino acids; however, we did find modestly higher enrichment of 13C in serine and modestly higher serine abundance. That an increase in the serine biosynthetic pathway is required for cardiomyocyte cell cycle entry is suggested by studies showing that a pharmacological inhibitor of PHGDH decreases PHH3 and EDU. These findings are consistent with studies in cancer cells that show that serine synthesis influences nucleotide production and redox status to influence cell proliferation [60]. Nevertheless, further studies are required to identify how phospholipid synthesis and the serine biosynthesis pathway influence cardiomyocyte proliferation.
Our study has several limitations. First, the majority of this study was conducted in hiPS-CMs, which may not necessarily mirror the adult human cardiomyocyte. Nevertheless, congruent findings in the transcriptional regulation of metabolic genes in cardiomyocytes isolated from murine hearts injected with 4F adenovirus suggest that the hiPS-CM system provides a useful model for examining mechanisms of mammalian cardiomyocyte proliferation. Moreover, critical experiments in this study used hiPS-CMs matured for 60+ days, which diminishes concerns over artifacts caused by an overly immature hiPS-CM phenotype. Another limitation concerns ambiguity of the mechanisms by which O-GlcNAc regulates cardiomyocyte proliferation. Because O-GlcNAc modifies numerous proteins it is possible that several proteins must be modified to integrate metabolism with the transcriptional machinery to promote cell cycle entry. Future experiments that identify O-GlcNAc-modified proteins are needed to elucidate the role of O-GlcNAc in cell cycle progression. In addition, our study did not investigate cytokinesis and focused mainly on how metabolism regulates cell cycle entry and progression. Thus, it is possible that the metabolic changes identified here are important only to G2/M transition and DNA replication; however, as shown in our previous studies, transduction with 4F not only induces cell cycle entry but also promotes cytokinesis [23]. Future studies using tools to examine genuine cytokinesis would provide further information on which pathways may control the latter steps of cell division. Last, it would be informative in future studies to delineate further the biosynthetic pathways influenced by PCK2, in addition to NAD metabolism. Such studies would likely involve stable isotope-resolved metabolomics using 13C-labeled gluconeogenic substrates.
In summary, the results of this study suggest that cardiomyocytes stimulated to proliferate downregulate oxidative phosphorylation genes and upregulate genes that regulate ancillary biosynthetic pathways of glucose metabolism. Furthermore, we found that cell cycle stimulation augments biosynthetic pathway activity, which suggests metabolic remodeling to accommodate not only building block requirements, but metabolic signaling as well. Interventions that decrease NAD+ or serine synthesis or that lower protein O-GlcNAcylation decreased or completely prevented 4F-mediated cell cycle entry. We also found that the expression of phosphoenolpyruvate carboxykinase augments cell cycle entry and also restores levels of NAD(H). Collectively, these findings elucidate the metabolic changes required to facilitate cardiomyocyte decision for cell cycle progression and provide exciting targets for improving the capacity of the heart to regenerate.
Data availability
All sequencing data are deposited in GEO. Bulk RNAseq is under accession number: GSE162165. Metabolomics data are available upon request.
Funding
This work was supported by grants from the National Institutes of Health (HL149140, HL147921, HL130174, HL147844, HL078825, and GM127607). We also acknowledge the Center for Regulatory and Environmental Metabolomics Core (NIH, S10OD020106).
Author contributions
R.A., conception of idea, design and execution of experiments, data analysis, manuscript writing; L.M., execution of experiments; A.M.S., execution of experiments; S.K.H., execution of experiments; Q.O., execution of experiments; C.W., execution of experiments; P.K.L., data analysis; R.B., project input and manuscript writing; T.M.A.M., conception of idea, experimental design, data analysis, manuscript writing; B.G.H., conception of idea, experimental design, data analysis, manuscript writing.
Declaration of competing interest
The authors declare the following competing interests: Tamer Mohamed holds equities in Tenaya Therapeutics.
Footnotes
Supplementary data to this article can be found online at https://doi.org/10.1016/j.redox.2021.102094.
Contributor Information
Tamer M.A. Mohamed, Email: tamer.mohamed@louisville.edu.
Bradford G. Hill, Email: bradford.hill@louisville.edu.
Appendix A. Supplementary data
The following are the Supplementary data to this article:
References
- 1.Porrello E.R., Mahmoud A.I., Simpson E., Hill J.A., Richardson J.A., Olson E.N., Sadek H.A. Transient regenerative potential of the neonatal mouse heart. Science. 2011;331(6020):1078–1080. doi: 10.1126/science.1200708. [DOI] [PMC free article] [PubMed] [Google Scholar]
- 2.Porrello E.R., Mahmoud A.I., Simpson E., Johnson B.A., Grinsfelder D., Canseco D., Mammen P.P., Rothermel B.A., Olson E.N., Sadek H.A. Regulation of neonatal and adult mammalian heart regeneration by the miR-15 family. Proc. Natl. Acad. Sci. U. S. A. 2013;110(1):187–192. doi: 10.1073/pnas.1208863110. [DOI] [PMC free article] [PubMed] [Google Scholar]
- 3.Vivien C.J., Hudson J.E., Porrello E.R. Evolution, comparative biology and ontogeny of vertebrate heart regeneration. NPJ Regen Med. 2016;1 doi: 10.1038/npjregenmed.2016.12. [DOI] [PMC free article] [PubMed] [Google Scholar]
- 4.Wang J., Panakova D., Kikuchi K., Holdway J.E., Gemberling M., Burris J.S., Singh S.P., Dickson A.L., Lin Y.F., Sabeh M.K., Werdich A.A., Yelon D., Macrae C.A., Poss K.D. The regenerative capacity of zebrafish reverses cardiac failure caused by genetic cardiomyocyte depletion. Development. 2011;138(16):3421–3430. doi: 10.1242/dev.068601. [DOI] [PMC free article] [PubMed] [Google Scholar]
- 5.Poss K.D., Wilson L.G., Keating M.T. Heart regeneration in zebrafish. Science. 2002;298(5601):2188–2190. doi: 10.1126/science.1077857. [DOI] [PubMed] [Google Scholar]
- 6.Witman N., Murtuza B., Davis B., Arner A., Morrison J.I. Recapitulation of developmental cardiogenesis governs the morphological and functional regeneration of adult newt hearts following injury. Dev. Biol. 2011;354(1):67–76. doi: 10.1016/j.ydbio.2011.03.021. [DOI] [PubMed] [Google Scholar]
- 7.Gonzalez-Rosa J.M., Martin V., Peralta M., Torres M., Mercader N. Extensive scar formation and regression during heart regeneration after cryoinjury in zebrafish. Development. 2011;138(9):1663–1674. doi: 10.1242/dev.060897. [DOI] [PubMed] [Google Scholar]
- 8.Haubner B.J., Schneider J., Schweigmann U., Schuetz T., Dichtl W., Velik-Salchner C., Stein J.I., Penninger J.M. Functional recovery of a human neonatal heart after severe myocardial infarction. Circ. Res. 2016;118(2):216–221. doi: 10.1161/CIRCRESAHA.115.307017. [DOI] [PubMed] [Google Scholar]
- 9.Soonpaa M.H., Kim K.K., Pajak L., Franklin M., Field L.J. Cardiomyocyte DNA synthesis and binucleation during murine development. Am. J. Physiol. 1996;271(5 Pt 2):H2183–H2189. doi: 10.1152/ajpheart.1996.271.5.H2183. [DOI] [PubMed] [Google Scholar]
- 10.Shammas N.W., Moss A.J., Sullebarger J.T., Gutierrez O.H., Rocco T.A. Acquired coronary angiogenesis after myocardial infarction. Cardiology. 1993;83(3):212–216. doi: 10.1159/000175972. [DOI] [PubMed] [Google Scholar]
- 11.Huwer H., Rissland J., Vollmar B., Nikoloudakis N., Welter C., Menger M.D., Schafers H.J. Angiogenesis and microvascularization after cryothermia-induced myocardial infarction: a quantitative fluorescence microscopic study in rats. Basic Res. Cardiol. 1999;94(2):85–93. doi: 10.1007/s003950050130. [DOI] [PubMed] [Google Scholar]
- 12.Magadum A., Singh N., Kurian A.A., Munir I., Mehmood T., Brown K., Sharkar M.T.K., Chepurko E., Sassi Y., Oh J.G., Lee P., Santos C.X.C., Gaziel-Sovran A., Zhang G., Cai C.L., Kho C., Mayr M., Shah A.M., Hajjar R.J., Zangi L. Pkm2 regulates cardiomyocyte cell cycle and promotes cardiac regeneration. Circulation In press. 2020 doi: 10.1161/CIRCULATIONAHA.119.043067. [DOI] [PMC free article] [PubMed] [Google Scholar]
- 13.Honkoop H., de Bakker D.E., Aharonov A., Kruse F., Shakked A., Nguyen P.D., de Heus C., Garric L., Muraro M.J., Shoffner A., Tessadori F., Peterson J.C., Noort W., Bertozzi A., Weidinger G., Posthuma G., Grun D., van der Laarse W.J., Klumperman J., Jaspers R.T., Poss K.D., van Oudenaarden A., Tzahor E., Bakkers J. Single-cell analysis uncovers that metabolic reprogramming by ErbB2 signaling is essential for cardiomyocyte proliferation in the regenerating heart. Elife. 2019;8 doi: 10.7554/eLife.50163. [DOI] [PMC free article] [PubMed] [Google Scholar]
- 14.Cardoso A.C., Lam N.T., Savla J.J., Nakada Y., Pereira A.H.M., Elnwasany A., Menendez-Montes I., Ensley E.L., Petric U.B., Sharma G., Sherry A.D., Malloy C.R., Khemtong C., Kinter M.T., Tan W.L.W., Anene-Nzelu C.G., Foo R.S.Y., Nguyen N.U.N., Li S., Ahmed M.S., Elhelaly W.M., Abdisalaam S., Asaithamby A., Xing C., Kanchwala M., Vale G., Eckert K.M., Mitsche M.A., McDonald J.G., Hill J.A., Huang L., Shaul P.W., Szweda L.I., Sadek H.A. Mitochondrial substrate utilization regulates cardiomyocyte cell-cycle progression. Nature Metabolism. 2020;2:167–178. [PMC free article] [PubMed] [Google Scholar]
- 15.Cao J., Spielmann M., Qiu X., Huang X., Ibrahim D.M., Hill A.J., Zhang F., Mundlos S., Christiansen L., Steemers F.J., Trapnell C., Shendure J. The single-cell transcriptional landscape of mammalian organogenesis. Nature. 2019;566(7745):496–502. doi: 10.1038/s41586-019-0969-x. [DOI] [PMC free article] [PubMed] [Google Scholar]
- 16.Cohen E.D., Yee M., Porter G.A., Jr., Ritzer E.E., McDavid A.N., Brookes P.S., Pryhuber G.S., O'Reilly M.A. Neonatal hyperoxia inhibits proliferation and survival of atrial cardiomyocytes by suppressing fatty acid synthesis. JCI Insight. 2021 doi: 10.1172/jci.insight.140785. [DOI] [PMC free article] [PubMed] [Google Scholar]
- 17.Mills R.J., Parker B.L., Quaife-Ryan G.A., Voges H.K., Needham E.J., Bornot A., Ding M., Andersson H., Polla M., Elliott D.A., Drowley L., Clausen M., Plowright A.T., Barrett I.P., Wang Q.D., James D.E., Porrello E.R., Hudson J.E. Drug screening in human PSC-cardiac organoids identifies pro-proliferative compounds acting via the mevalonate pathway. Cell stem cell. 2019;24(6):895–907 e6. doi: 10.1016/j.stem.2019.03.009. [DOI] [PubMed] [Google Scholar]
- 18.Vander Heiden M.G., Cantley L.C., Thompson C.B. Understanding the Warburg effect: the metabolic requirements of cell proliferation. Science. 2009;324(5930):1029–1033. doi: 10.1126/science.1160809. [DOI] [PMC free article] [PubMed] [Google Scholar]
- 19.DeBerardinis R.J., Chandel N.S. Fundamentals of cancer metabolism. Sci Adv. 2016;2(5) doi: 10.1126/sciadv.1600200. [DOI] [PMC free article] [PubMed] [Google Scholar]
- 20.White E. Exploiting the bad eating habits of Ras-driven cancers. Genes Dev. 2013;27(19):2065–2071. doi: 10.1101/gad.228122.113. [DOI] [PMC free article] [PubMed] [Google Scholar]
- 21.Mahmoud A.I., Kocabas F., Muralidhar S.A., Kimura W., Koura A.S., Thet S., Porrello E.R., Sadek H.A. Meis1 regulates postnatal cardiomyocyte cell cycle arrest. Nature. 2013;497(7448):249–253. doi: 10.1038/nature12054. [DOI] [PMC free article] [PubMed] [Google Scholar]
- 22.Puente B.N., Kimura W., Muralidhar S.A., Moon J., Amatruda J.F., Phelps K.L., Grinsfelder D., Rothermel B.A., Chen R., Garcia J.A., Santos C.X., Thet S., Mori E., Kinter M.T., Rindler P.M., Zacchigna S., Mukherjee S., Chen D.J., Mahmoud A.I., Giacca M., Rabinovitch P.S., Aroumougame A., Shah A.M., Szweda L.I., Sadek H.A. The oxygen-rich postnatal environment induces cardiomyocyte cell-cycle arrest through DNA damage response. Cell. 2014;157(3):565–579. doi: 10.1016/j.cell.2014.03.032. [DOI] [PMC free article] [PubMed] [Google Scholar]
- 23.Mohamed T.M.A., Ang Y.S., Radzinsky E., Zhou P., Huang Y., Elfenbein A., Foley A., Magnitsky S., Srivastava D. Regulation of cell cycle to stimulate adult cardiomyocyte proliferation and cardiac regeneration. Cell. 2018;173(1):104–116 e12. doi: 10.1016/j.cell.2018.02.014. [DOI] [PMC free article] [PubMed] [Google Scholar]
- 24.Ou Q., Jacobson Z., Abouleisa R.R.E., Tang X.L., Hindi S.M., Kumar A., Ivey K.N., Giridharan G., El-Baz A., Brittian K., Rood B., Lin Y.H., Watson S.A., Perbellini F., McKinsey T.A., Hill B.G., Jones S.P., Terracciano C.M., Bolli R., Mohamed T.M.A. Physiological biomimetic culture system for pig and human heart slices. Circ. Res. 2019;125(6):628–642. doi: 10.1161/CIRCRESAHA.119.314996. [DOI] [PMC free article] [PubMed] [Google Scholar]
- 25.Bassat E., Mutlak Y.E., Genzelinakh A., Shadrin I.Y., Baruch Umansky K., Yifa O., Kain D., Rajchman D., Leach J., Riabov Bassat D., Udi Y., Sarig R., Sagi I., Martin J.F., Bursac N., Cohen S., Tzahor E. The extracellular matrix protein agrin promotes heart regeneration in mice. Nature. 2017;547(7662):179–184. doi: 10.1038/nature22978. [DOI] [PMC free article] [PubMed] [Google Scholar]
- 26.Heallen T., Zhang M., Wang J., Bonilla-Claudio M., Klysik E., Johnson R.L., Martin J.F. Hippo pathway inhibits Wnt signaling to restrain cardiomyocyte proliferation and heart size. Science. 2011;332(6028):458–461. doi: 10.1126/science.1199010. [DOI] [PMC free article] [PubMed] [Google Scholar]
- 27.Monroe T.O., Hill M.C., Morikawa Y., Leach J.P., Heallen T., Cao S., Krijger P.H.L., de Laat W., Wehrens X.H.T., Rodney G.G., Martin J.F. YAP partially reprograms chromatin accessibility to directly induce adult cardiogenesis in vivo. Dev. Cell. 2019;48(6):765–779 e7. doi: 10.1016/j.devcel.2019.01.017. [DOI] [PMC free article] [PubMed] [Google Scholar]
- 28.Morikawa Y., Zhang M., Heallen T., Leach J., Tao G., Xiao Y., Bai Y., Li W., Willerson J.T., Martin J.F. Actin cytoskeletal remodeling with protrusion formation is essential for heart regeneration in Hippo-deficient mice. Sci. Signal. 2015;8(375):ra41. doi: 10.1126/scisignal.2005781. [DOI] [PMC free article] [PubMed] [Google Scholar]
- 29.Chaudhry H.W., Dashoush N.H., Tang H., Zhang L., Wang X., Wu E.X., Wolgemuth D.J. Cyclin A2 mediates cardiomyocyte mitosis in the postmitotic myocardium. J. Biol. Chem. 2004;279(34):35858–35866. doi: 10.1074/jbc.M404975200. [DOI] [PubMed] [Google Scholar]
- 30.Cheng R.K., Asai T., Tang H., Dashoush N.H., Kara R.J., Costa K.D., Naka Y., Wu E.X., Wolgemuth D.J., Chaudhry H.W. Cyclin A2 induces cardiac regeneration after myocardial infarction and prevents heart failure. Circ. Res. 2007;100(12):1741–1748. doi: 10.1161/CIRCRESAHA.107.153544. [DOI] [PubMed] [Google Scholar]
- 31.Shapiro S.D., Ranjan A.K., Kawase Y., Cheng R.K., Kara R.J., Bhattacharya R., Guzman-Martinez G., Sanz J., Garcia M.J., Chaudhry H.W. Cyclin A2 induces cardiac regeneration after myocardial infarction through cytokinesis of adult cardiomyocytes. Sci. Transl. Med. 2014;6(224) doi: 10.1126/scitranslmed.3007668. [DOI] [PubMed] [Google Scholar]
- 32.Woo Y.J., Panlilio C.M., Cheng R.K., Liao G.P., Atluri P., Hsu V.M., Cohen J.E., Chaudhry H.W. Therapeutic delivery of cyclin A2 induces myocardial regeneration and enhances cardiac function in ischemic heart failure. Circulation. 2006;114(1 Suppl):I206–I213. doi: 10.1161/CIRCULATIONAHA.105.000455. [DOI] [PubMed] [Google Scholar]
- 33.Buchakjian M.R., Kornbluth S. The engine driving the ship: metabolic steering of cell proliferation and death. Nat. Rev. Mol. Cell Biol. 2010;11(10):715–727. doi: 10.1038/nrm2972. [DOI] [PubMed] [Google Scholar]
- 34.Mohamed T.M., Stone N.R., Berry E.C., Radzinsky E., Huang Y., Pratt K., Ang Y.S., Yu P., Wang H., Tang S., Magnitsky S., Ding S., Ivey K.N., Srivastava D. Chemical enhancement of in vitro and in vivo direct cardiac reprogramming. Circulation. 2017;135(10):978–995. doi: 10.1161/CIRCULATIONAHA.116.024692. [DOI] [PMC free article] [PubMed] [Google Scholar]
- 35.Lorkiewicz P.K., Gibb A.A., Rood B.R., He L., Zheng Y., Clem B.F., Zhang X., Hill B.G. Integration of flux measurements and pharmacological controls to optimize stable isotope-resolved metabolomics workflows and interpretation. Sci. Rep. 2019;9(1) doi: 10.1038/s41598-019-50183-3. [DOI] [PMC free article] [PubMed] [Google Scholar]
- 36.Gibb A.A., Lorkiewicz P.K., Zheng Y.T., Zhang X., Bhatnagar A., Jones S.P., Hill B.G. Integration of flux measurements to resolve changes in anabolic and catabolic metabolism in cardiac myocytes. Biochem. J. 2017;474(16):2785–2801. doi: 10.1042/BCJ20170474. [DOI] [PMC free article] [PubMed] [Google Scholar]
- 37.Adusumilli R., Mallick P. Data conversion with ProteoWizard msConvert. Methods Mol. Biol. 2017;1550:339–368. doi: 10.1007/978-1-4939-6747-6_23. [DOI] [PubMed] [Google Scholar]
- 38.Salabei J.K., Lorkiewicz P.K., Mehra P., Gibb A.A., Haberzettl P., Hong K.U., Wei X., Zhang X., Li Q., Wysoczynski M., Bolli R., Bhatnagar A., Hill B.G. Type 2 diabetes dysregulates glucose metabolism in cardiac progenitor cells. J. Biol. Chem. 2016;291(26):13634–13648. doi: 10.1074/jbc.M116.722496. [DOI] [PMC free article] [PubMed] [Google Scholar]
- 39.Wei X., Lorkiewicz P.K., Shi B., Salabei J.K., Hill B.G., Kim S., McClain C.J., Zhang X. Analysis of stable isotope assisted metabolomics data acquired by high resolution mass spectrometry. Analytical Methods. 2017;9:2275–2283. doi: 10.1039/C7AY00291B. [DOI] [PMC free article] [PubMed] [Google Scholar]
- 40.McNally L.A., Altamimi T.R., Fulghum K., Hill B.G. Considerations for using isolated cell systems to understand cardiac metabolism and biology. J. Mol. Cell. Cardiol. 2020;153:26–41. doi: 10.1016/j.yjmcc.2020.12.007. [DOI] [PMC free article] [PubMed] [Google Scholar]
- 41.Hung Y.P., Yellen G. Live-cell imaging of cytosolic NADH-NAD+ redox state using a genetically encoded fluorescent biosensor, Methods in molecular biology (Clifton, N. J. 2014;1071:83–95. doi: 10.1007/978-1-62703-622-1_7. [DOI] [PMC free article] [PubMed] [Google Scholar]
- 42.Gibb A.A., Hill B.G. Metabolic coordination of physiological and pathological cardiac remodeling. Circ. Res. 2018;123(1):107–128. doi: 10.1161/CIRCRESAHA.118.312017. [DOI] [PMC free article] [PubMed] [Google Scholar]
- 43.Stephen H.M., Adams T.M., Wells L. Regulating the regulators: mechanisms of substrate selection of the O-GlcNAc cycling enzymes OGT and OGA. Glycobiology. 2021 doi: 10.1093/glycob/cwab005. [DOI] [PMC free article] [PubMed] [Google Scholar]
- 44.van der Veen J.N., Kennelly J.P., Wan S., Vance J.E., Vance D.E., Jacobs R.L. The critical role of phosphatidylcholine and phosphatidylethanolamine metabolism in health and disease. Biochim. Biophys. Acta Biomembr. 2017;1859(9 Pt B):1558–1572. doi: 10.1016/j.bbamem.2017.04.006. [DOI] [PubMed] [Google Scholar]
- 45.Pacold M.E., Brimacombe K.R., Chan S.H., Rohde J.M., Lewis C.A., Swier L.J., Possemato R., Chen W.W., Sullivan L.B., Fiske B.P., Cho S., Freinkman E., Birsoy K., Abu-Remaileh M., Shaul Y.D., Liu C.M., Zhou M., Koh M.J., Chung H., Davidson S.M., Luengo A., Wang A.Q., Xu X., Yasgar A., Liu L., Rai G., Westover K.D., Vander Heiden M.G., Shen M., Gray N.S., Boxer M.B., Sabatini D.M. A PHGDH inhibitor reveals coordination of serine synthesis and one-carbon unit fate. Nat. Chem. Biol. 2016;12(6):452–458. doi: 10.1038/nchembio.2070. [DOI] [PMC free article] [PubMed] [Google Scholar]
- 46.Tran D.H., Wang Z.V. Glucose metabolism in cardiac hypertrophy and heart failure. J Am Heart Assoc. 2019;8(12) doi: 10.1161/JAHA.119.012673. [DOI] [PMC free article] [PubMed] [Google Scholar]
- 47.Fajardo V.M., Feng I., Chen B.Y., Perez-Ramirez C.A., Shi B., Clark P., Tian R., Lien C.L., Pellegrini M., Christofk H., Nakano H., Nakano A. GLUT1 overexpression enhances glucose metabolism and promotes neonatal heart regeneration. Sci. Rep. 2021;11(1) doi: 10.1038/s41598-021-88159-x. [DOI] [PMC free article] [PubMed] [Google Scholar]
- 48.Montal E.D., Dewi R., Bhalla K., Ou L., Hwang B.J., Ropell A.E., Gordon C., Liu W.J., DeBerardinis R.J., Sudderth J., Twaddel W., Boros L.G., Shroyer K.R., Duraisamy S., Drapkin R., Powers R.S., Rohde J.M., Boxer M.B., Wong K.K., Girnun G.D. PEPCK coordinates the regulation of central carbon metabolism to promote cancer cell growth. Mol. Cell. 2015;60(4):571–583. doi: 10.1016/j.molcel.2015.09.025. [DOI] [PMC free article] [PubMed] [Google Scholar]
- 49.Hung Y.P., Albeck J.G., Tantama M., Yellen G. Imaging cytosolic NADH-NAD(+) redox state with a genetically encoded fluorescent biosensor. Cell Metabol. 2011;14(4):545–554. doi: 10.1016/j.cmet.2011.08.012. [DOI] [PMC free article] [PubMed] [Google Scholar]
- 50.Bilan D.S., Matlashov M.E., Gorokhovatsky A.Y., Schultz C., Enikolopov G., Belousov V.V. Genetically encoded fluorescent indicator for imaging NAD(+)/NADH ratio changes in different cellular compartments. Biochim. Biophys. Acta. 2014;1840(3):951–957. doi: 10.1016/j.bbagen.2013.11.018. [DOI] [PMC free article] [PubMed] [Google Scholar]
- 51.Moncada S., Higgs E.A., Colombo S.L. Fulfilling the metabolic requirements for cell proliferation. Biochem. J. 2012;446(1):1–7. doi: 10.1042/BJ20120427. [DOI] [PubMed] [Google Scholar]
- 52.Bae J., Salamon R.J., Brandt E.B., Paltzer W.G., Zhang Z., Britt E.C., Hacker T.A., Fan J., Mahmoud A.I. Malonate promotes adult cardiomyocyte proliferation and heart regeneration. Circulation. 2021 doi: 10.1161/CIRCULATIONAHA.120.049952. [DOI] [PMC free article] [PubMed] [Google Scholar]
- 53.Hill B.G., Shiva S., Ballinger S., Zhang J., Darley-Usmar V.M. Bioenergetics and translational metabolism: implications for genetics, physiology and precision medicine. Biol. Chem. 2019;401(1):3–29. doi: 10.1515/hsz-2019-0268. [DOI] [PMC free article] [PubMed] [Google Scholar]
- 54.Chiarugi A., Dolle C., Felici R., Ziegler M. The NAD metabolome--a key determinant of cancer cell biology. Nat. Rev. Canc. 2012;12(11):741–752. doi: 10.1038/nrc3340. [DOI] [PubMed] [Google Scholar]
- 55.Icard P., Lincet H. A global view of the biochemical pathways involved in the regulation of the metabolism of cancer cells. Biochim. Biophys. Acta. 2012;1826(2):423–433. doi: 10.1016/j.bbcan.2012.07.001. [DOI] [PubMed] [Google Scholar]
- 56.Chang P., Jacobson M.K., Mitchison T.J. Poly(ADP-ribose) is required for spindle assembly and structure. Nature. 2004;432(7017):645–649. doi: 10.1038/nature03061. [DOI] [PubMed] [Google Scholar]
- 57.Wiley C.D., Campisi J. From ancient pathways to aging cells-connecting metabolism and cellular senescence. Cell Metabol. 2016;23(6):1013–1021. doi: 10.1016/j.cmet.2016.05.010. [DOI] [PMC free article] [PubMed] [Google Scholar]
- 58.Slawson C., Housley M.P., Hart G.W. O-GlcNAc cycling: how a single sugar post-translational modification is changing the way we think about signaling networks. J. Cell. Biochem. 2006;97(1):71–83. doi: 10.1002/jcb.20676. [DOI] [PubMed] [Google Scholar]
- 59.Tan E.P., Duncan F.E., Slawson C. The sweet side of the cell cycle. Biochem. Soc. Trans. 2017;45(2):313–322. doi: 10.1042/BST20160145. [DOI] [PMC free article] [PubMed] [Google Scholar]
- 60.Diehl F.F., Lewis C.A., Fiske B.P., Vander Heiden M.G. Cellular redox state constrains serine synthesis and nucleotide production to impact cell proliferation. Nat Metab. 2019;1(9):861–867. doi: 10.1038/s42255-019-0108-x. [DOI] [PMC free article] [PubMed] [Google Scholar]
Associated Data
This section collects any data citations, data availability statements, or supplementary materials included in this article.
Supplementary Materials
Data Availability Statement
All sequencing data are deposited in GEO. Bulk RNAseq is under accession number: GSE162165. Metabolomics data are available upon request.