

Abstract
Halobacteria, a type of archaea in high salt environments, have phytanyl ether phospholipid membranes containing up to 50% menaquinone. It is not understood why a high concentration of menaquinone is required and how it influences membrane properties. In this study, menaquinone-8 head group and torsion parameters of isoprenoid tail are optimized in the CHARMM36 force field. Molecular dynamics simulations of archaeal bilayers containing 0 to 50% menaquinone characterize the distribution of menaquinone-8 and menaquinol-8, as well as their effects on mechanical properties and permeability. Menaquinone-8 segregates to the membrane midplane above concentrations of 10%, favoring an extended conformation in a fluid state. Menaquinone-8 increases the bilayer thickness, but does not significantly alter the area compressibility modulus and lipid chain ordering. Counterintuitively, menaquinone-8 increases water permeability because it lowers the free energy barrier in the midplane. The thickness increase due to menaquinone-8 may help halobacteria ameliorate hyper-osmotic pressure by increasing the membrane bending constant. Simulations of the archaeal membranes with archaerhodopsin-3 show that the local membrane surface adjusts to accommodate the thick membranes. Overall, this study delineates the biophysical landscape of 50% menaquinone in the archaeal bilayer, demonstrates the mixing of menaquinone and menaquinol, and provides atomistic details about menaquinone configurations.
Keywords: Archaea, molecular dynamics, menaquinone, menaquinol, permeation, archaerhodopsin-3, isoprenoid, membrane
Graphical Abstract

Introduction
The Archaea is one of the three ancient Domains along with Bacteria and Eukarya.1, 2 Many live in harsh environments, for example, thermophiles in hot springs3 and halobacteria in the Dead Sea and salty lakes.4 Traditionally, 16S rRNA sequence that contains 9 variable regions has been used to distinguish Archaea from Bacteria and Eukarya.5 In recent years, lipidomics has been increasingly employed to phenotype different organisms,6–8 as lipids determine the barrier between cell and its environment and ensure proper functioning of membrane proteins. Kellerman et al. used mass spectroscopy to quantify lipid compositions in various halobacteria and found unprecedented high concentrations of menaquinone in the membranes. For example, 48% of lipids are menaquinone in Halo. Sodomense from whole-cell measurements.8
In fact, such lipidomical changes under osmotic pressure are not uncommon.9–13 In halobacteria Staphylococcus epidermidis, high concentrations of NaCl induce increased cardiolipin concentration in its membrane.9 Sevin and Sauer reported that, after an osmotic shock, E. coli has a more than 100-fold increase of ubiquinone up to 1% in the membrane.14 E. coli cells became more susceptible to osmotic treatment when the ubiquinone synthesis gene ubiG is knocked out. The phenotype was only rescued by supplementing ubiquinone to the cell culture. Halobacteria also contain unusual phospholipids, such as phytanyl ethers,15 to adapt to environments of up to 34% salinity.
It is not yet understood why such massive amounts of menaquinone exist in the membrane. Where does quinone locate? How does menaquinone enhance hyper-osmotic resistance? Localizations of quinone in the membrane have been under debate for decades, with both experiments16–25 and simulations26–29 yielding inconsistent results. Biophysical characterization shows that ubiquinone increases membrane rigidity and decrease the membrane leakage.30 We thus aim to elucidate menaquinone localization in the membrane and its role in promoting hyper-osmotic resistance.
While the quinone head group is an electron/proton carrier,31 the function of polyunsaturated isoprenoid tails of menaquinone is less clear. Studies have suggested the anti-oxidative role of double bonds as scavenger of free radicals.8, 32 The isoprenoid motif is common in biological systems, e.g., carotenoid and squalene in archaea8 and farnesyl lipid anchor of lipidated proteins,33 and widely used drug conjugation.34–38 Thus, it is important to characterize the conformational space of the quinone isoprenoid tail, which may help elucidate its functional roles.
Archaea also serve as a rich reservoir of protein scaffolds for bioengineering. For example, bacteriorhodopsin (bR) has been used as a motion sensor and an X-ray sensor by utilizing its light activation cycle.39, 40 Archaerhodopsin-3 (AR3) from Halo. sodomense fused with fluorescent protein was used as a voltage sensor (QuasAr) for neurobiological research.41 Therefore, it is of interest to examine how AR3 interacts with the halobacterial host membrane at high concentration of menaquinone.
To address the preceding questions, we performed molecular dynamics (MD) simulations to study the archaeal membrane and its interaction with AR3. In Methods, we describe the force field parameterization and validation methods of head group and tail torsion profiles of menaquinone-8, followed by system setup, simulation protocols, and analysis methods. We then provide and discuss the results, including parameter validation, archaeal membrane properties, menaquinone-8 locations and tail conformations, menaquinone-menaquinol interactions, and lipid-protein modulations between AR3 and archaeal membrane.
Methods
Lipid parameterization
The archaeal phospholipids (phosphoglycerol archaeol (PGAR) and phosphoethanolamine archaeaol (PEAR)) parameters were transferred from existing ether42 and branched-chain phospholipids.43 Head groups of menaquinone-8 (MK8) and menaquinol-8 (MKOL8) were parameterized using CGenFF44 (Table S1); menaquinone has been abbreviated as MK instead of MQ.45, 46 Figure 1 depicts the four lipid components for an archaeal membrane. Free energy perturbation simulations were performed for 1,4-naphthoquinone in TIP3P water and cyclohexane using GROMACS program47 to validate the nonbonded parameters of MK8. The electrostatic and van der Waals interactions were gradually reduced to zero, and the multistate Bennett acceptance ratio (MBAR) method48 was used to calculate the absolute solvation free energies of the molecule in two solvents. The relative solvation free energy (ΔGhex-water) is the difference of two absolute solvation free energies, which can be compared with the experimentally determined partition coefficient logP (cyclohexane/water): exp(ΔGhex-water/kBT) = 10logP.
Figure 1.

Lipid species studied in this work: MK8 (menaquinone-8), MKOL8 (menaquinol-8), PEAR (phosphoethanolamine archaeaol), and PGAR (phosphoglycerol archaeol).
Potential energy surface scans of molecular mechanics (MM) and quantum mechanics (QM) were performed every 5° to examine the torsion angle parameters of isoprenoid tail in MK8. Eight different starting conformations of isoprene dimer were scanned forward and backward to ensure sufficient sampling of the conformation space. The eight conformations are the combination of energy minimum points of three dihedrals (Figure 2): 100° and −100° for ϕ1 (C2-C4-C5-C6), 80° and −80° for ϕ2 (C4-C5-C6-C7), and 120° and −120° for ϕ3 (C5-C6-C7-C9).
Figure 2.

Fitting CHARMM force field parameters of three dihedral angles in the isoprenoid to QM results. Potential energy scans of dihedral angles (A) ϕ1 (C2-C4-C5-C6), (B) ϕ2 (C4-C5-C6-C7), and (C) ϕ3 (C5-C6-C7-C9) in QM (solid black), MM before optimization (dotted black), and MM after optimization (dashed red). Insets, schematics of model compounds with the dihedral angle of interest highlighted in red.
All QM calculations were performed at B3LYP/Def2-TZVP level with DFT-D3 method for dispersion correction using the Gaussian 16 program.49 Using the lowest energy conformations at each scan point, high accuracy single point energies are calculated using HM-IE method50 to approach the CCSD(T)/cc-pVQZ level: ECCSD(T)/QZ ≈ E CCSD(T)/DZ + (EMP2/QZ−EMP2/DZ), where QZ and DZ denote cc-pVQZ and cc-pVDZ basis sets, respectively. MM potential energy scans were performed based on QM conformations with restraints imposed on the three dihedral angles to keep the same configuration. By introducing a new atom type CEL0, we re-parameterized the parameters of three key torsion angles using Monte Carlo simulate annealing,51 and the parameters are listed in Table S2.
Initial conditions and simulation protocols
The protein structure of archaerhodopsion-3 (AR3) (Uniprot ID P96787) was modelled using I-TASSER server52–54 with a homologous sequence template of bacteriorhodopsin sharing 90% sequence identity. Table 1 lists the 13 bilayers and their components simulated in this study. All contain 3:2 PGAR:PEAR and are specified by their varying fractions of MK8 and MKOL8. For example, 50-MK8 contains 50% MK8, 30% PGAR, 20% PEAR, and 30-MIX contains 15% MK8, 15% MKOL8, 42% PGAR, 28% PEAR. Systems with the protein AR3 are prefaced as such. Simulation systems of pure bilayers and AR3-embedded protein-lipid complex were assembled with the CHARMM-GUI Membrane Builder assembly protocol55, 56 with the exception of the 30-MIX and 30-MKOL8 systems. These two were assembled from the last snapshot of 30-MK8 at 2 μs by changing MK8 to MKOL8 molecules. K+ and Cl− ions were added to keep the whole assembly neutral and maintain a salt concentration of 0.15 M KCl.
Table 1.
Simulation systems.
| System | Lipid Composition (%) | # Lipids | # Water per lipid |
|---|---|---|---|
| 50-MK8 | PG:PE:MK8 = 30:20:50 | 200 | 67.9 |
| 40-MK8 | PG:PE:MK8 = 36:24:40 | 200 | 67.6 |
| 30-MK8 | PG:PE:MK8 = 42:28:30 | 200 | 67.5 |
| 20-MK8 | PG:PE:MK8 = 48:32:20 | 200 | 67.4 |
| 10-MK8 | PG:PE:MK8 = 54:36:10 | 200 | 67.2 |
| 00-MK8 | PG:PE = 60:40 | 200 | 66.9 |
| 30-MKOL8 | PG:PE:MKOL8 = 42:28:30 | 200 | 31.9 |
| 30-MIX | PG:PE:MK8:MKOL8=42:28:15:15 | 200 | 31.9 |
| AR3-00MK8 | PG:PE = 60:40 | 202 | 72.1 |
| AR3-30MK8 | PG:PE:MK8 = 36:24:40 | 201 | 75.3 |
| AR3-50MK8 | PG:PE:MK8 = 30:20:50 | 202 | 77.7 |
| AR3-30MKOL8 | PG:PE:MKOL8 = 42:28:30 | 201 | 75.3 |
| AR3-30MIX | PG:PE:MK8:MKOL8=42:28:15:15 | 202 | 75.1 |
The 13 systems were simulated using the CHARMM36 force field57–59 and TIP3P water model60, 61 at 303.15 K and at 1 bar with NPT (constant particle number, pressure, and temperature). The SHAKE algorithm was applied to the bonds that contain hydrogen atoms.62 The van der Waals interactions were cut off at 12 Å with a force-switching function between 10 and 12 Å,63 and the electrostatic interactions were calculated by the particle-mesh Ewald method.64 The temperature and the pressure were controlled by Langevin dynamics with a friction coefficient 1 ps−1 and a semi-isotropic Monte Carlo barostat, respectively.65, 66 We performed equilibration of the systems using the CHARMM-GUI default six-step protocol.55, 56, 67, 68 We use a time step of 2 fs for production and simulated each system for 2 μs. All but the single molecule simulations were performed using OpenMM.69 Langevin dynamics simulation of a single MK8 molecule in vacuum was carried out with CHARMM70 for 200 ns with a time step of 2 fs at 303 K.
Analysis
The membrane thickness was calculated by measuring the mean z-positions of acyl chain C2 atoms of PGAR and PEAR (Figure 1) in the upper and lower leaflets. We used the membrane thickness as a function of time to monitor the equilibration of each trajectory. For 2D thickness, XY coordinates of C2 atoms were extracted and mapped onto a grid with a spacing of 2.8 Å. The thickness in each grid was then calculated by measuring the mean z-positions of the same grid in the two leaflets.
The deuterium order parameters (SCD) were calculated by
| (1) |
where θ is the angle of a C-H vector with respect to the bilayer normal. The area compressibility modulus (KA) was calculated by
| (2) |
where kB is the Boltzmann constant and T is temperature. We used the final 1 μs of each 2-μs trajectory and divided into four blocks to estimate standard errors of KA. The statistical significance of KA values between the systems was performed with t-test without assuming equal variances. A membrane defect was calculated by the ratio of exposed hydrophobic surface area to the bulk solvent by following Wildermuth et al..71 Briefly, we used VMD72 to render images of bilayer polar surface and hydrophobic core, and then used a computer vision program, OpenCV 2,73 to calculate the membrane defect ratio. A schematic is shown in Figure S1.
Potentials of mean force (PMF, F(z)) of water were calculated from the water probability densities (p(z)) along the membrane normal as F(z) = kBT ln(p(z)). Water positions were sampled at 1 ps interval for the last 500 ns of each system with a bin size of 1 Å and p(z) was symmetrized across the two leaflets. For AR3-embedded systems, water densities were sampled from the lipid-only region, by cropping out a box containing the protein. An estimate of the resistance to water permeation was obtained as
| (3) |
where h is the bilayer thickness along the z-direction, and β = 1/kBT. Eq (3) is derived from the inhomogeneous solubility-diffusion model,74 assuming that the diffusion constant in the membrane is independent of z, and that F(z) = 0 in the bulk water phase. Hence, the permeability, .
The isomerization (trans-gauche transition) rate of menaquinone tails were calculated from the last 200 ns of the trajectories with frames sampled at an interval of 1 ps. States (gauche+, gauche−, and trans) were defined as the minima ± 30° to ensure that only thermally stabilized transitions were counted.75 Only the middle five ϕ2 angles in the isoprenoid tail were pooled for estimating the isomerization rate, as the beginning and end of the tail have larger transition rates that skew the average isomerization rates.
The conformational ensemble of isoprenoid tails was histogramed into 37 (i.e., 2,187) categories, based on whether each of the seven torsion angles centered on a C-C single bond is trans, gauche+, and gauche−. The Markov model of tail conformation transition was estimated on the last 1-μs trajectory of the 50-MK8 system with a sampling frequency of 0.2 ns/frame using PyEMMA.76 A lag time of 80 ns was chosen based on the implied timescale plot, which detects the first few slowest timescale in conformational transition, and the Chapman-Kolmogorov test, which computes the transition probability for different lag times. A Bayesian Markov state model building was used to estimate the transition probability for each pair of conformations (see SI S1 for details). End-to-end distances for MK8 tails were calculated based on the first and last atom in the isoprenoid chain. Isomerization rates were calculated for the second to the sixth dihedral angles ϕ2 in the isoprenoid tail. Radial distribution functions (g(r)) were calculated for the centers of mass (COMs) of carbon atoms (C1-C10) in the MK8 or MKOL8 rings (Figure 1).
Principal component analysis (PCA) of protein conformational ensemble was performed using Prody package77 with protein coordinates of residues 18–234 (Table S3) extracted from the 2-μs trajectories in each simulation with a frequency of 2 frames/ns. Protein trajectories from five AR3 systems were concatenated, aligned based on the backbone atoms, and then used for covariance calculation and single value decomposition to derive the principal components. The conformations sampled in each simulation were projected onto the first three principal components. Molecular visualizations were rendered using VMD package.72
Results and Discussion
Menaquinone parameter validation and torsion profile optimization
We first validated the nonbonded parameters of head group and the dihedral angle parameters of isoprenoid tail in MK8, as these parameters can play a major role in menaquinone localization. For head group parameters, free energy perturbation calculations estimated the solvation free energy difference of a model compound 1,4-naphthoquinone in cyclohexane and in water to be 3.47 ± 0.07 kcal/mol, which is a logP of 2.54. This is in excellent agreement with the experimental logP value of 2.70 (ΔGexp-calc = 0.22 kcal/mol).78 For dihedral angle parameters, we performed a potential energy surface scan with the torsion angle of interest fixed and others relaxed. QM profiles of three dihedral angles (ϕ1 (C2-C4-C5-C6), ϕ2 (C4-C5-C6-C7), and ϕ3 (C5-C6-C7-C9)) were scanned based on the model compound of an isoprene dimer at the MP2/cc-pVDZ level. Figure 2 plots the torsion energy profiles before and after fitting the MM force field to QM results for the model compound. The previous CHARMM36 force field59 (dotted lines in Figure 2) does not satisfactorily represent these surfaces, especially the relative energies of the local minima of ϕ2 and ϕ3.
The energy profiles for ϕ1 and ϕ3, both centered on a C-C bond with a C=C bond attached, vary significantly. Chemically, the difference lies in the location of methyl group that is attached to the distal carbon (atom C2) in ϕ1 and to the proximal carbon (atom C7) in ϕ3. Even though the energy minima of the two profiles are both near ± 100°, the distal methyl group destabilizes the trans conformation. Previously, the two carbon atoms in the double bond were both represented by the same CEL1 type in the CHARMM36 force field. During the re-parameterization, we introduced a new CEL0 type for a double bond carbon atom with no hydrogen atom attached (atoms C2 and C7), so that CEL1 type now only represents a double bond carbon atom with one hydrogen attached (Figure 2), thereby distinguishing ϕ1 and ϕ3. The optimized CHARMM force field parameters for the three dihedral angles are listed in Table S2.
Membrane properties and menaquinone’s role in osmotic resistance
We simulated archaeal membrane systems with PGAR, PEAR, MK8, and MKOL8 (Figure 1) with increasing MK8 concentration from 0 to 50 mol%, with 30 mol% MKOL8, and with 30 mol% mixed MK8/MKOL8 (Table 1). The lipid-only systems reach equilibration after 1 μs, while the protein-lipid systems reach equilibration after 1.25 μs (Figure S2). With increasing MK8 concentration in the membrane, the hydrophobic thickness increases (Figure 3A). Comparing with typical phospholipids, e.g., POPC or DMPC, the archaeal bilayer of phytanyl tails is thicker (Table 2 and S4).
Figure 3.
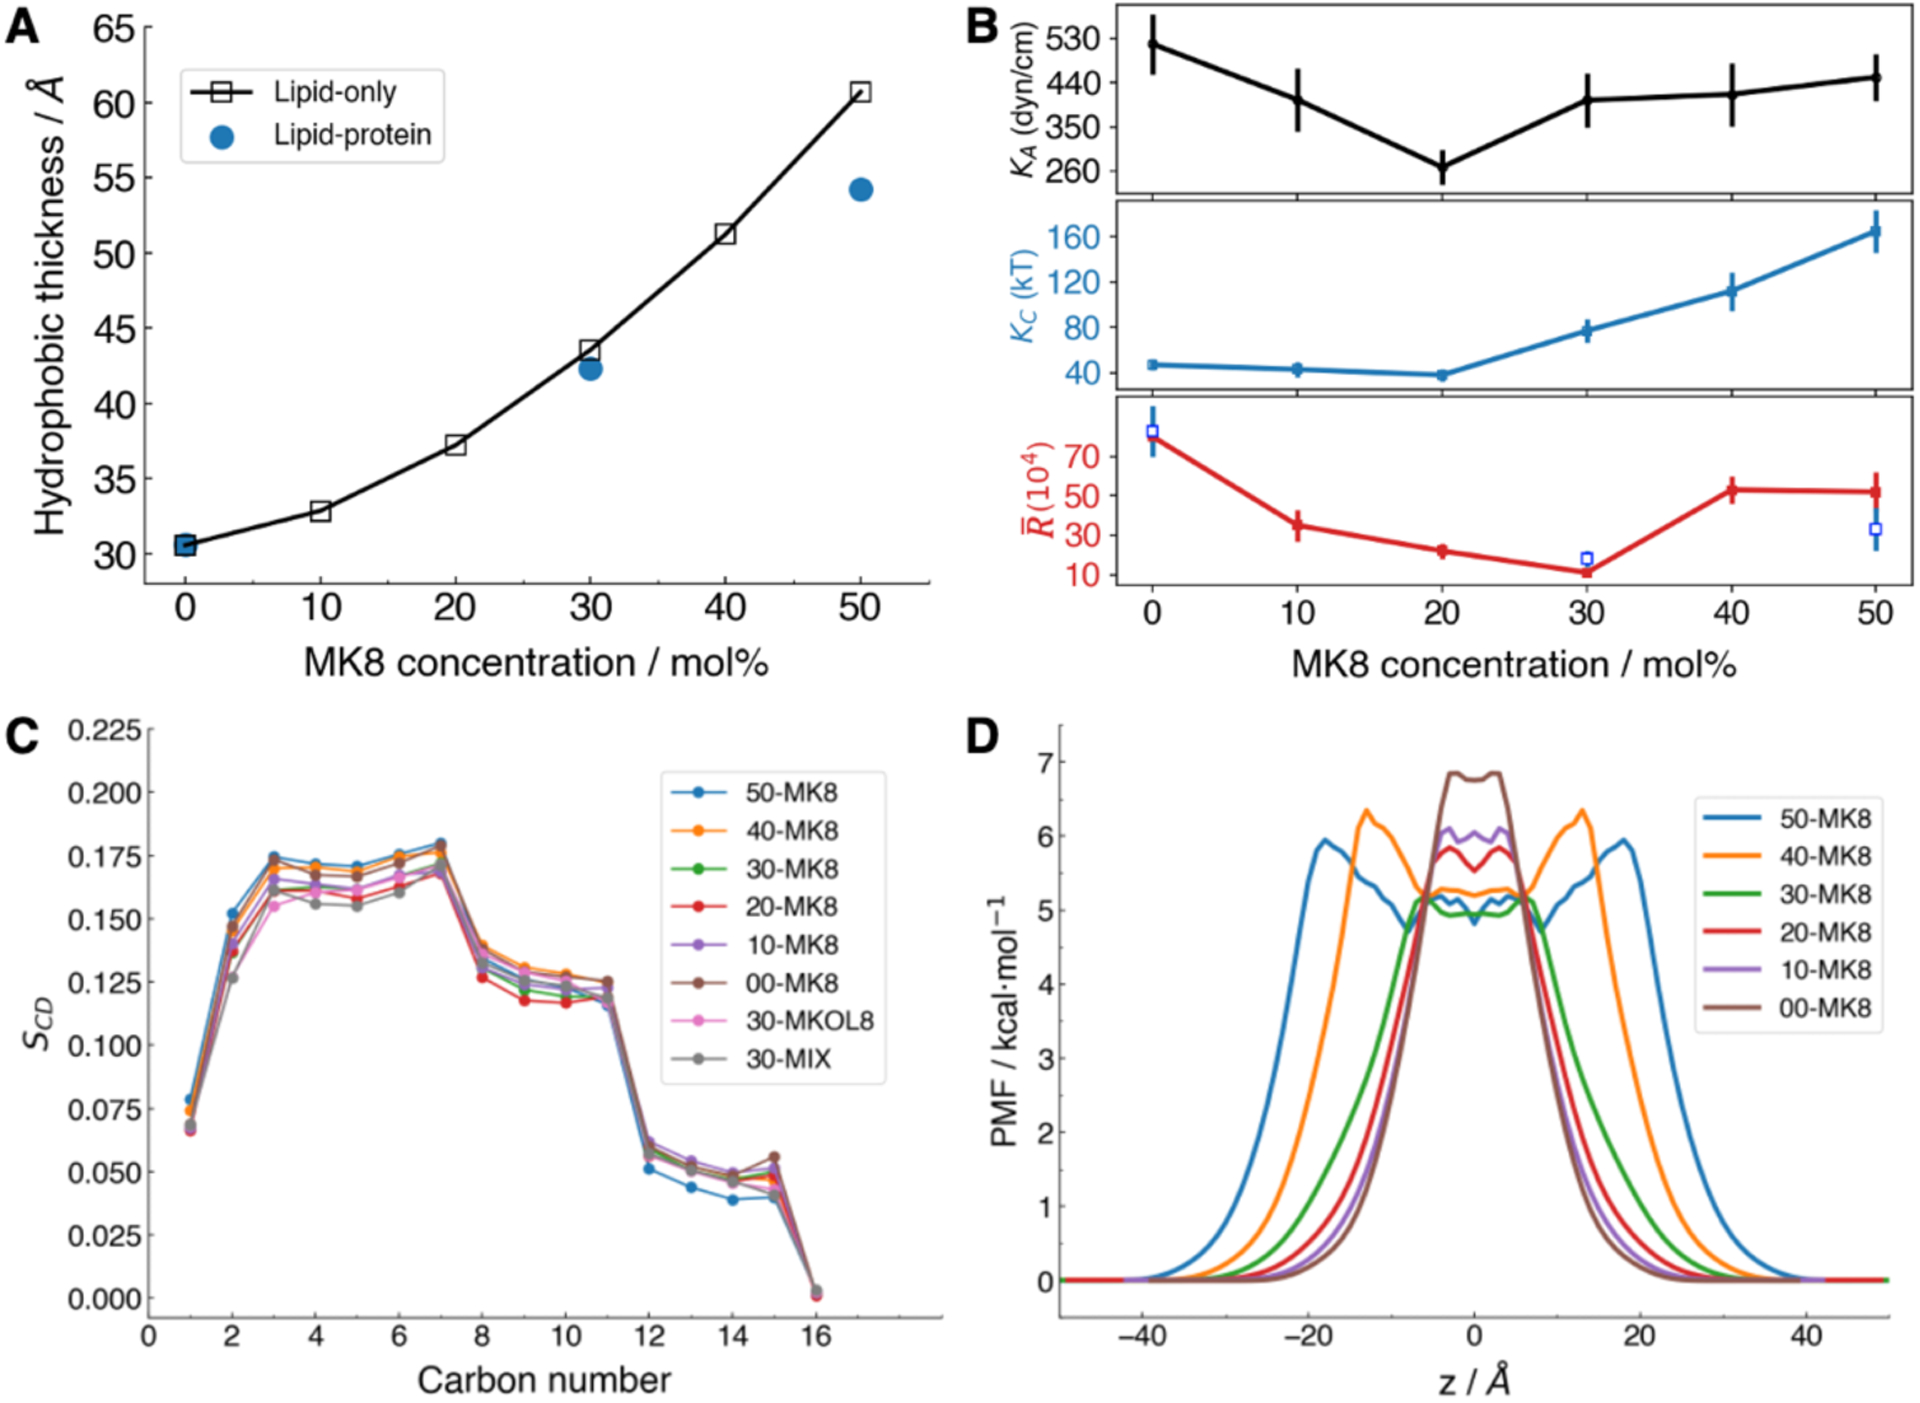
Characterization of membrane properties in different simulation systems. (A) The membrane bilayer thickness increases with more MK8. Blue dots represent the thickness of protein AR3 systems (AR3-00, 30, 50MK8). (B) Area compressibility modulus KA, bending constant KC, and permeability and permeability as a function of MK8 concentrations. Unfilled blue squares in lower panel indicate the values of for the AR3-embedded system. Error bars show the standard error of the mean. (C) Order parameter SCD for each carbon atom in the sn1 chain of PGAR (Figure 1). (D) Symmetrized potential of mean force (PMF) of water; the membrane center is at z = 0.
Table 2.
Hydrophobic thickness (hCC), area compressibility moduli (KA), water permeability resistance ( in Eq. 3), and approximate bending constant (KC in Eq. 4) for MK-8-containing systems.
| Systems | 00-MK8 | 10-MK8 | 20-MK8 | 30-MK8 | 40-MK8 | 50-MK8 |
|---|---|---|---|---|---|---|
| hCC (Å) | 30.7 ± 0.1 | 32.9 ± 0.1 | 37.8 ± 0.1 | 43.4 ± 0.1 | 52.1 ± 0.1 | 60.7 ± 0.1 |
| KA (dyn/cm) | 518 ± 62 | 405 ± 65 | 268 ± 36 | 404 ± 54 | 416 ± 64 | 451 ± 48 |
| (×104) | 80 ± 4 | 35 ± 8 | 22 ± 4 | 11 ± 2 | 53 ± 7 | 52 ± 10 |
| KC (kT) | 47 ± 5 | 43 ± 7 | 38 ± 5 | 77 ± 10 | 112 ± 17 | 165 ± 19 |
Three approaches were used to examine whether menaquinone in the membrane promotes membrane rigidity to reduce leakage, a property previously reported for ubiquinone.30 We first quantified membrane packing defect by measuring the extent of hydrophobic core exposed to the lipid-water interface. We found that higher quinone concentration does not lead to significant difference in membrane packing defects (Figure S3). Secondly, we calculated the area compressibility modulus KA. The pure bilayer (PGAR/PEAR) has a KA of 518 ± 62 dyn/cm (303 K), which is comparable with other reported KA values of ester DPhPC of 522 ± 49 dyn/cm (323K) (Figure 3B and Table S5).43, 79 With increasing MK8, KA initially decreases and then increases, with no statistically significant difference between 00-MK8 and 50-MK8. This can be due to that, at high concentrations, MK8 phase segregates to the bilayer midplane so the membrane/water interface is less perturbed. In the third approach, we characterized acyl chain order parameter (SCD) profiles. The SCD of phytanyl lipids shows three plateaus (Figure 3C), which is consistent with other simulations of DPhPC lipids.43 Clearly, higher concentrations of quinone do not significantly alter the SCD profiles (Figure 3C). From our analyses, MK-8 in archaeal diphytanyl lipid membrane does not substantially modulate membrane chain order or area compressibility.
MK8 localizes in the membrane midplane (Figure 4 and S4). With increasing concentration of MK8, the two phospholipid leaflets are gradually pushed apart, and the leaflets are well separated at 50% MK8 with no density of PGAR/PEAR acyl chains in the midplane (Figure 4A). This result is consistent with numerous experimental measurements showing that long-chain ubiquinone analogs locate near the membrane center.17, 19–24 From a chemical point of view, squalene, menaquinone-8, gemcitabine-squalene conjugate, and quinones, e.g., ubiquinone and platoquinone, constitute a spectrum of isoprenoid-based compounds (Figure S5). They share the same lipidic isoprenoid tail and yet each maintains a specific head group. Both squalene and menaquinone mainly localize in the midplane, while gemcitabine-squalene has the gemcitabine head exposed to the solvent and squalene tail inside the membrane.34 This comparison indicates the important role of head group hydrophobicity in localization of the long-chain isoprenoid compounds. From a force field point of view, Teixeira and Arantes simulated MK9 (3 mol%) in a mixed membrane,28 where they parameterized MK-9 with more polar carbonyl group and the smaller hydrogen atoms on the distal six-member ring (Table S6). They found MK-9 head group localize in the membrane-water interface. The different behavior of MK-9 observed in their simulation comparing with ours could be due to the low MK-9 concentration (3%), the different bilayer lipids (DLPC, DLPE), or the small variations of nonbonded parameters.
Figure 4.

MK8 and MKOL8 density distributions along the membrane normal. The density profiles along the membrane norm (left) and trajectory snapshots (right) of water, acyl chain, phosphate group of phospholipids, MK8 or MKOL8 head groups and tails. Color codes: water (purple), phosphate group (magenta), acyl chain (green), MK8/MKOL8 tail (yellow), and MK8/MKOL8 head (orange). See Figure S4 for distributions and trajectory snapshots of 10-MK, 20-MK, and 40-MK.
Given the fact that halobacteria live in a high-salinity environment, we sought to understand how MK8 affects membrane permeability to water. The potentials of mean force (PMF) of water permeation are plotted in Figure 3D. To begin, the bilayer with no MK8 (00-MK8, brown line) has a barrier of nearly 7 kcal/mol at the bilayer midplane, similar to bilayers composed of more common lipids.74 The free energy plateau in the midplane progressively drops to approximately 5 kcal/mol as the concentration of MK8 increases but the shape of the profile remains similar through 30-MK8. At higher concentrations, MK8 segregates to the midplane and the barrier associated with the phospholipid tails shifts to approximately ±6 Å for 40-MK8 and ±9 Å for 50-MK8. The barrier drop in MK8-rich regions arises from the polarity of the isoprenoid chains and quinone head group. These features in the PMF can be related to the water permeability from Eq. (3), which estimates the resistance to permeability ( in Table 2). is highest for 00-MK8, decreases as the concentration of MK8 is increases to 30-MK8, and then increases due to the larger hydrophobic thickness of 40-MK8 and 50-MK8, but does not reach the value of 00-MK8. Thus, menaquinone is not likely to promote osmotic resistance by increasing permeation barrier. Interestingly, the presence of menaquinone would likely increase the bilayer bending constant KC, according to the polymer brush model:80
| (4) |
where hcc is the hydrophobic thickness. Here we use the polymer brush model because other more rigorous methods for estimating KC are not applicable. Specifically, methods utilizing the height fluctuation spectrum81, 82 require very large bilayers (~30 nm/side), and those for smaller systems (such as the ones simulated here) based on lipid director fluctuations are only applicable to one-component bilayers.83 As shown in Table 2 and Figure 3B, KC is higher with 20% or more MK8 compared to 00-MK8 and is highest at 50-MK8; i.e., .
Conformation and dynamics of quinone tails
MK8 tails exhibit significant flexibility, displaying straight, 90°-turn, or multi-turn conformations (Figure 5A). We plotted the distributions of the three torsion angles of MK8 tails in 50-MK8 (Figure S6A–C). Of note, ϕ2 has significantly larger portion in trans conformation (180°) than gauche, and ϕ3 has a larger population in cis conformation (0°) than gauche, which are in an opposite trend to the QM and MM potential energy scans (Figure 2). To resolve the difference and to ensure the validity of simulations, we performed Langevin dynamics of a single MK8 molecule (One-MK8) in vacuum for 200 ns. The torsion distribution profiles agree well with the force field parameters and QM scans (Figure S6D–F).
Figure 5.

Characterization of a conformational ensemble of menaquinone tails. (A) Examples of quinone tail conformations and corresponding values of the 7 torsion angles. A gauche angle usually corresponds to a turn conformation. (B) Top 30 conformations of menaquinone and their probabilities. In the inset table, the vector coding of the top 15 conformations with probabilities are all-trans or one-gauche. (C) Heatmap of a Markov model of conformational transition between the top 15 conformations. AT: all-trans, ng: gauche(−) at n-th dihedral angle, nG: gauche(+) at n-th dihedral angle.
To gain further insight into how membrane environments and MK8 concentrations (i.e., packing effects) shift the distribution of MK8 torsion angles, we compared the torsion distribution profiles among systems of varying concentration (10–50% MK8, One-MK8). For ϕ1, the distribution of gauche and trans conformations are similar for vacuum and membrane environments (Figure S7A); while, the membrane environment strongly favors trans conformations over gauche for ϕ2 (Figure S7B). For ϕ3, the distributions of One-MK8 and 10-MK8 overlap and favor ±100° conformations, while the systems with high MK8 concentrations (20–50%) favor cis (0°) conformations (Figure S7C). Such a preference for cis conformation in ϕ3 leads to more extended MK8 tails, as reflected by longer end-to-end distances (Figure S8 and S9). The concentration of MK8 also influences the isomerization rate of ϕ2, which shows a twofold increase in 10-MK8 compared to the 20–50% MK8 systems (Figure S10), due to relatively higher free volume at the midplane in 10-MK8. Higher concentration does not lead to a waxy state of MK-8 in the membrane, as reflected by the mere two-fold decrease of the isomerization rate.
Despite the diverse conformations, there is a correlation between MK8 tail shape and torsion angles. Whenever ϕ2 is gauche, the isoprenoid tail takes a turn at that position (Figure 5A). Based on this, we used ϕ2 to describe the menaquinone tail conformational space. We coded torsion angles of isoprenoid discretely using {−1, 0, 1} to represent {gauche(−), trans, gauche(+)}, respectively. MK8 molecules has seven such torsion angles, and thus a vector of length seven is used to present one conformation, e.g., {0, 0, 1, 0, −1, 0, 0}. The statistics show that all-trans conformation is the most probable conformation, followed by one-gauche conformations (Figure 5B). The dynamics of MK8 tail by a Markov state model shows that each state tends to dwell in its state, but the rate of one-gauche conformation transiting to all-trans conformation is higher than the reverse transition (Figure 5C). It is very unlikely for one-gauche conformations at different positions to transit to each other directly, e.g., from 5-gauche to 6-gauche.
As noted above, the conformations of quinone tails (isoprenoid) tend to adopt all-trans configurations in the membrane as opposed to vacuum. In fact, the interplay between MK8 localization in the midplane and extended all-trans tail conformations is as follows. i) the naphthoquinone group of MK8 is not sufficiently polar to remain near the lipid-water interface and thus prefers the greasy aliphatic region. ii) Since it is difficult to re-organize the long isoprenoid tail (8 units) in the membrane, driven by enthalpy, it is energetically favorable to form a condensate in the midplane. All-trans conformations appear to allow the tails to intercalate with each other, which is enthalpically more favorable. The tendency to adopt extended isoprenoid tail conformations may be the reason for differences in experimental results on short-chain and long-chain quinone localization.16, 17, 21, 23, 24 Studies indicate that ubiquinone short-chain analogs tend to intercalate with phospholipids, while long-chain analogs tend to localize at the midplane.
Location and interactions of menaquinol-8
The reported 48% menaquinone in the membrane, however, does not take the co-existing menaquinol form into account. Under the experimental condition where the membrane extraction is not protected with nitrogen gas, MKOL8 species are likely to be oxidized to MK8. As MKOL8 has a phenol group that is more polar than carbonyl group of MK8, we hypothesized that MKOL8 might localize at the lipid-water interface. To date, due to experimental challenge of keeping quinol in the reduced state, there is no experiment characterizing quinol localization in the membrane. We thus parameterized MKOL8 to simulate as 30 mol% pure-MKOL8 and MK8-MKOL8 mixed membranes.
Membrane thickness is slightly lower in 30-MKOL8 (42.5 ± 0.1 Å) than in 30-MK8 (43.4 ± 0.1 Å) (Table S4). MKOL8 head groups are also mainly localized near the midplane, but comparing to the quinone counterpart, MKOL8 head group has more tendency to partition into the phospholipid leaflets as shown in the density profile and snapshot of 30-MKOL8 (Figure 4D). This is consistent with the trend in the simulation study by Kaurola and co-workers, where they showed that the ubiquinol head group has more tendency to partition into the phospholipid region.26
In our study, the MK8 concentrations are high (10~50 mol%) and correspond to the experimental range found in archaea. These concentrations are much larger than ubiquinone concentrations in mitochondria84 or those typically used in biophysical characterization experiments.30, 85 Since a high concentration of menaquinone may involve self-assembly behaviors, we characterized the interaction between quinone and/or quinol head groups via the pair distribution function. The pair distribution function shows that MK8-MK8 interaction has the first shell at 7.0 Å, MKOL8-MKOL8 at 6.1 Å, and MK8-MKOL8 at 6.1 Å (Figure 6A). There are two peaks inside MK8-MK8’s first shell, with the closer one corresponding to displaced parallel pairing (Figure S11A) and the distant one corresponding to cross (vertical) pairing (Figure S11B), which have been reported as configurations of naphthalene dimer pairing in QM calculations86. Hence, the MK8-MKOL8 interaction is more favorable than the MK8-MK8 and MKOL8-MKOL8 interactions. This suggests that electron/proton shuttling by MK8/MKOL8 does not require these species to travel all the way to coenzyme-binding sites, but, rather, electrons/protons can be passed to nearby MKOL8/MK8.
Figure 6.
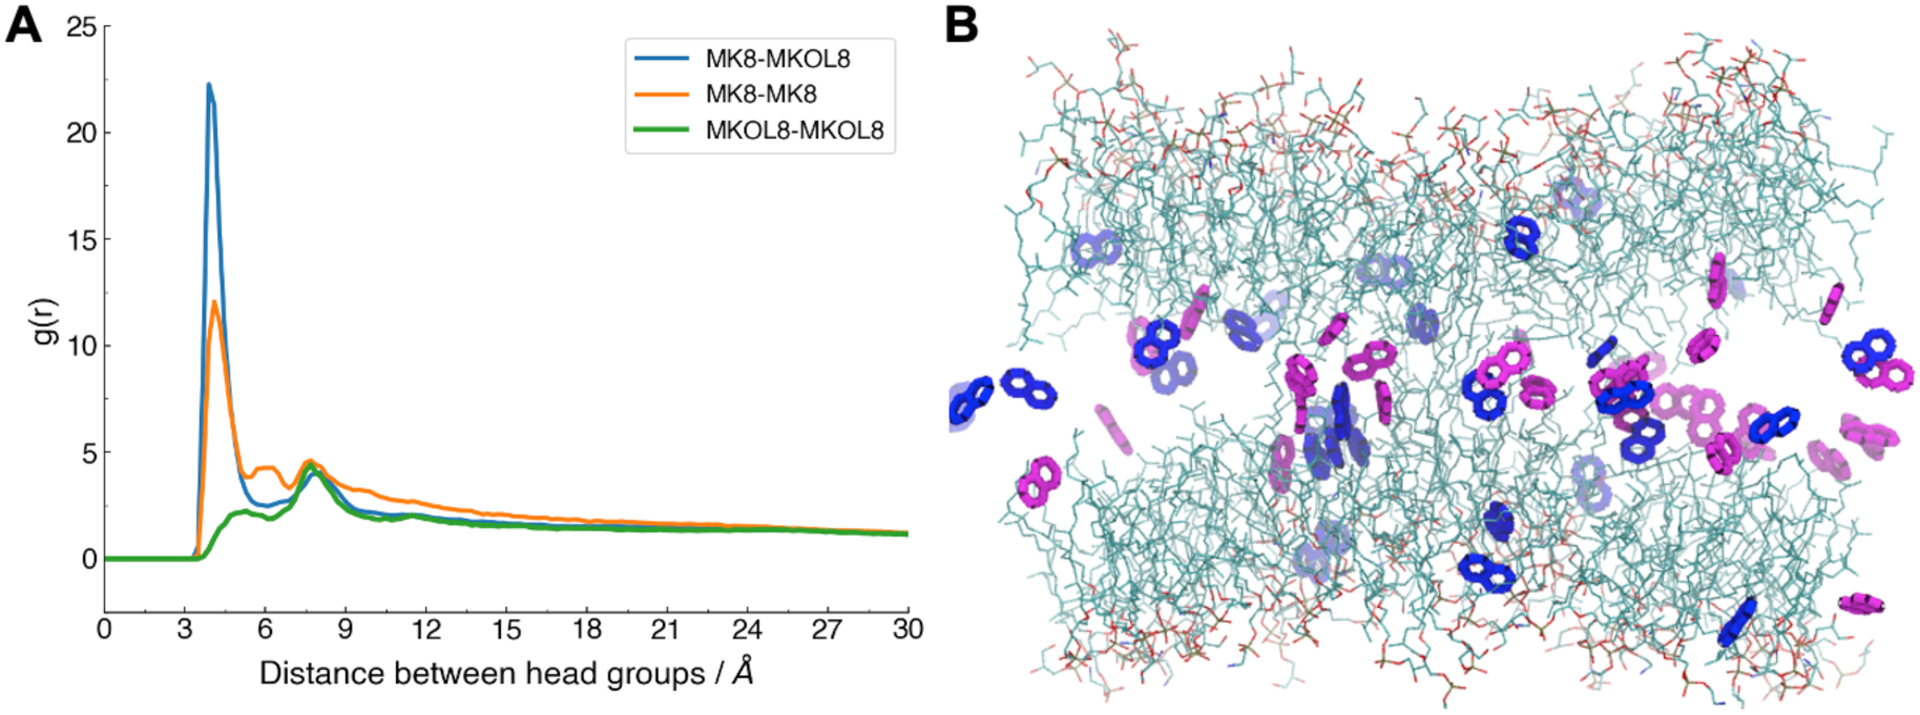
Characterizing interactions of MK8-MK8, MK8-MKOL8, and MKOL8-MKOL8 head groups. (A) Radial distribution functions (g(r)) in 30-MIX. (B) Snapshot of 30-MIX with orange for MKOL8 head group, blue for MK8 head group, and cyan for bilayer lipids.
Archaerhodopsin-3 in the archaeal membrane
With a hydrophobic thickness of ~60 Å in 50-MK8, it is important to determine how archaeal membrane proteins like archaerhodopsin-3 (AR3), a rhodopsin from Halo. sodomense, respond to such a large hydrophobic mismatch. Therefore, we simulated AR3 in 00-MK8, 30-MK8, and 50-MK8 membranes. Figure 7A shows that even the 50-MK8 membrane can adapt to the protein hydrophobic thickness by forming a largely deformed surface. The membrane protein has a strong hydrophobic core to resist unfolding pressure from a large hydrophobic mismatch (at least during the current simulation time). In the 30-MK8 membrane, AR3 forces the majority of MK8 into the periphery of bilayer region (Figure 7A). In the pure bilayer 00-MK8 membrane, the hydrophobic thickness is overall comparable at protein periphery and at the boundary of membrane (Figure 7A).
Figure 7.

Protein-lipid modulations. (A) 2D thickness profiles shown in heatmaps (left) and snapshots of AR3 and lipids (right). Color code: PGAR/PEAR (grey), MK8 (magenta), and AR3 (blue, with hydrophobic residues in orange). (B) Principal component (PC) projection using the first 3 PCs of AR3 conformations in 00-MK8, 30-MK8, 30-MKOL8, 30-MIX, and 50-MK8 membranes. (C) Equilibrated AR3 conformations in 00-MK8, 30-MK8, 50-MK8 membranes. Helix A and B are shown in magenta, and other helices are cyan.
In general, as a result of the long-time evolution process, the membrane protein and their surrounding bilayer thickness should match each other, unless the mismatch serves as a mechanism to create tension for some functional purpose. We thus compare the membrane bilayer thickness at the periphery of AR3 in AR3-containing systems with pure-lipid systems (Table S4). The bilayer near AR3 has a thickness of about 35–40 Å, which is best matched with the archaeal membrane with 10–20 mol% menaquinone.
Despite remaining folded in a highly mismatch membrane, AR3 in different membranes show different RMSD values from the initial structure (Figure S12). To quantify the conformational difference, we performed a principal component analysis and used the first 3 principal components to project the conformations. As shown in Figure 7B, the conformations of AR3 occupy different corners of the conformation space. Visualizing the protein structure, the transmembrane helix E and F show obviously different conformations in 00-, 30-, 50-MK8 systems (Figure 7C). To resist a larger hydrophobic thickness in 30- and 50-MK8 membrane, the α-helices extend more to disperse the tension.
The effects of AR3 on the free energy barrier of water permeation vary slightly with different MK8 concentrations (Figure S13). For 00-MK8, AR3 embedding has negligible influence on water PMF profile. For 30-MK8, AR3 slightly increases the free energy barrier of water permeation, likely due to the hydrophobic mismatch that condenses the membrane. For 50-MK8, AR3 decreases the free energy barrier of water permeation. This can be due to the deformation of the membrane. However, the permeability values with AR3 are not statistically significantly different from those without the protein (Figure 3B). These permeability data need to be cautiously interpreted, because the membrane surface deformation leads to heterogenous water distributions along the z-axis, which violates the underlying assumption of similar water diffusion coefficients along the z-axis in our calculation of .
Previous studies of protein-lipid modulation focused on simple transmembrane peptides like gramicidin A87–90 or WALP.91 The condensate of menaquinone at the midplane provides a unique way to build a thick membrane for probing protein tolerance to hydrophobic mismatch. In the extreme case of 50 mol% MK8, though AR3 remains integral as a seven-helices protein (at least during the current simulation time), such mismatch could put strain on the functional aspect of the protein, e.g., the photocycle.92 Meanwhile, in biological settings, a condensate at the membrane midplane often leads to toxicity. A study in yeast, which induced squalene accumulation in the membrane, caused significant cell toxicity.93 The toxicity could be due to the disruption of membrane structure (e.g., thickness, domain segregation) and malfunction of membrane proteins under hydrophobic mismatch.
Conclusions
In this study, we parameterized menaquinone and menaquinol head groups, and optimized the torsion parameters for unsaturated isoprenoids. The conformational space of isoprenoids was further characterized by the torsional angle distribution in the membranes with varying MK8 concentrations and in vacuum, identifying the ϕ2 angle as a key determinant of the conformational shape, and determining isomerization rates at different concentrations. We show that the large fraction of MK8 molecules located at the midplane form a fluid condensate favoring an extended conformation and provide a transition map for various conformations. MKOL8, the reduced form of MK8, is also found to localized mainly at the midplane though its head group partitions more into the lipid acyl chain region. This is representative of a general phenomenon as other studies have shown that isoprenoid compounds, e.g., squalene, or hydrocarbons such as hexadecane also localize in the midplane.25, 92, 94, 95 The assembly of MK8 and MKOL8 are found to mix well, with head-head pair distribution function showing the first interaction shell located at a distance around 6 Å.
To rationalize the existence of up to 50% menaquinone in the halobacterial membrane and explore its potential role in hyper-osmotic resistance, we evaluated membrane defects, chain deuterium order parameters, area compressibility moduli, and potentials of mean force of water along the membrane normal. MK-8 at a concentration from 10% to 50% does not promote chain order or increase compressibility of the archaeal membrane (PGAR, ZWAR), nor forms a permeation barrier. Its role in hyper-osmotic resistance, namely environmental osmotic pressure higher than the cellular, could be via increased hydrophobic thickness and larger membrane bending constant to resist the shrinking of the membrane, as halobacterial membrane has a cell wall (turgor pressure) to protect it from swelling96, 97 but lacks facilities to resist the shrinkage. It is also possible that high amounts of menaquinone exist to provide enough electron shuttling agents and improve membrane fluidity, as archaeal membranes might be packed tightly due to phospholipid salt bridges formed under high divalent ion concentrations.98
The 50% menaquinone concentration in archaea, compared to reported concentrations for ubiquinone in bacteria,14 eukaryotic mitochondria inner membrane,84 and in biophysical experiments, is very high.30, 85 The simulations indicated that the archaeal membrane can deform to accommodate the GPCR protein, AR3, even at 50% menaquinone concentration. It is possible that some of the quinone pool exists in reduced form (MKOL8) and halobacteria may have intracellular lipid droplets to store the excessive menaquinone.99
It awaits future cell biology and biochemical studies to validate whether there is 50% menaquinone concentration in the plasma membrane of Halo. sodomense, as the study by Kellerman et al8 does not distinguish the plasma membrane from sub-compartments like lipid bodies.100–102 Meanwhile, there are many unanswered biophysical questions. At lower concentrations (0–10%), would menaquinone location and its influence on membrane properties be different from those in the high concentration? What’s the permeability profile for bigger hydrophilic or hydrophobic molecules in the menaquinone-containing membrane? As halobacteria have minimum requirement of divalent ions like Mg2+,98 how would divalent ions in the solution influence the archaeal membrane properties? Would polarizable force fields (e.g., Drude and AMOEBA)103 influence the results of menaquinone localization and water permeability profile of the archaeal membrane? The present study provides an entry point to a more complete understanding of the archaeal membrane and menaquinone functions.
Supplementary Material
Acknowledgments
This work was supported in part by grants from the NSF MCB-1810695 and DBI-2011234 (to WI), MCB-1951425 and CHE-2003912 (to JBK), and the Intramural Research Program of the NIH, the National Heart, Lung, and Blood Institute (to RWP). The authors would like to thank Dr. Yeol Kyo Choi for guidance on FEP calculation and Dr. Dhilon S. Patel on the force field parameter check.
Footnotes
Supporting Information
Notes on Markov state model, supplementary Tables S1-S6, and supplementary Figures S1-S13.
References
- (1).Eme L; Spang A; Lombard J; Stairs CW; Ettema TJG, Archaea and the origin of eukaryotes. Nat Rev Microbiol 2017, 15 (12), 711–723. [DOI] [PubMed] [Google Scholar]
- (2).Gribaldo S; Brochier-Armanet C, The origin and evolution of archaea: A state of the art. Philosophical Transactions of the Royal Society B: Biological Sciences 2006, 361 (1470), 1007–1022. [DOI] [PMC free article] [PubMed] [Google Scholar]
- (3).Holden JF, Extremophiles: Hot environments. In Encyclopedia of microbiology (third edition), Schaechter M, Ed. Academic Press: Oxford, 2009; pp 127–146. [Google Scholar]
- (4).Andrei A-Ş; Banciu HL; Oren A, Living with salt: Metabolic and phylogenetic diversity of archaea inhabiting saline ecosystems. FEMS Microbiology Letters 2012, 330 (1), 1–9. [DOI] [PubMed] [Google Scholar]
- (5).Yarza P; Yilmaz P; Pruesse E; Glöckner FO; Ludwig W; Schleifer K-H; Whitman WB; Euzéby J; Amann R; Rosselló-Móra R, Uniting the classification of cultured and uncultured bacteria and archaea using 16s rrna gene sequences. Nat Rev Microbiol 2014, 12 (9), 635–645. [DOI] [PubMed] [Google Scholar]
- (6).Řezanka T; Kolouchová I; Gharwalová L; Palyzová A; Sigler K, Lipidomic analysis: From archaea to mammals. Lipids 2018, 53 (1), 5–25. [DOI] [PubMed] [Google Scholar]
- (7).Pearson A, 12.11 lipidomics for geochemistry. 2014. [Google Scholar]
- (8).Kellermann MY; Yoshinaga MY; Valentine RC; Wormer L; Valentine DL, Important roles for membrane lipids in haloarchaeal bioenergetics. Biochim Biophys Acta 2016, 1858 (11), 2940–2956. [DOI] [PubMed] [Google Scholar]
- (9).Kates M, Influence of salt concentration on membrane lipids of halophilic bacteria. FEMS Microbiology Reviews 1986, 2 (1–2), 95–101. [Google Scholar]
- (10).Tsuzuki M; Moskvin OV; Kuribayashi M; Sato K; Retamal S; Abo M; Zeilstra-Ryalls J; Gomelsky M, Salt stress-induced changes in the transcriptome, compatible solutes, and membrane lipids in the facultatively phototrophic bacterium rhodobacter sphaeroides. Applied and Environmental Microbiology 2011, 77 (21), 7551–7559. [DOI] [PMC free article] [PubMed] [Google Scholar]
- (11).Lu N; Wei D; Chen F; Yang S-T, Lipidomic profiling and discovery of lipid biomarkers in snow alga chlamydomonas nivalis under salt stress. European Journal of Lipid Science and Technology 2012, 114 (3), 253–265. [Google Scholar]
- (12).Romantsov T; Guan Z; Wood JM, Cardiolipin and the osmotic stress responses of bacteria. Biochimica et Biophysica Acta (BBA) - Biomembranes 2009, 1788 (10), 2092–2100. [DOI] [PMC free article] [PubMed] [Google Scholar]
- (13).Chwastek G; Surma MA; Rizk S; Grosser D; Lavrynenko O; Rucińska M; Jambor H; Sáenz J, Principles of membrane adaptation revealed through environmentally induced bacterial lipidome remodeling. Cell Reports 2020, 32 (12), 108165. [DOI] [PubMed] [Google Scholar]
- (14).Sevin DC; Sauer U, Ubiquinone accumulation improves osmotic-stress tolerance in escherichia coli. Nat Chem Biol 2014, 10 (4), 266–272. [DOI] [PubMed] [Google Scholar]
- (15).Kate M, Chapter 9 membrane lipids of archaea. In New comprehensive biochemistry, Kates M; Kushner DJ; Matheson AT, Eds. Elsevier: 1993; Vol. 26, pp 261–295. [Google Scholar]
- (16).Lenaz G; Samori B; Fato R; Battino M; Castelli GP; Domini I, Localization and preferred orientations of ubiquinone homologs in model bilayers. Biochemistry and Cell Biology 1992, 70 (6), 504–514. [DOI] [PubMed] [Google Scholar]
- (17).Cornell BA; Keniry MA; Post A; Robertson RN; Weir LE; Westerman PW, Location and activity of ubiquinone 10 and ubiquinone analogs in model and biological membranes. Biochemistry 1987, 26 (24), 7702–7707. [DOI] [PubMed] [Google Scholar]
- (18).Quirk A; Lardner MJ; Tun Z; Burgess IJ, Surface-enhanced infrared spectroscopy and neutron reflectivity studies of ubiquinone in hybrid bilayer membranes under potential control. Langmuir 2016, 32 (9), 2225–2235. [DOI] [PubMed] [Google Scholar]
- (19).Jemiola-Rzeminska M; Kruk J; Skowronek M; Strzalka K, Location of ubiquinone homologues in liposome membranes studied by fluorescence anisotropy of diphenyl-hexatriene and trimethylammonium-diphenyl-hexatriene. Chemistry and Physics of Lipids 1996, 79 (1), 55–63. [DOI] [PubMed] [Google Scholar]
- (20).Hauß T; Dante S; Haines TH; Dencher NA, Localization of coenzyme q10 in the center of a deuterated lipid membrane by neutron diffraction. Biochimica et Biophysica Acta (BBA) - Bioenergetics 2005, 1710 (1), 57–62. [DOI] [PubMed] [Google Scholar]
- (21).Roche Y; Peretti P; Bernard S, Dsc and raman studies of the side chain length effect of ubiquinones on the thermotropic phase behavior of liposomes. Thermochimica Acta 2006, 447 (1), 81–88. [Google Scholar]
- (22).Ulrich EL; Girvin ME; Cramer WA; Markley JL, Location and mobility of ubiquinones of different chain lengths in artificial membrane vesicles. Biochemistry 1985, 24 (10), 2501–2508. [DOI] [PubMed] [Google Scholar]
- (23).Kingsley PB; Feigenson GW, 1h-nmr study of the location and motion of ubiquinones in perdeuterated phosphatidylcholine bilayers. Biochimica et Biophysica Acta (BBA) - Bioenergetics 1981, 635 (3), 602–618. [DOI] [PubMed] [Google Scholar]
- (24).Katsikas H; Quinn PJ, The polyisoprenoid chain length influences the interaction of ubiquinones with phospholipid bilayers. Biochimica et Biophysica Acta (BBA) - Biomembranes 1982, 689 (2), 363–369. [DOI] [PubMed] [Google Scholar]
- (25).Salvador-Castell M; Demé B; Oger P; Peters J, Lipid phase separation induced by the apolar polyisoprenoid squalane demonstrates its role in membrane domain formation in archaeal membranes. Langmuir 2020, 36 (26), 7375–7382. [DOI] [PubMed] [Google Scholar]
- (26).Kaurola P; Sharma V; Vonk A; Vattulainen I; Róg T, Distribution and dynamics of quinones in the lipid bilayer mimicking the inner membrane of mitochondria. Biochimica et Biophysica Acta (BBA) - Biomembranes 2016, 1858 (9), 2116–2122. [DOI] [PubMed] [Google Scholar]
- (27).Galassi VV; Arantes GM, Partition, orientation and mobility of ubiquinones in a lipid bilayer. Biochimica et Biophysica Acta (BBA) - Bioenergetics 2015, 1847 (12), 1560–1573. [DOI] [PubMed] [Google Scholar]
- (28).Teixeira MH; Arantes GM, Effects of lipid composition on membrane distribution and permeability of natural quinones. RSC Advances 2019, 9 (29), 16892–16899. [DOI] [PMC free article] [PubMed] [Google Scholar]
- (29).Söderhäll JA; Laaksonen A, Molecular dynamics simulations of ubiquinone inside a lipid bilayer. The Journal of Physical Chemistry B 2001, 105 (38), 9308–9315. [Google Scholar]
- (30).Agmo Hernandez V; Eriksson EK; Edwards K, Ubiquinone-10 alters mechanical properties and increases stability of phospholipid membranes. Biochim Biophys Acta 2015, 1848 (10 Pt A), 2233–2243. [DOI] [PubMed] [Google Scholar]
- (31).Schoepp-Cothenet B; Lieutaud C; Baymann F; Verméglio A; Friedrich T; Kramer DM; Nitschke W, Menaquinone as pool quinone in a purple bacterium. Proceedings of theNational Academy of Sciences 2009, 106 (21), 8549–8554. [DOI] [PMC free article] [PubMed] [Google Scholar]
- (32).Velikova V; Edreva A; Loreto F, Endogenous isoprene protects phragmites australis leaves against singlet oxygen. Physiologia Plantarum 2004, 122 (2), 219–225. [Google Scholar]
- (33).Resh MD, Covalent lipid modifications of proteins. Current Biology 2013, 23 (10), R431–R435. [DOI] [PMC free article] [PubMed] [Google Scholar]
- (34).Castelli F; Sarpietro MG; Micieli D; Stella B; Rocco F; Cattel L, Enhancement of gemcitabine affinity for biomembranes by conjugation with squalene: Differential scanning calorimetry and langmuir–blodgett studies using biomembrane models. Journal of Colloid and Interface Science 2007, 316 (1), 43–52. [DOI] [PubMed] [Google Scholar]
- (35).Caron J; Maksimenko A; Wack S; Lepeltier E; Bourgaux C; Morvan E; Leblanc K; Couvreur P; Desmaële D, Improving the antitumor activity of squalenoyl-paclitaxel conjugate nanoassemblies by manipulating the linker between paclitaxel and squalene. Advanced Healthcare Materials 2013, 2 (1), 172–185. [DOI] [PubMed] [Google Scholar]
- (36).Borrelli S; Cartelli D; Secundo F; Fumagalli G; Christodoulou MS; Borroni A; Perdicchia D; Dosio F; Milla P; Cappelletti G, et al. , Self-assembled squalene-based fluorescent heteronanoparticles. ChemPlusChem 2015, 80 (1), 47–49. [Google Scholar]
- (37).Borrelli S; Christodoulou MS; Ficarra I; Silvani A; Cappelletti G; Cartelli D; Damia G; Ricci F; Zucchetti M; Dosio F, et al. , New class of squalene-based releasable nanoassemblies of paclitaxel, podophyllotoxin, camptothecin and epothilone a. European Journal of Medicinal Chemistry 2014, 85, 179–190. [DOI] [PubMed] [Google Scholar]
- (38).Sarpietro MG; Micieli D; Rocco F; Ceruti M; Castelli F, Conjugation of squalene to acyclovir improves the affinity for biomembrane models. International Journal of Pharmaceutics 2009, 382 (1), 73–79. [DOI] [PubMed] [Google Scholar]
- (39).Heeg B; Needleman R; Khizhnyak A; L’Esperance D; Scott E; Markov V; Trolinger J, Bacteriorhodopsin as a chemical and biological sensor. SPIE: 2003; Vol. 5085. [Google Scholar]
- (40).Li YT; Tian Y; Tian H; Tu T; Gou GY; Wang Q; Qiao YC; Yang Y; Ren TL, A review on bacteriorhodopsin-based bioelectronic devices. Sensors (Basel) 2018, 18 (5). [DOI] [PMC free article] [PubMed] [Google Scholar]
- (41).Zou P; Zhao Y; Douglass AD; Hochbaum DR; Brinks D; Werley CA; Harrison DJ; Campbell RE; Cohen AE, Bright and fast multicoloured voltage reporters via electrochromic fret. Nat Commun 2014, 5, 4625. [DOI] [PMC free article] [PubMed] [Google Scholar]
- (42).Leonard AN; Pastor RW; Klauda JB, Parameterization of the charmm all-atom force field for ether lipids and model linear ethers. J Phys Chem B 2018, 122 (26), 6744–6754. [DOI] [PMC free article] [PubMed] [Google Scholar]
- (43).Lim JB; Klauda JB, Lipid chain branching at the iso- and anteiso-positions in complex chlamydia membranes: A molecular dynamics study. Biochim Biophys Acta 2011, 1808 (1), 323–331. [DOI] [PubMed] [Google Scholar]
- (44).Vanommeslaeghe K; Hatcher E; Acharya C; Kundu S; Zhong S; Shim J; Darian E; Guvench O; Lopes P; Vorobyov I, et al. , Charmm general force field: A force field for drug-like molecules compatible with the charmm all-atom additive biological force fields. J Comput Chem 2010, 31 (4), 671–690. [DOI] [PMC free article] [PubMed] [Google Scholar]
- (45).Liu Y; Ding X.-m.; Xue Z.-l.; Hu L.-x.; Zhang N.-j.; Wang Z; Yang J.-w.; Cheng Q; Chen M.-h.; Zhang Z.-z., et al. , The change of the state of cell membrane can enhance the synthesis of menaquinone in escherichia coli. World Journal of Microbiology and Biotechnology 2017, 33 (3), 52. [DOI] [PubMed] [Google Scholar]
- (46).Baj A; Wałejko P; Kutner A; Kaczmarek Ł; Morzycki JW; Witkowski S, Convergent synthesis of menaquinone-7 (mk-7). Organic Process Research & Development 2016, 20 (6), 1026–1033. [Google Scholar]
- (47).Abraham MJ; Murtola T; Schulz R; Páll S; Smith JC; Hess B; Lindahl E, Gromacs: High performance molecular simulations through multi-level parallelism from laptops to supercomputers. SoftwareX 2015, 1–2, 19–25. [Google Scholar]
- (48).Shirts MR; Chodera JD, Statistically optimal analysis of samples from multiple equilibrium states. J Chem Phys 2008, 129 (12), 124105. [DOI] [PMC free article] [PubMed] [Google Scholar]
- (49).Frisch MJ; Trucks GW; Schlegel HB; Scuseria GE; Robb MA; Cheeseman JR; Scalmani G; Barone V; Petersson GA; Nakatsuji H, et al. Gaussian 16 rev. C.01, Wallingford, CT, 2016. [Google Scholar]
- (50).Klauda JB; Garrison SL; Jiang J; Arora G; Sandler SI, Hm-ie: Quantum chemical hybrid methods for calculating interaction energies. The Journal of Physical Chemistry A 2004, 108 (1), 107–112. [Google Scholar]
- (51).Guvench O; MacKerell AD, Automated conformational energy fitting for force-field development. Journal of Molecular Modeling 2008, 14 (8), 667–679. [DOI] [PMC free article] [PubMed] [Google Scholar]
- (52).Zhang Y, I-tasser server for protein 3d structure prediction. BMC Bioinformatics 2008, 9, 40. [DOI] [PMC free article] [PubMed] [Google Scholar]
- (53).Yang J; Yan R; Roy A; Xu D; Poisson J; Zhang Y, The i-tasser suite: Protein structure and function prediction. Nat Methods 2015, 12 (1), 7–8. [DOI] [PMC free article] [PubMed] [Google Scholar]
- (54).Roy A; Kucukural A; Zhang Y, I-tasser: A unified platform for automated protein structure and function prediction. Nat Protoc 2010, 5 (4), 725–738. [DOI] [PMC free article] [PubMed] [Google Scholar]
- (55).Jo S; Lim JB; Klauda JB; Im W, Charmm-gui membrane builder for mixed bilayers and its application to yeast membranes. Biophys J 2009, 97 (1), 50–58. [DOI] [PMC free article] [PubMed] [Google Scholar]
- (56).Wu EL; Cheng X; Jo S; Rui H; Song KC; Davila-Contreras EM; Qi Y; Lee J; Monje-Galvan V; Venable RM, et al. , Charmm-gui membrane builder toward realistic biological membrane simulations. J Comput Chem 2014, 35 (27), 1997–2004. [DOI] [PMC free article] [PubMed] [Google Scholar]
- (57).Huang J; MacKerell AD Jr., Charmm36 all-atom additive protein force field: Validation based on comparison to nmr data. J Comput Chem 2013, 34 (25), 2135–2145. [DOI] [PMC free article] [PubMed] [Google Scholar]
- (58).Best RB; Zhu X; Shim J; Lopes PE; Mittal J; Feig M; Mackerell AD Jr., Optimization of the additive charmm all-atom protein force field targeting improved sampling of the backbone phi, psi and side-chain chi(1) and chi(2) dihedral angles. J Chem Theory Comput 2012, 8 (9), 3257–3273. [DOI] [PMC free article] [PubMed] [Google Scholar]
- (59).Klauda JB; Venable RM; Freites JA; O’Connor JW; Tobias DJ; Mondragon-Ramirez C; Vorobyov I; MacKerell AD Jr.; Pastor RW, Update of the charmm all-atom additive force field for lipids: Validation on six lipid types. J Phys Chem B 2010, 114 (23), 7830–7843. [DOI] [PMC free article] [PubMed] [Google Scholar]
- (60).Durell SR; Brooks BR; Ben-Naim A, Solvent-induced forces between two hydrophilic groups. The Journal of Physical Chemistry 1994, 98 (8), 2198–2202. [Google Scholar]
- (61).Jorgensen WL; Chandrasekhar J; Madura JD; Impey RW; Klein ML, Comparison of simple potential functions for simulating liquid water. The Journal of Chemical Physics 1983, 79 (2), 926–935. [Google Scholar]
- (62).Ryckaert J-P; Ciccotti G; Berendsen HJC, Numerical integration of the cartesian equations of motion of a system with constraints: Molecular dynamics of n-alkanes. Journal of Computational Physics 1977, 23 (3), 327–341. [Google Scholar]
- (63).Steinbach PJ; Brooks BR, New spherical-cutoff methods for long-range forces in macromolecular simulation. Journal of Computational Chemistry 1994, 15 (7), 667–683. [Google Scholar]
- (64).Essmann U; Perera L; Berkowitz ML; Darden T; Lee H; Pedersen LG, A smooth particle mesh ewald method. The Journal of Chemical Physics 1995, 103 (19), 8577–8593. [Google Scholar]
- (65).Åqvist J; Wennerström P; Nervall M; Bjelic S; Brandsdal BO, Molecular dynamics simulations of water and biomolecules with a monte carlo constant pressure algorithm. Chemical Physics Letters 2004, 384 (4), 288–294. [Google Scholar]
- (66).Chow K-H; Ferguson DM, Isothermal-isobaric molecular dynamics simulations with monte carlo volume sampling. Computer Physics Communications 1995, 91 (1), 283–289. [Google Scholar]
- (67).Lee J; Cheng X; Swails JM; Yeom MS; Eastman PK; Lemkul JA; Wei S; Buckner J; Jeong JC; Qi Y, et al. , Charmm-gui input generator for namd, gromacs, amber, openmm, and charmm/openmm simulations using the charmm36 additive force field. J Chem Theory Comput 2016, 12 (1), 405–413. [DOI] [PMC free article] [PubMed] [Google Scholar]
- (68).Jo S; Kim T; Iyer VG; Im W, Charmm-gui: A web-based graphical user interface for charmm. J Comput Chem 2008, 29 (11), 1859–1865. [DOI] [PubMed] [Google Scholar]
- (69).Eastman P; Swails J; Chodera JD; McGibbon RT; Zhao Y; Beauchamp KA; Wang LP; Simmonett AC; Harrigan MP; Stern CD, et al. , Openmm 7: Rapid development of high performance algorithms for molecular dynamics. PLoS Comput Biol 2017, 13 (7), e1005659. [DOI] [PMC free article] [PubMed] [Google Scholar]
- (70).Brooks BR; Brooks III CL; Mackerell AD Jr.; Nilsson L; Petrella RJ; Roux B; Won Y; Archontis G; Bartels C; Boresch S, et al. , Charmm: The biomolecular simulation program. Journal of Computational Chemistry 2009, 30 (10), 1545–1614. [DOI] [PMC free article] [PubMed] [Google Scholar]
- (71).Wildermuth KD; Monje-Galvan V; Warburton LM; Klauda JB, Effect of membrane lipid packing on stable binding of the alps peptide. J Chem Theory Comput 2019, 15 (2), 1418–1429. [DOI] [PubMed] [Google Scholar]
- (72).Humphrey W; Dalke A; Schulten K, Vmd: Visual molecular dynamics. Journal of Molecular Graphics 1996, 14 (1), 33–38. [DOI] [PubMed] [Google Scholar]
- (73).Bradski G, The opencv library. Dr. Dobb’s Journal of Software Tools 2000. [Google Scholar]
- (74).Venable RM; Krämer A; Pastor RW, Molecular dynamics simulations of membrane permeability. Chemical Reviews 2019, 119 (9), 5954–5997. [DOI] [PMC free article] [PubMed] [Google Scholar]
- (75).Loncharich RJ; Brooks BR; Pastor RW, Langevin dynamics of peptides: The frictional dependence of isomerization rates of n-acetylalanyl-n′-methylamide. Biopolymers 1992, 32 (5), 523–535. [DOI] [PubMed] [Google Scholar]
- (76).Scherer MK; Trendelkamp-Schroer B; Paul F; Pérez-Hernández G; Hoffmann M; Plattner N; Wehmeyer C; Prinz J-H; Noé F, Pyemma 2: A software package for estimation, validation, and analysis of markov models. Journal of Chemical Theory and Computation 2015, 11 (11), 5525–5542. [DOI] [PubMed] [Google Scholar]
- (77).Bakan A; Meireles LM; Bahar I, Prody: Protein dynamics inferred from theory and experiments. Bioinformatics 2011, 27 (11), 1575–1577. [DOI] [PMC free article] [PubMed] [Google Scholar]
- (78).Currie DJ; Lough CE; Silver RF; Holmes HL, Partition coefficients of some conjugated heteroenoid compounds and 1,4-naphthoquinones. Canadian Journal of Chemistry 1966, 44 (9), 1035–1043. [Google Scholar]
- (79).Shinoda W; Shinoda K; Baba T; Mikami M, Molecular dynamics study of bipolar tetraether lipid membranes. Biophys J 2005, 89 (5), 3195–3202. [DOI] [PMC free article] [PubMed] [Google Scholar]
- (80).Rawicz W; Olbrich KC; McIntosh T; Needham D; Evans E, Effect of chain length and unsaturation on elasticity of lipid bilayers. Biophysical Journal 2000, 79 (1), 328–339. [DOI] [PMC free article] [PubMed] [Google Scholar]
- (81).Braun AR; Sachs JN, Determining structural and mechanical properties from molecular dynamics simulations of lipid vesicles. Journal of Chemical Theory and Computation 2014, 10 (9), 4160–4168. [DOI] [PMC free article] [PubMed] [Google Scholar]
- (82).Shkulipa SA; Otter W. K. d.; Briels WJ, Simulations of the dynamics of thermal undulations in lipid bilayers in the tensionless state and under stress. The Journal of Chemical Physics 2006, 125 (23), 234905. [DOI] [PubMed] [Google Scholar]
- (83).Levine ZA; Venable RM; Watson MC; Lerner MG; Shea J-E; Pastor RW; Brown FLH, Determination of biomembrane bending moduli in fully atomistic simulations. Journal of the American Chemical Society 2014, 136 (39), 13582–13585. [DOI] [PMC free article] [PubMed] [Google Scholar]
- (84).Munn EA, 5 - chemical composition part 2: Lipids, metal ions, nucleotides and other anions. In The structure of mitochondria, Munn EA, Ed. Academic Press: 1974; pp 218–266. [Google Scholar]
- (85).Eriksson EK; Agmo Hernández V; Edwards K, Effect of ubiquinone-10 on the stability of biomimetic membranes of relevance for the inner mitochondrial membrane. Biochimica et Biophysica Acta (BBA) - Biomembranes 2018, 1860 (5), 1205–1215. [DOI] [PubMed] [Google Scholar]
- (86).Gonzalez C; Lim EC, A quantum chemistry study of the van der waals dimers of benzene, naphthalene, and anthracene: Crossed (d2d) and parallel-displaced (c2h) dimers of very similar energies in the linear polyacenes. The Journal of Physical Chemistry A 2000, 104 (13), 2953–2957. [Google Scholar]
- (87).Basu I; Chattopadhyay A; Mukhopadhyay C, Ion channel stability of gramicidin a in lipid bilayers: Effect of hydrophobic mismatch. Biochimica et Biophysica Acta (BBA) - Biomembranes 2014, 1838 (1, Part B), 328–338. [DOI] [PubMed] [Google Scholar]
- (88).Kelkar DA; Chattopadhyay A, Modulation of gramicidin channel conformation and organization by hydrophobic mismatch in saturated phosphatidylcholine bilayers. Biochimica et Biophysica Acta (BBA) - Biomembranes 2007, 1768 (5), 1103–1113. [DOI] [PubMed] [Google Scholar]
- (89).Sodt AJ; Beaven AH; Andersen OS; Im W; Pastor RW, Gramicidin a channel formation induces local lipid redistribution ii: A 3d continuum elastic model. Biophysical Journal 2017, 112 (6), 1198–1213. [DOI] [PMC free article] [PubMed] [Google Scholar]
- (90).Kim T; Lee Kyu I.; Morris P; Pastor Richard W.; Andersen Olaf S.; Im W, Influence of hydrophobic mismatch on structures and dynamics of gramicidin a and lipid bilayers. Biophysical Journal 2012, 102 (7), 1551–1560. [DOI] [PMC free article] [PubMed] [Google Scholar]
- (91).Park S; Beaven AH; Klauda JB; Im W, How tolerant are membrane simulations with mismatch in area per lipid between leaflets? J Chem Theory Comput 2015, 11 (7), 3466–3477. [DOI] [PMC free article] [PubMed] [Google Scholar]
- (92).Palanco ME; Skovgaard N; Hansen JS; Berg-Sørensen K; Hélix-Nielsen C, Tuning biomimetic membrane barrier properties by hydrocarbon, cholesterol and polymeric additives. Bioinspiration & Biomimetics 2017, 13 (1), 016005. [DOI] [PubMed] [Google Scholar]
- (93).Csáky Z; Garaiová M; Kodedová M; Valachovič M; Sychrová H; Hapala I, Squalene lipotoxicity in a lipid droplet-less yeast mutant is linked to plasma membrane dysfunction. Yeast 2020, 37 (1), 45–62. [DOI] [PubMed] [Google Scholar]
- (94).LoRicco JG; Salvador-Castell M; Demé B; Peters J; Oger PM, Apolar polyisoprenoids located in the midplane of the bilayer regulate the response of an archaeal-like membrane to high temperature and pressure. Frontiers in Chemistry 2020, 8 (1061). [DOI] [PMC free article] [PubMed] [Google Scholar]
- (95).Sikkema J; de Bont JA; Poolman B, Interactions of cyclic hydrocarbons with biological membranes. Journal of Biological Chemistry 1994, 269 (11), 8022–8028. [PubMed] [Google Scholar]
- (96).Wood JM, Bacterial responses to osmotic challenges. Journal of General Physiology 2015, 145 (5), 381–388. [DOI] [PMC free article] [PubMed] [Google Scholar]
- (97).Rojas E; Theriot JA; Huang KC, Response of escherichia coli growth rate to osmotic shock. Proceedings of the National Academy of Sciences 2014, 111 (21), 7807–7812. [DOI] [PMC free article] [PubMed] [Google Scholar]
- (98).Cohen S; Oren A; Shilo M, The divalent cation requirement of dead sea halobacteria. Archives of Microbiology 1983, 136 (3), 184–190. [Google Scholar]
- (99).Murphy DJ, The dynamic roles of intracellular lipid droplets: From archaea to mammals. Protoplasma 2012, 249 (3), 541–585. [DOI] [PubMed] [Google Scholar]
- (100).Tan D; Yin J; Chen GQ, 29 - production of polyhydroxyalkanoates. In Current developments in biotechnology and bioengineering, Pandey A; Negi S; Soccol CR, Eds. Elsevier: 2017; pp 655–692. [Google Scholar]
- (101).Wältermann M; Steinbüchel A, Neutral lipid bodies in prokaryotes: Recent insights into structure, formation, and relationship to eukaryotic lipid depots. Journal of Bacteriology 2005, 187 (11), 3607–3619. [DOI] [PMC free article] [PubMed] [Google Scholar]
- (102).Hezayen FF; Steinbüchel A; Rehm BHA, Biochemical and enzymological properties of the polyhydroxybutyrate synthase from the extremely halophilic archaeon strain 56. Archives of Biochemistry and Biophysics 2002, 403 (2), 284–291. [DOI] [PubMed] [Google Scholar]
- (103).Jing Z; Liu C; Cheng SY; Qi R; Walker BD; Piquemal J-P; Ren P, Polarizable force fields for biomolecular simulations: Recent advances and applications. Annual Review of Biophysics 2019, 48 (1), 371–394. [DOI] [PMC free article] [PubMed] [Google Scholar]
Associated Data
This section collects any data citations, data availability statements, or supplementary materials included in this article.