

Abstract
Objectives
We investigated whether high responsiveness or low responsiveness to exercise training aggregates in the same individuals across seven cardiometabolic traits.
Methods
A total of 564 adults (29.2% black, 53.7% female) from the HERITAGE family study completed a 20-week endurance training programme (at 55%–75% of participants’ maximal oxygen uptake (VO2max)) with VO2max, per cent body fat, visceral adipose tissue, fasting levels of insulin, high-density lipoprotein cholesterol, small low-density lipoprotein particles and inflammatory marker GlycA measured before and after training. For each exercise response trait, we created ethnicity-specific, sex-specific and generation-specific quintiles. High responses were defined as those within the 20th percentile representing the favourable end of the response trait distribution, low responses were defined as the 20th percentile from the least favourable end, and the remaining were labelled as average responses.
Results
Only one individual had universally high or low responses for all seven cardiometabolic traits. Almost half (49%) of the cohort had at least one high response and one low response across the seven traits. About 24% had at least one high response but no low responses, 24% had one or more low responses but no high responses, and 2.5% had average responses across all traits.
Conclusions
Interindividual variation in exercise responses was evident in all the traits we investigated, and responsiveness did not aggregate consistently in the same individuals. While adherence to an exercise prescription is known to produce health benefits, targeted risk factors may not improve.
INTRODUCTION
After several decades of research, consensus statements and advocacy work, physical activity is recognised as a healthy behaviour in public health policies and in the prevention and treatment of various common noncommunicable diseases.1 Regular exercise induces multiple beneficial changes in common cardiovascular and metabolic risk factors. Moreover, observational prospective studies have indicated that mortality rates and morbidity of common noncommunicable diseases decline in a graded fashion among those who are physically active, as compared with their inactive counterparts.1 Now that physical activity recommendations have been incorporated in public health policies, one remaining challenge is to develop physical activity counselling in clinical practice and care of individual patients. We and others have shown that there are considerable interindividual differences in the effects of standardised, supervised exercise training on select risk factors including measures of adiposity, endurance capacity and inflammation.2–10 The situation is further complicated by the fact that we do not know how the multiple health benefits of exercise are distributed across the population: do the same individuals always get the greatest benefits for all/most health outcomes, while others always experience little or no benefits, or are the exercise responses distributed heterogeneously among individuals and cardiometabolic risk factors?
The concept that ‘exercise is medicine’ is gaining popularity, in part due to a large Exercise is Medicine global health initiative launched by the American College of Sports Medicine in 2007. This initiative is grounded in the fact that regular physical activity may serve as an alternative or adjunct to many pharmaceuticals and should be a component of a holistic approach to disease prevention and treatment. The advantage of exercise over most pharmaceutical agents resides in its high degree of safety and broad beneficial effects on health outcomes. However, if exercise is to be marketed as medicine, it is important to realise that, just like pharmaceuticals, the effects of regular exercise can vary widely among individuals. To optimise exercise prescriptions and make physical activity part of personalised medicine, it is fundamental to know whether health outcomes and/or risk factors (traits) respond in a consistent manner within individuals. Therefore, the goal of the present study was to examine patterns of interindividual variation in response to regular exercise across multiple phenotypes and physiological categories, in a large, diverse and well-controlled exercise training study. We hypothesised that, across multiple cardiometabolic traits, responses to an exercise training intervention are characterised by substantial interindividual variation and that responsiveness does not aggregate in the same individuals.
METHODS
Subjects and study design
The sample, study design and exercise training protocol of the HEalth, RIsk factors, exercise Training And GEnetics (HERITAGE) family study have been described elsewhere.11 Briefly, 742 black and white community-dwelling adults from 204 families were recruited to one of the four clinical centres (Indiana University, Laval University in Québec, the University of Minnesota and The University of Texas at Austin), where they completed the endurance exercise training programme with ≥95% adherence. A total of 564 subjects had complete data for the present report. Parents were 65 years of age or less, while offspring ranged in age from 17 to 41 years. Subjects were inactive at baseline, normotensive or mildly hypertensive (<160/100 mm Hg) and were not taking medications for hypertension, diabetes or dyslipidaemia. Written informed consent was obtained from each participant.
Patient and public involvement
Patients and/or the public were not involved in the design, conduct, reporting, or dissemination plans of this research.
Exercise intervention
Each subject exercised three times per week for 20 weeks on cycle ergometers. The intensity of the exercise was customised for each individual based on heart rate (HR) and maximal oxygen uptake (VO2max) measurements taken at the baseline test. Details of the exercise training protocol can be found elsewhere.11 Briefly, subjects trained at the HR associated with 55% of baseline VO2max for 30 min per session for the first 2 weeks. The duration and intensity were gradually increased, one at a time every 2 weeks, until reaching 50 min and 75% of the HR associated with baseline VO2max. This level was maintained for the final 6 weeks of training. All exercise was performed on Universal Aerobicycles (Cedar Rapids, Iowa, USA) and power output was controlled by direct HR monitoring using the Universal Gym Mednet (Cedar Rapids, Iowa, USA) computerised system.
Regular exercise response phenotype selection
A total of seven exercise response phenotypes (traits) were selected for the analyses: ΔVO2max, per cent body fat (Δ%fat), visceral adipose tissue (ΔVAT), plasma high-density lipoprotein cholesterol (ΔHDL-C), plasma small low-density lipoprotein particle concentration (Δsmall LDL-P), plasma fasting insulin (Δinsulin) and plasma inflammatory marker GlycA (ΔGlycA). Phenotypes were selected if they were clinically or physiologically relevant to health-related fitness and showed statistically significant group level improvements with regular exercise in the HERITAGE family study participants (online supplemental table S1).12–18
Phenotype measurements
Maximal oxygen uptake
Two maximal exercise tests to measure VO2max were performed on two separate days at baseline and again on two separate days after completion of the exercise programme on a SensorMedics 800S (Yorba Linda, California, USA) cycle ergometer and using a SensorMedics 2900 metabolic measurement cart, as previously described.12 The average VO2max from these two tests was taken as the VO2max for that subject and used in analyses if both values were within 5% of each other. If they differed by >5%, the higher VO2max value was used.
Lipids, lipoproteins and insulin
Samples were taken twice at baseline and 24 hours and 72 hours after the last exercise session in the morning following a 12-hour fast.14 The HDL fraction was obtained after precipitation of LDL in the infranatant by the heparin–manganese chloride method.19 The cholesterol content of the HDL fraction was measured before and after the precipitation step. For each time point (ie, baseline and post-training), the two HDL-C values were averaged and used for analyses. Lipoprotein traits were adjusted for changes in exercise induced changes in haemodilution. Extensive quality-control procedures were implemented to ensure high quality lipid assays20 and other study data.21 Comprehensive lipoprotein analysis was performed on fasting plasma samples collected before and after completion of exercise training by nuclear magnetic resonance (NMR) spectroscopy at LabCorp (Morrisville, North Carolina, USA) using the LipoProfile-3 algorithm.22 Each measurement included values for the concentration of small LDL-P and GlycA, as previously described.22,23 Plasma insulin was measured by radioimmunoassay after polyethylene glycol separation.24 The intra-assay and interassay coefficients of variation were 7.7% and 10.3%, respectively.
Body composition
%fat was assessed by hydrostatic weighing, as described previously.16 %fat was estimated from body density by using the equations of Siri25 for white men, Lohman26 for white women, Schutte et al27 for black men, and Ortiz et al28 for black women. VAT level was assessed by CT, as described previously.16
For all seven variables change in response to the exercise training programme (ie, delta or Δ) was calculated by subtracting the baseline value from the post-training value. Additionally, for all measures phenotyping was performed using standardised quality assurance and control procedures, with low coefficients of variation (table 1).2,20,29–31
Table 1.
Reproducibility of trait measurements in HERITAGE
| Test-retest* | ICQC† | |||||||
|---|---|---|---|---|---|---|---|---|
| Trait | ICC | CV | N | ICC | CV, % | N | TE | SWC‡ |
| VO2max29,30 | 0.97 | 5.0% | 742 | 0.96 | 4.7% | 55 | 137 mL/min | 148 mL/min |
| HDL-C20 | 0.94 | 6.2% | 379 | 0.94 | 6.0% | 60 | 2.32 mg/dL | 1.9 mg/dL |
| Body fat31 | – | – | – | 0.99 | 4.0% | 60 | 0.8% | 2.1% |
| f-insulin2 | 0.78–0.94 | 19%−30% | 624–779§ | – | – | – | 17 pmol/L | 10.1 pmol/L |
Test–retest from two measures taken on two different days.
From measures collected across 3 days within 3 weeks as part of an ICQC substudy.
SWC was calculated as 0.2×SD value at baseline.
Values for insulin are given for repeated measures at baseline (n=779) and post-training (n=624) measurements.
CV, coefficient of variation; HDL-C, high-density lipoprotein cholesterol; ICC, intraclass correlation coefficients; ICQC, intracentre quality control; SWC, smallest worthwhile change; TE, technical error; VO2, maximal oxygen uptake.
Definition of high response and low response
Quintile-based classification (primary analysis)
High response was defined as a value within the 20th percentile representing the favourable end of the exercise response trait distribution (eg, top end for VO2max response, bottom end for fasting insulin response), while low response was defined as the 20th percentile from the least favourable end. To avoid ethnicity, sex and generation-related differences in responses to regular exercise, the percentiles were defined within ethnicity, sex and generation-specific subgroups (online supplemental table S2). For descriptive purposes, responses between the 20th and 80th percentile were labelled as average. For each trait, high and low response (mutually exclusive within a trait) was scored as yes=1 and no=0, and summary scores for high and low responsiveness were created by summing the individual scores across all traits. Thus, an individual with universal high or low responses would have a score of 7 (eg, high responses for all seven traits), while a subject with universal average responses would score 0 (ie, average response for all seven traits).
CI and smallest worthwhile change-based classification
As a form of validation, we also classified responses as low, average, or high based on 50% confidence intervals (CIs) and a smallest worthwhile change (SWC) of 0.2 times the SD of baseline measures as previously recommended.32 CIs were calculated using existing technical error (TE) values (ie, change score±[0.67 × (√2×TE)] from previous quality control studies for four traits: VO2max (TE=137 mL/min), body fat percentage (TE=0.8%), HDL-C (TE=2.32 mg/dL) and fasting insulin (TE=17 pmol/L)2,20,29–31 (table 1). If the entire CI fell ‘above’ the SWC in the beneficial direction that response was labelled high, if the entire CI fell outside the SWC in the negative direction that response was labelled low, and all others were labelled average. Thus, a 50% true response CI for HDL-C for an individual was calculated as change score±[0.67 × (√2×2.32)] and if the lower bound of the CI fell above the SWC (1.93 mg/dL for HDL-C) the response was labelled high and if the upper bound of the CI fell below −1.93 mg/dL the response was labelled low.
Statistical analysis
Relationships among the responses to regular exercise (quantitative traits) were tested using Pearson correlation coefficients. Correlations were calculated using raw phenotypes (unadjusted correlations), as well as using age, sex, ethnicity and baseline trait value adjusted standardised residuals of the response traits (partial correlations). To account for the fact that seven traits were examined, we defined statistical significance as p<0.007 (Bonferroni multiple testing correction of 0.05/7) for the correlation analysis. General linear models were used to examine mean differences in baseline trait values across response groups. SAS software V.9.4 was used for all analyses.
RESULTS
Participant demographic and anthropometric measures can be found in table 2. Baseline levels and exercise training-induced changes in the seven target phenotypes are presented in table 3. There were significant differences in mean baseline values across exercise response groups for all seven traits (table 3).
Table 2.
Participant baseline anthropometric characteristics
| Trait | Total (n=564) | Males (n=261) | Females (n=303) |
|---|---|---|---|
| Age (years) | 34.6 (13.6) | 35.8 (14.3) | 33.6 (12.9) |
| Race (white/black) | 399/165 | 193/68 | 206/97 |
| BMI (kg/m2) | 26.0 (4.9) | 26.8 (5.2) | 25.6 (5.2) |
| VO2max (mL/min) | 2373.4 (710.2) | 2368.0 (689.7) | 1879.5 (360.7) |
| Body fat (%) | 27.4 (10.1) | 29.2 (10.0) | 31.4 (9.8) |
| Total cholesterol (mg/dL) | 171.1 (36.4) | 172.8 (35.6) | 169.6 (37.1) |
| LDL cholesterol (mg/dL) | 113.9 (31.3) | 116.3 (31.1) | 111.8 (31.4) |
| Systolic blood pressure (mm Hg) | 117.6 (11.6) | 118.7 (13.1) | 116.7 (10.2) |
| Diastolic blood pressure (mm Hg) | 67.2 (8.6) | 67.8 (9.0) | 66.8 (8.2) |
Values are mean (SD).
BMI, body mass index; LDL, low-density lipoprotein; VO2, maximal oxygen uptake.
Table 3.
Mean baseline values and training responses of the six target traits among participants with low, average and high responses in the HERITAGE family study
| Training response status | ||||
|---|---|---|---|---|
| Trait | Low | Average | High | P value* |
| VO2max (mL/min) | n=110 | n=344 | n=110 | 0.036 † |
| Baseline | 2525 (67) | 2325 (38) | 2372 (67) | |
| Response | +140 (11) | +386 (6) | +675 (11) | |
| Body fat (%) | n=110 | n=343 | n=111 | 0.006 ‡ |
| Baseline | 24.7 (1.0) | 28.0 (0.5) | 28.5 (1.0) | |
| Response | +1.7 (0.09) | −0.8 (0.05) | −3.4 (0.09) | |
| VAT (cm2) | n=110 | n=345 | n=109 | <0.0001 § |
| Baseline | 77.8 (5.1) | 72.8 (2.9) | 120.8 (5.1) | |
| Response | +14.1 (0.8) | −4.2 (0.5) | −25.6 (0.8) | |
| f-insulin (pmol/L) | n=111 | n=344 | n=109 | <0.0001 § |
| Baseline | 59.0 (4.2) | 57.6 (2.4) | 118.8 (4.3) | |
| Response | +24.0 (2.3) | −5.0 (1.3) | −50.7 (2.3) | |
| HDL-C (mg/dL) | n=112 | n=341 | n=111 | <0.0001¶ |
| Baseline | 45.5 (1.0) | 39.2 (0.6) | 42.2 (1.0) | |
| Response | −4.7 (0.2) | +1.5 (0.1) | +8.0 (0.2) | |
| Small LDL-P (nmol/L) | n=110 | n=345 | n=109 | <0.0001¶ |
| Baseline | 422 (26) | 484 (15) | 669 (26) | |
| Response | +240 (10) | −16 (6) | −254 (10) | |
| GlycA (μmol/L) | n=109 | n=346 | n=109 | <0.0001 § |
| Baseline | 305 (5.0) | 315 (2.8) | 364 (5.0) | |
| Response | +53.5 (2.1) | −3.4 (1.2) | −56.4 (2.1) | |
P values are for comparisons (analysis of variance) of the baseline values across the three training response categories.
P<0.05 for difference between low and average groups.
P<0.05 for difference between low and all other groups.
P<0.05 for difference between high and all other groups.
P<0.05 for difference between all groups.
f-insulin, fasting plasma insulin; HDL-C, high-density lipoprotein cholesterol; LDL-P, low-density lipoprotein particle; VAT, visceral adipose tissue; VO2, maximal oxygen uptake.
Distributions of the seven regular exercise responses among the 564 completers are depicted in online supplemental figures 1–7). All seven traits showed both statistically significant improvements (mean effects in total sample) with exercise but marked interindividual differences in response patterns. Except for Δinsulin, all other response variables were normally distributed (skewness < |0.64|), while at least one of the extreme values (minimum and maximum) for Δinsulin, ΔHDL-C, Δsmall LDL-P and ΔGlycA exceeded 4.0 SD from the group mean (online supplemental table S1).
To examine if high or low responses to regular exercise aggregate in the same individuals, we first analysed bivariate correlations between the seven exercise response traits using both raw, unadjusted values, as well as response values adjusted for age, sex, ethnicity and baseline value of each response trait (table 4). The correlations between Δ%fat and ΔVAT, ΔHDL-C and Δsmall LDL-P, and Δsmall LDL-P and ΔGlycA were significant in both models. The strongest correlation was observed between Δ%fat and ΔVAT (unadjusted r=0.32, adjusted r=0.35, p<0.0001 for both). HDL-C and small LDL-P responses were inversely correlated (unadjusted r=−0.23, adjusted r=−0.27, p<0.0001 for both), while Δsmall LDL-P and ΔGlycA showed a direct association (unadjusted and adjusted r=0.20, p<0.0001 for both). Besides the significant, yet weak unadjusted correlation with Δ%fat, ΔVO2max did not correlate with any of the other response traits (table 4).
Table 4.
Correlation coefficients between exercise training responses in the HERITAGE family study (N=564)
| %fat | VAT | Insulin | HDL-C | Small LDL-P | GlycA | |
|---|---|---|---|---|---|---|
| VO2max | −0.13 (0.002) | −0.06 (0.16) | 0.03 (0.43) | 0.04 (0.32) | −0.09 (0.03) | −0.04 (0.30) |
| −0.09 (0.02) | −0.05 (0.25) | 0.03 (0.45) | 0.06 (0.17) | −0.07 (0.10) | −0.05 (0.20) | |
| %fat | 0.32 (<0.0001) | 0.07 (0.09) | −0.06 (0.17) | 0.09 (0.03) | 0.05 (0.24) | |
| 0.35 (<0.0001) | 0.16 (0.0001) | −0.07 (0.10) | 0.08 (0.06) | 0.03 (0.42) | ||
| VAT | 0.13 (0.003) | −0.04 (0.29) | 0.14 (0.001) | 0.12 (0.004) | ||
| 0.23 (<0.0001) | −0.07 (0.10) | 0.10 (0.02) | 0.08 (0.05) | |||
| f-insulin | −0.01 (0.75) | 0.03 (0.50) | 0.09 (0.03) | |||
| −0.09 (0.04) | 0.05 (0.25) | 0.13 (0.002) | ||||
| HDL-C | −0.23 (<0.0001) | −0.10 (0.01) | ||||
| −0.27 (<0.0001) | −0.11 (0.01) | |||||
| Small LDL-P | 0.20 (<0.0001) | |||||
| 0.20 (<0.0001) |
Values are Pearson correlation coefficients and (p value). Top values are unadjusted correlations, bottom values are correlations adjusted for age, sex, ethnicity and baseline value of the response traits.
Multiple testing corrected threshold for statistical significance p<0.007.
Signficant values are shown in italics.
%fat, per cent body fat; f-insulin, fasting plasma insulin; f-insulin, fasting plasma insulin; HDL-C, high-density lipoprotein cholesterol; LDL-P, low-density lipoprotein particle; VAT, visceral adipose tissue; VO2, maximal oxygen uptake.
In addition to bivariate correlations, we analysed the distribution of high and low responses of the seven traits among all subjects. Distributions of the high and low response summary scores are summarised in table 5, while distribution of low, average and high responses at the individual level are shown in figure 1. We found only one individual (0.18% of the cohort) with high responses for all seven traits and one individual with low responses for all seven traits. Eight individuals (1.4% of the cohort) had low responses for five or more traits, while 25 were low for four traits. On the other hand, 73.6% of the subjects had at least one high and 73.2% had a least one low response across the tested traits (table 5). In addition, cross-tabulation of the low and high response scores shows that the distributions are quite variable: almost half of the cohort (49.3%, n=278) had at least one low response and one high response, 24.3% had at least one high response but no low responses, and 23.9% had at least one low response but no high responses (table 5). Finally, 2.5% (n=14) of the subjects consistently and apparently universally had average responses for all traits (ie, no high or low responses for any trait). When a conservative CI-SWC-based classification scheme was applied we found similar interindividual variation in responses. For each trait other than VO2max, a substantial proportion of individuals had either high or low responses. Approximately one-fifth of the subjects had high responses for ΔHDL-C, Δinsulin, and Δ%fat (25%, 27%, and 12% respectively), while a smaller, but still substantial proportion of individuals had low/negative responses (9%, 6% and 2% respectively). Furthermore, across the four phenotypes, 470 individuals had at least one high response trait and 90 had at least one low response trait using CI-SWC classification. No individuals had universally low responses and only four individuals had universally high responses with this method (table 6).
Table 5.
Distribution of the high and low training response scores across seven phenotypes
| # of high-response traits | Low response | ||||||||
|---|---|---|---|---|---|---|---|---|---|
| 0 | 1 | 2 | 3 | 4 | 5 | 6 | 7 | Total | |
| # of low-response traits | |||||||||
| 0 | 2.5 (14) | 8.5 (48) | 8.1 (46) | 3.9 (22) | 2.7 (15) | 0.7 (4) | 0.2 (1) | 0.2 (1) | 26.8 (151) |
| 1 | 7.1 (40) | 12.1 (68) | 11.2 (63) | 3.7 (21) | 1.4 (8) | 0 | 0 | 0 | 35.5 (200) |
| 2 | 6.7 (38) | 7.8 (44) | 3.7 (21) | 0.9 (5) | 0.5 (3) | 0.2 (1) | 0 | 0 | 19.8 (112) |
| 3 | 5.7 (32) | 4.1 (23) | 1.8 (10) | 0.3 (2) | 0.2 (1) | 0 | 0 | 0 | 12.1 (68) |
| 4 | 3.2 (18) | 1.0 (6) | 0.2 (1) | 0 | 0 | 0 | 0 | 0 | 4.4 (25) |
| 5 | 0.7 (4) | 0.2 (1) | 0 | 0 | 0 | 0 | 0 | 0 | 0.9 (5) |
| 6 | 0.3 (2) | 0 | 0 | 0 | 0 | 0 | 0 | 0 | 0.3 (2) |
| 7 | 0.2 (1) | 0 | 0 | 0 | 0 | 0 | 0 | 0 | 0.2 (1) |
| 26.4 (149) | 33.7 (190) | 25.0 (141) | 8.8 (50) | 4.8 (27) | 0.9 (5) | 0.2 (1) | 0.2 (1) | 100 (564) | |
| High-response Total | |||||||||
Frequencies are given as percentage (number of subjects); total n=564.
Figure 1.
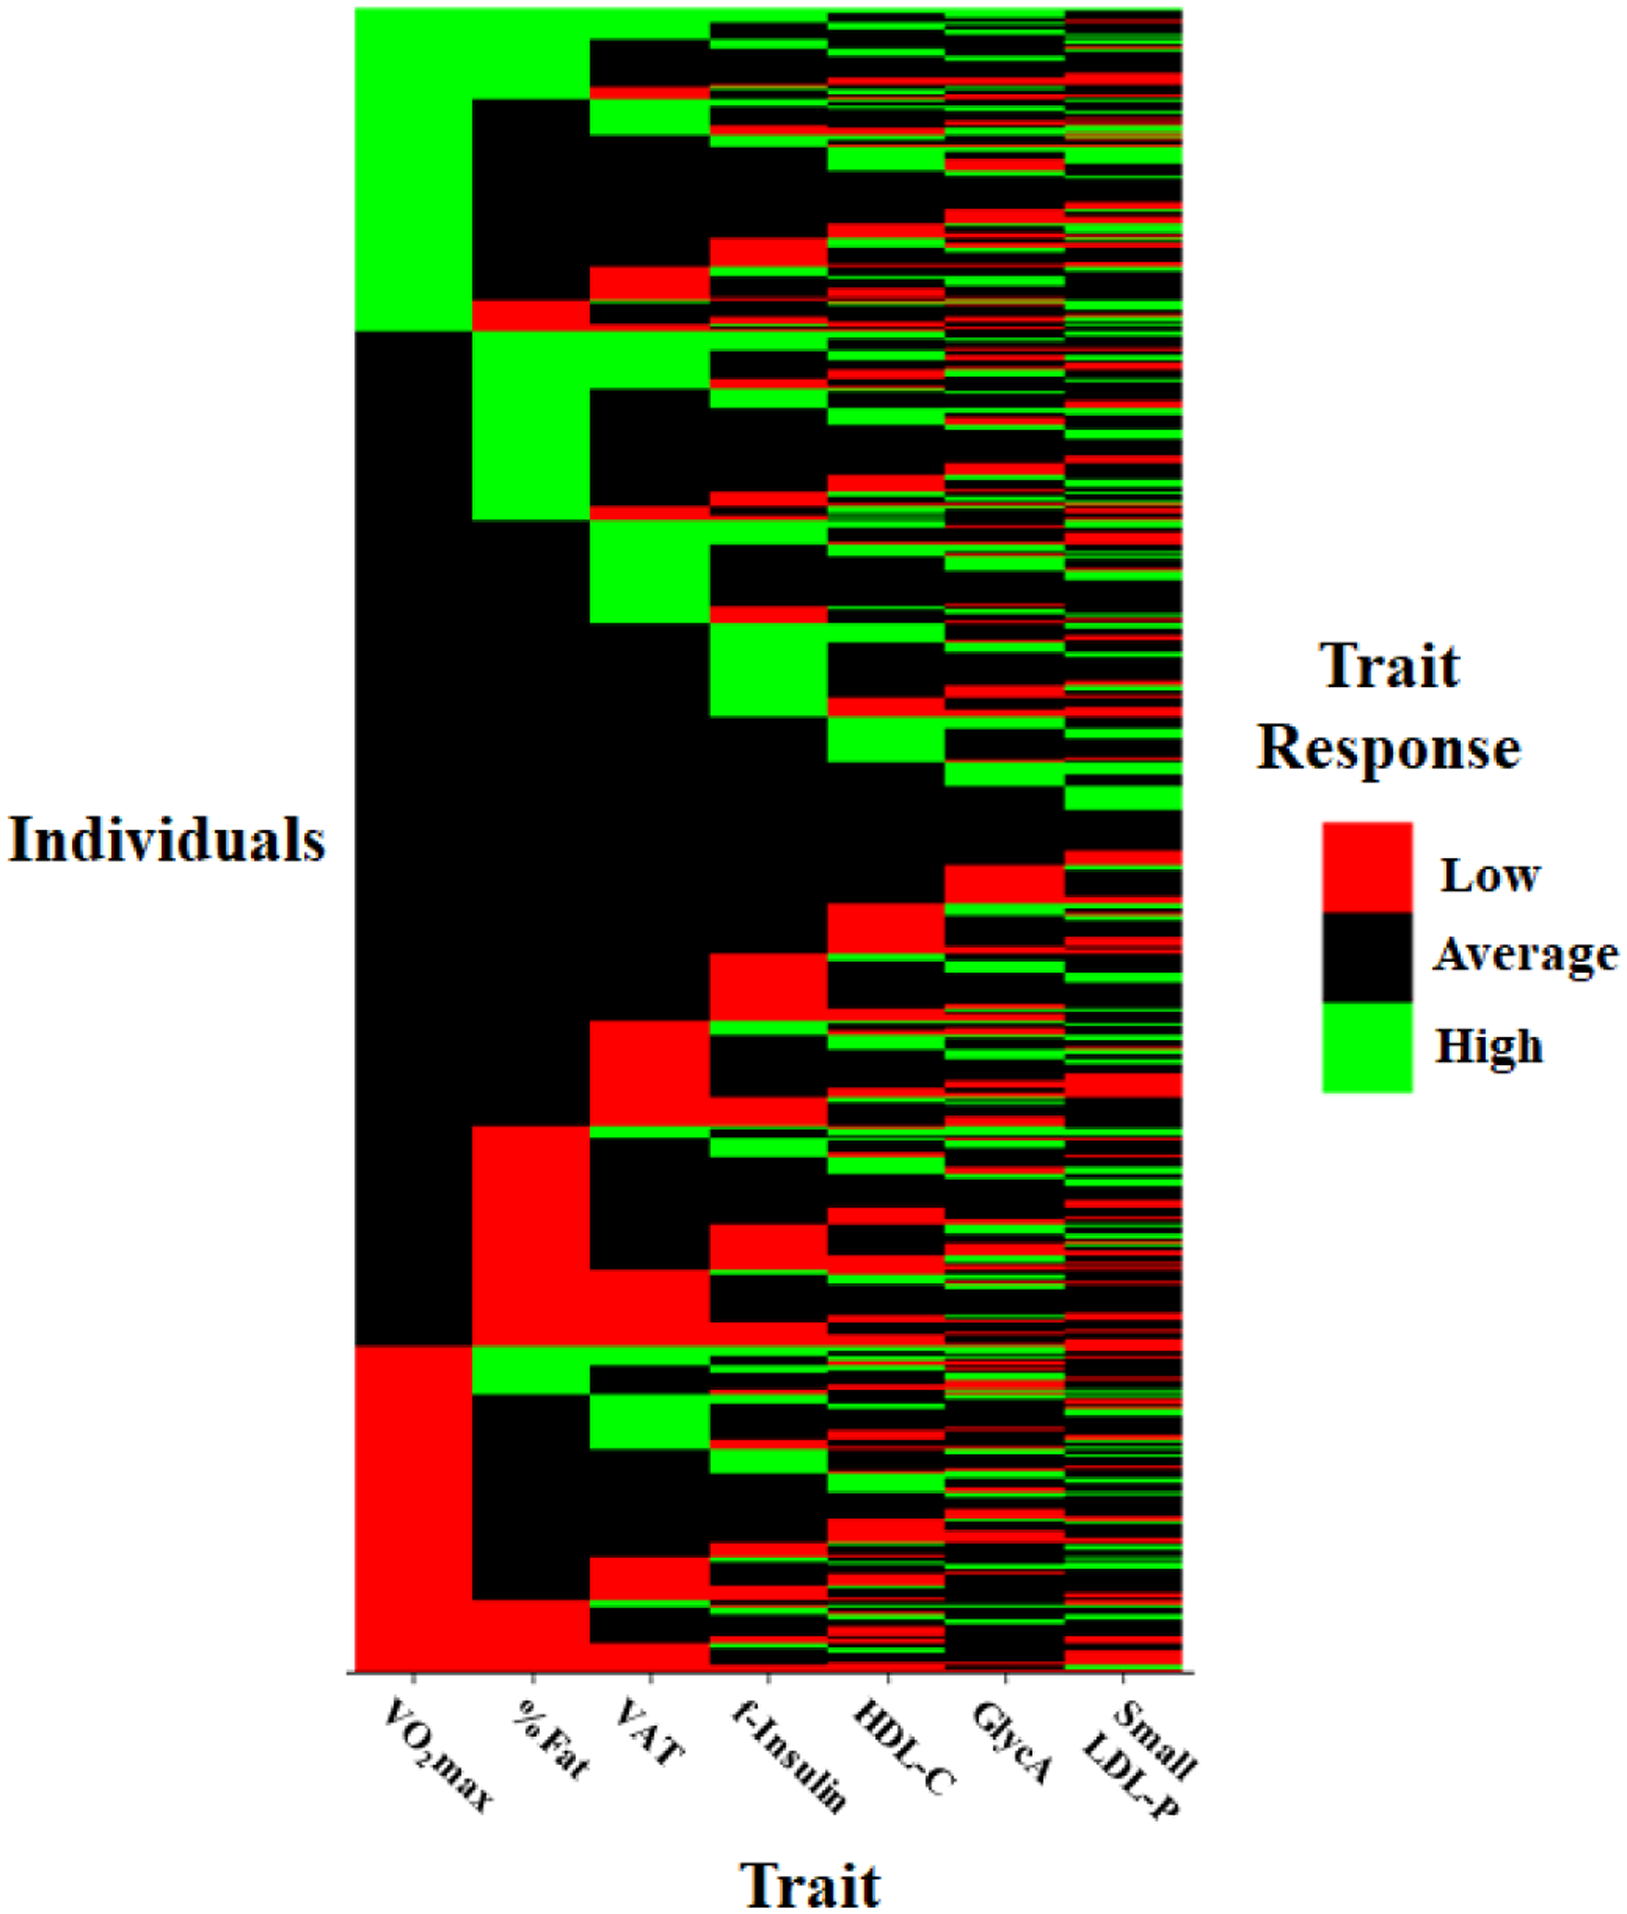
Heat map of individual distributions of low, average and high responses to regular exercise across seven traits. Each row represents the response status of an individual to a given trait. %Fat, per cent body fat; f-insulin: fasting plasma insulin; HDL-C, high-density lipoprotein cholesterol; LDL-P, low-density lipoprotein particle concentration; VO2max, maximal oxygen uptake.
Table 6.
Distribution of the high and low training response scores across four phenotypes based on a true change 50% CI and smallest worthwhile change
| Training response status | |||
|---|---|---|---|
| Trait | Low | Average | High |
| VO2max (mL/min) | 0% (0) | 30% (171) | 70% (394) |
| Body fat (%) | 3% (13) | 85% (482) | 12% (69) |
| f-insulin (pmol/L) | 6% (35) | 77% (435) | 17% (94) |
| HDL-C (mg/dL) | 9% (49) | 66% (375) | 25% (140) |
| Total | 4% | 65% | 31% |
Frequencies are given as percentage (number of subjects); total N=564. VO2max: TE=137 mL/min, SWC=148 mL/min; body fat: TE=0.8%, SWC=2.1; f-insulin: TE=17 pmol/L, SWC=10.1; HDL-C: TE=2.3 mg/dL, SWC=1.9.
f-insulin, fasting plasma insulin; HDL-C, high-density lipoprotein cholesterol; SWC, smallest worthwhile change; TE, technical error; VO2, maximal oxygen uptake.
DISCUSSION
Over the last several decades, randomised controlled exercise interventions have established that habitual physical activity induces beneficial changes in several risk factors for cardiovascular disease, diabetes, osteoporosis and other common noncommunicable diseases. Consequently, a physically active lifestyle is now recommended as an integral part of treatment of elevated blood pressure, low HDL-C, high triglycerides, obesity, insulin resistance and other metabolic disturbances.33 The group-level evidence summarised in the Physical Activity Guidelines for Americans1,33 is at the origin of the widespread view that regular exercise produces the same benefits in all individuals and that these benefits apply to all health-related risk factors. However, such expectations are not evidence based. The present data clearly show that there are marked interindividual differences in regular exercise responses and the response patterns vary considerably within an individual across multiple cardiometabolic traits.
The present study confirmed that interindividual variation in exercise responses, previously reported in select phenotypes,2,7,9,10 applied to a broad range of cardiometabolic traits and that the differences in exercise-related benefits between high and low responses were quite significant, even though all participants completed the same 20-week standardised exercise programme, similar in amount and intensity to the recommended national physical activity guidelines, with high (≥95%) adherence levels. Our results also highlight the marked heterogeneity among exercise response traits within a given individual, a unique feature of adaptation to regular exercise. We found only a single individual among the 564 participants with ‘universally’ low responses and one individual who with ‘universally’ high responses as defined herein.
Clinical and public health implications
The assumption of ‘universal’ exercise benefits across tissues, organ systems and cardiometabolic traits does not appear to hold when physical activity guidelines are considered at the level of an individual. Our results are in agreement with previous investigations of interindividual differences in exercise response. Scharhag-Rosenberger et al9 found that non-response to training occurs frequently, even in endurance capacity related traits. Similarly, heterogeneity in adipose tissue response to exercise has previously been reported, with ~10% of individuals unlikely to respond to exercise even across multiple doses of exercise.10 Thus, the failure to recognise interindividual differences in responsiveness may have undesirable consequences. Another common assumption is that an exercise programme must improve fitness level or induce weight and adiposity losses in order to provide health benefits alone. However, our data clearly show that ΔVO2max does not correlate with regular exercise-induced changes in other cardiometabolic risk factors. Our findings are similar to those found in two recent papers including subjects at increased cardiovascular risk34 or type 2 diabetes,35 where improvements in clinical outcomes were observed with and without improvements of cardiorespiratory fitness. Similarly, even though the current exercise programme induced a mean reduction in VAT area and Δ%fat, these responses showed either a weak correlation (with Δinsulin) or no correlations with other cardiometabolic exercise responses. Thus, regular exercise provides health benefits whether body composition and/or cardiorespiratory fitness levels improve or not.
Future directions
The ultimate goal of precision and personalised medicine is to propose preventive measures and design treatments for individuals based on their unique biological profile and life circumstances. A common assumption is that a patient’s genome, together with other molecular signatures could inform the process of personalised medicine, including personalised exercise medicine. While research on exercise genomics is in progress in several laboratories and studies, including the Molecular Transducers of Physical Activity Consortium,36 there are many questions that need to be addressed before the causes of the individuality of adaptation to exercise are fully understood. For example, whether the response pattern to an exercise regimen is repeatable at an individual level following subsequent exposures has not been adequately addressed.37–39 Likewise, studies are needed to determine if individuals with low responses to endurance exercise are truly low responders or if they would respond differently to exercise programmes using different modes, intensities, durations and frequencies than those currently recommended by the Physical Activity Guidelines.40,41
Strengths and limitations
Our study is strengthened by its large sample size of black and white men and women representing a wide age range (17–65 years). Furthermore, adherence was 95% or higher in these individuals and phenotype measures were very reliable. Although our classification of low and high responses may be viewed as a limitation (see below), its simplicity may also be a strength in that it is easily applicable to other studies, populations and/or reference data. Furthermore, this approach has public health utility, as many studies show that moving from the highest population-based risk group (eg, lowest quintile for cardiorespiratory fitness, 0–20th percentile) to the next group (eg, second quintile, 21st–40th percentile) is often associated with the greatest reduction in disease or mortality risk.42,43
Although we present compelling data from one of the largest and most diverse exercise training studies, our study is not without limitations. The HERITAGE cohort consists of generally healthy individuals, potentially limiting the generalisability of our findings. While we believe the observed heterogeneity of responsiveness would be present regardless of the population studied, future investigations are needed to confirm our findings in diseased and other populations. We are unable to determine differences in exercise responsiveness or label participants as high/low responders due to the lack of a control group (ie, cannot definitively attribute trait responsiveness to exercise) in HERITAGE and the inability to eliminate sources of random error. Rather our results characterise patterns of response to a single type of endurance exercise. Given the family design of HERITAGE, relatedness is a potential confounding factor in the examination of exercise responsiveness. Since we defined response status within generation-specific, ethnicity-specific and sex-specific quintiles, the only subgroup that could contain more than one individual from the same family would be same-sex siblings, as the other groupings would split up family members and likely lessen the impact any one family (or families) had on the threshold values. Furthermore, we conducted analyses including family membership as a covariate (data not shown), however, there was no impact of relatedness on the results. Another potential limitation is that we selected only traits that significantly changed with the exercise programme in the overall cohort. Thus, additional clinically relevant traits were not included. Lastly, we recognise that our quintile-based classification of exercise response will by default result in 20% low and 20% high responses. However, based on numerous reports demonstrating heterogeneity of exercise responsiveness,2,3,5–7,9,10,44–47 we are confident that regardless of the method used for classifying training responsiveness or the traits included, our overall interpretation of the results would not differ. This belief is supported by the similar results when a more conservative (CI-SWC) classification scheme was applied.
CONCLUSIONS
In summary, we believe that we are now at a stage when the exercise medicine community needs to pay more attention to individual differences in responsiveness when implementing the physical activity guidelines, especially in clinical settings. A productive first step would be to acknowledge that regular exercise does not cause the same profile of physiological effects in every individual. Also, it is important to recognise that unlike many pharmaceuticals, exercise brings about multiple beneficial changes to the cardiometabolic risk profile, even when the primary target risk factor does not improve. Recognising these two unique features of repeated exercise exposures will help public health authorities, clinicians and the public at large to better understand the complexity of exercise-induced health benefits.
Supplementary Material
What are the findings?
Interindividual variation in exercise response is present across multiple cardiometabolic traits, and the pattern of trait responsiveness to regular exercise is not consistent within individuals.
How might it impact on clinical practice in the future?
Regular exercise is likely to confer health benefits to most individuals, however, it is important for public health officials and clinicians to consider that the benefits obtained will not be the same in every individual.
Future investigations are needed to determine how factors such as nutrition, other behaviours, exercise type, genetics and epigenetics impact the response profile to regular exercise.
Acknowledgements
We would like to recognise the contribution of the late Dr Jack H. Wilmore (1938 – 2014) to the HERITAGE Family Study. Gratitude is also expressed to all collaborators at the five HERITAGE sites and to the families who graciously volunteered for the study. We would like to thank Dr Tuomo Rankinen, who served as the Project Director of HERITAGE from 1999 to 2017, for his help with the original concept and design of the present paper.
Funding The HERITAGE Family Study was supported by grants from the NIH/NHLBI: HL-45670, HL-47323, HL-47317, HL-47327, HL-47321. MS is supported by NIH/NHLBI R01HL146462.
Footnotes
Competing interests None declared.
Patient consent for publication Not required.
Ethics approval The study protocol was approved by the institutional review boards of each at each of the five participating centres of the HERITAGE Family Study consortium (Indiana University, Laval University in Quebec City, University of Minnesota, University of Texas at Austin, and Washington University at St. Louis).
Data availability statement Data are available on reasonable request of the corresponding author.
Supplemental material This content has been supplied by the author(s). It has not been vetted by BMJ Publishing Group Limited (BMJ) and may not have been peer-reviewed. Any opinions or recommendations discussed are solely those of the author(s) and are not endorsed by BMJ. BMJ disclaims all liability and responsibility arising from any reliance placed on the content. Where the content includes any translated material, BMJ does not warrant the accuracy and reliability of the translations (including but not limited to local regulations, clinical guidelines, terminology, drug names and drug dosages), and is not responsible for any error and/or omissions arising from translation and adaptation or otherwise.
Additional material is published online only. To view,please visit the journal online (http://dx.doi.org/10.1136/bjsports-2020-103323).
REFERENCES
- 1.Physical Activity Guidelines Advisory Committee. Physical activity guidelines Advisory Committee scientific report, 2018. [Google Scholar]
- 2.Bouchard C, Blair SN, Church TS, et al. Adverse metabolic response to regular exercise: is it a rare or common occurrence? PLoS One 2012;7:e37887. [DOI] [PMC free article] [PubMed] [Google Scholar]
- 3.Bouchard C, Rankinen T. Individual differences in response to regular physical activity. Med Sci Sports Exerc 2001;33:S446–51. [DOI] [PubMed] [Google Scholar]
- 4.Church TS, Earnest CP, Thompson AM, et al. Exercise without weight loss does not reduce C-reactive protein: the INFLAME study. Med Sci Sports Exerc 2010;42:708–16. [DOI] [PMC free article] [PubMed] [Google Scholar]
- 5.Hautala AJ, Kiviniemi AM, Mäkikallio TH, et al. Individual differences in the responses to endurance and resistance training. Eur J Appl Physiol 2006;96:535–42. [DOI] [PubMed] [Google Scholar]
- 6.Ross R, Goodpaster BH, Koch LG, et al. Precision exercise medicine: understanding exercise response variability. Br J Sports Med 2019;53:1141–53. [DOI] [PMC free article] [PubMed] [Google Scholar]
- 7.de Lannoy L, Clarke J, Stotz PJ, et al. Effects of intensity and amount of exercise on measures of insulin and glucose: analysis of inter-individual variability. PLoS One 2017;12:e0177095. [DOI] [PMC free article] [PubMed] [Google Scholar]
- 8.Leifer ES, Brawner CA, Fleg JL, et al. Are there negative responders to exercise training among heart failure patients? Med Sci Sports Exerc 2014;46:219–24. [DOI] [PMC free article] [PubMed] [Google Scholar]
- 9.Scharhag-Rosenberger F, Walitzek S, Kindermann W, et al. Differences in adaptations to 1 year of aerobic endurance training: individual patterns of nonresponse. Scand J Med Sci Sports 2012;22:113–8. [DOI] [PubMed] [Google Scholar]
- 10.Brennan AM, Day AG, Cowan TE, et al. Individual response to standardized exercise: total and abdominal adipose tissue. Med Sci Sports Exerc 2019. doi: 10.1249/MSS.0000000000001930. [Epub ahead of print: 15 Feb 2019]. [DOI] [PubMed] [Google Scholar]
- 11.Bouchard C, Leon AS, Rao DC, et al. The heritage family study. aims, design, and measurement protocol. Med Sci Sports Exerc 1995;27:721–9. [PubMed] [Google Scholar]
- 12.Skinner JS, Wilmore KM, Krasnoff JB, et al. Adaptation to a standardized training program and changes in fitness in a large, heterogeneous population: the heritage family study. Med Sci Sports Exerc 2000;32:157–61. [DOI] [PubMed] [Google Scholar]
- 13.Wilmore JH, Stanforth PR, Gagnon J, et al. Heart rate and blood pressure changes with endurance training: the heritage family study. Med Sci Sports Exerc 2001;33:107–16. [DOI] [PubMed] [Google Scholar]
- 14.Leon AS, Rice T, Mandel S, et al. Blood lipid response to 20 weeks of supervised exercise in a large biracial population: the heritage family study. Metabolism 2000;49:513–20. [DOI] [PubMed] [Google Scholar]
- 15.Boulé NG, Weisnagel SJ, Lakka TA, et al. Effects of exercise training on glucose homeostasis: the heritage family study. Diabetes Care 2005;28:108–14. [DOI] [PubMed] [Google Scholar]
- 16.Wilmore JH, Després JP, Stanforth PR, et al. Alterations in body weight and composition consequent to 20 wk of endurance training: the heritage family study. Am J Clin Nutr 1999;70:346–52. [DOI] [PubMed] [Google Scholar]
- 17.Sarzynski MA, Burton J, Rankinen T, et al. The effects of exercise on the lipoprotein subclass profile: a meta-analysis of 10 interventions. Atherosclerosis 2015;243:364–72. [DOI] [PMC free article] [PubMed] [Google Scholar]
- 18.Barber JL, Kraus WE, Church TS, et al. Effects of regular endurance exercise on GlycA: combined analysis of 14 exercise interventions. Atherosclerosis 2018;277:1–6. [DOI] [PMC free article] [PubMed] [Google Scholar]
- 19.Burstein M, Samaille J. [On a rapid determination of the cholesterol bound to the serum alpha- and beta-lipoproteins]. Clin Chim Acta 1960;5:609. [DOI] [PubMed] [Google Scholar]
- 20.Després JP, Gagnon J, Bergeron J, et al. Plasma post-heparin lipase activities in the heritage family study: the reproducibility, gender differences, and associations with lipoprotein levels. health, risk factors, exercise training and genetics. Clin Biochem 1999;32:157–65. [DOI] [PubMed] [Google Scholar]
- 21.Gagnon J, Province MA, Bouchard C, et al. The heritage family study: quality assurance and quality control. Ann Epidemiol 1996;6:520–9. [DOI] [PubMed] [Google Scholar]
- 22.Jeyarajah EJ, Cromwell WC, Otvos JD. Lipoprotein particle analysis by nuclear magnetic resonance spectroscopy. Clin Lab Med 2006;26:847–70. [DOI] [PubMed] [Google Scholar]
- 23.Otvos JD, Shalaurova I, Wolak-Dinsmore J, et al. GlycA: a composite nuclear magnetic resonance biomarker of systemic inflammation. Clin Chem 2015;61:714–23. [DOI] [PubMed] [Google Scholar]
- 24.Desbuquois B, Aurbach GD. Use of polyethylene glycol to separate free and antibody-bound peptide hormones in radioimmunoassays. J Clin Endocrinol Metab 1971;33:732–8. [DOI] [PubMed] [Google Scholar]
- 25.Siri WE. Body composition from fluid spaces and density: analysis of methods. In: Brozek J, Henschel A, eds. Techniques for measuring body composition. Washington, DC: National Academy of Sciences, National Research Council, 1961: 223–44. [Google Scholar]
- 26.Lohman TG. Applicability of body composition techniques and constants for children and youths. Exerc Sport Sci Rev 1986;14:325–57. [PubMed] [Google Scholar]
- 27.Schutte JE, Townsend EJ, Hugg J, et al. Density of lean body mass is greater in blacks than in whites. J Appl Physiol Respir Environ Exerc Physiol 1984;56:1647–9. [DOI] [PubMed] [Google Scholar]
- 28.Ortiz O, Russell M, Daley TL, et al. Differences in skeletal muscle and bone mineral mass between black and white females and their relevance to estimates of body composition. Am J Clin Nutr 1992;55:8–13. [DOI] [PubMed] [Google Scholar]
- 29.Skinner JS, Wilmore KM, Jaskolska A, et al. Reproducibility of maximal exercise test data in the heritage family study. Med Sci Sports Exerc 1999;31:1623–8. [DOI] [PubMed] [Google Scholar]
- 30.Shephard RJ, Rankinen T, Bouchard C. Test-retest errors and the apparent heterogeneity of training response. Eur J Appl Physiol 2004;91:199–203. [DOI] [PubMed] [Google Scholar]
- 31.Wilmore JH, Stanforth PR, Domenick MA, et al. Reproducibility of anthropometric and body composition measurements: the heritage family study. Int J Obes Relat Metab Disord 1997;21:297–303. [DOI] [PubMed] [Google Scholar]
- 32.Swinton PA, Hemingway BS, Saunders B, et al. A statistical framework to interpret individual response to intervention: paving the way for personalized nutrition and exercise prescription. Front Nutr 2018;5:41. [DOI] [PMC free article] [PubMed] [Google Scholar]
- 33.Physical Activity Guidelines Advisory Committee. Physical activity guidelines advisory committee report, 2008. [Google Scholar]
- 34.Hartman YAW, Hopman MTE, Schreuder TH, et al. Improvements in fitness are not obligatory for exercise training-induced improvements in cv risk factors. Physiol Rep 2018;6:e13595. [DOI] [PMC free article] [PubMed] [Google Scholar]
- 35.Hetherington-Rauth M, Magalhães JP, Júdice PB, et al. Vascular improvements in individuals with type 2 diabetes following a 1 year randomised controlled exercise intervention, irrespective of changes in cardiorespiratory fitness. Diabetologia 2020;63:722–32. [DOI] [PubMed] [Google Scholar]
- 36.Sanford JA, Nogiec CD, Lindholm ME, et al. Molecular transducers of physical activity Consortium (MoTrPAC): mapping the dynamic responses to exercise. Cell 2020;181:1464–74. [DOI] [PMC free article] [PubMed] [Google Scholar]
- 37.Del Giudice M, Bonafiglia JT, Islam H, et al. Investigating the reproducibility of maximal oxygen uptake responses to high-intensity interval training. J Sci Med Sport 2020;23:94–9. [DOI] [PubMed] [Google Scholar]
- 38.Simoneau JA, Lortie G, Boulay MR, et al. Effects of two high-intensity intermittent training programs interspaced by detraining on human skeletal muscle and performance. Eur J Appl Physiol Occup Physiol 1987;56:516–21. [DOI] [PubMed] [Google Scholar]
- 39.Lindholm ME, Giacomello S, Werne Solnestam B, et al. The impact of endurance training on human skeletal muscle memory, global isoform expression and novel transcripts. PLoS Genet 2016;12:e1006294. [DOI] [PMC free article] [PubMed] [Google Scholar]
- 40.Dalleck LC, Haney DE, Buchanan CA. Does a personlised exercise prescription enhance training efficacy and limit training responsiveness? a randomised controlled trial. J Fit Res 2016;5:15–27. [Google Scholar]
- 41.Montero D, Lundby C. Refuting the myth of non-response to exercise training: ‘non-responders’ do respond to higher dose of training. J Physiol 2017;595:3377–87. [DOI] [PMC free article] [PubMed] [Google Scholar]
- 42.Blair SN, Kohl HW, Barlow CE, et al. Changes in physical fitness and all-cause mortality. A prospective study of healthy and unhealthy men. JAMA 1995;273:1093–8. [PubMed] [Google Scholar]
- 43.Wannamethee SG, Shaper AG, Lennon L, et al. Metabolic syndrome vs Framingham risk score for prediction of coronary heart disease, stroke, and type 2 diabetes mellitus. Arch Intern Med 2005;165:2644–50. [DOI] [PubMed] [Google Scholar]
- 44.Böhm A, Weigert C, Staiger H, et al. Exercise and diabetes: relevance and causes for response variability. Endocrine 2016;51:390–401. [DOI] [PMC free article] [PubMed] [Google Scholar]
- 45.Bonafiglia JT, Rotundo MP, Whittall JP, et al. Inter-individual variability in the adaptive responses to endurance and sprint interval training: a randomized crossover study. PLoS One 2016;11:e0167790. [DOI] [PMC free article] [PubMed] [Google Scholar]
- 46.Bakker EA, Snoek JA, Meindersma EP, et al. Absence of fitness improvement is associated with outcomes in heart failure patients. Med Sci Sports Exerc 2018;50:196–203. [DOI] [PubMed] [Google Scholar]
- 47.Leifer ES, Mikus CR, Karavirta L, et al. Adverse cardiovascular response to aerobic exercise training: is this a concern? Med Sci Sports Exerc 2016;48:20–5. [DOI] [PMC free article] [PubMed] [Google Scholar]
Associated Data
This section collects any data citations, data availability statements, or supplementary materials included in this article.