

Abstract
Background:
Monogenic autoinflammatory diseases (AID) are caused by mutations in innate immune genes. The effects of these mutations on allergic inflammation are unknown.
Objectives:
We investigated allergic, immunologic, and clinical phenotypes in FMF (Familial Mediterranean Fever), CAPS (Cryopyrin-Associated Periodic Syndrome), TRAPS (TNF Receptor Associated Periodic Syndrome), HIDS (Hyper-IgD Syndrome), PAPA (Pyogenic Arthritis, Pyoderma gangrenosum, and Acne), DADA2 (Deficiency of Adenosine DeAminase 2), HA20 (Haploinsufficiency of A20), CANDLE (Chronic Atypical Neutrophilic Dermatosis, Lipodystrophy, Elevated temperature), and SAVI (STING-Associated Vasculopathy of Infancy).
Methods:
In this cross-sectional study, clinical data were assessed in 425 AID patients using questionnaires and chart reviews. Comparator data were obtained from public databases. Peripheral blood mononuclear cells obtained from 55 patients were stimulated and CD4+ cytokine production assessed.
Results:
Clinical laboratory features of Type 2 immunity were elevated in CAPS but reduced in most AID, particularly DADA2. Physician-diagnosed allergic diseases were prevalent in multiple AID, including CAPS and DADA2. T helper 2 (Th2) cells were expanded in CAPS, TRAPS, and HIDS; Th9 cells were expanded in HA20.
Conclusions:
CAPS is characterized by an enhanced Type 2 signature, whereas FMF and CANDLE are associated with reduced Type 2 responses. DADA2 is associated with reduced Type 2 responses but a high rate of physician-diagnosed allergy. Therefore, NLRP3-driven autoinflammation may promote Type 2 immunity, whereas AID like DADA2 may manifest clinical phenotypes that masquerade as allergic disorders. Further investigations are needed to determine the contribution of autoinflammation to allergic clinical and immunological phenotypes, to improve the treatment of AID patients.
Keywords: Allergy, autoinflammation, autoinflammatory disease
Introduction
Autoinflammation is mediated by activated innate cells like monocytes and neutrophils, whereas allergic inflammation is typified by a Type 2 immune response, comprising signature cytokines like IL-4, IL-5, IL-9, and IL-135. Autoinflammation is thought to repress Type 2 immunity6 7. Accordingly, the autoinflammatory disease (AID) Familial Mediterranean Fever (FMF) is associated with a reduced prevalence of clinical allergy – or inappropriate Type 2 response to allergens8–10. However, certain autoinflammatory cytokines can also promote Type 2 immunity in some contexts10–12. This raises the question of whether autoinflammation generally suppresses Type 2 immunity, or whether different autoinflammatory pathways have disparate effects on Type 2 pathogenesis. One way to investigate this question is to determine the degree to which allergic immunophenotypes are represented in monogenic AID13. Because monogenic AID are extremely rare, systematic investigations are challenging in these populations. However, the NIH AID cohort contains 425 patients with 9 monogenic AID, providing a unique resource to study this question. We hypothesized that autoinflammation would generally lower the risk of allergy, and that monogenic AID patients would have a reduced Type 2 immunological phenotype compared with the general population. We tested this hypothesis by systematically investigating the NIH AID cohort for clinical laboratory evidence of Type 2 responses, allergy-associated physician-diagnoses and ex-vivo Type 2 immunophenotypes.
Methods
Retrospective analysis of patient charts
All monogenic AID cohorts containing ≥10 patients were included in the analysis. Patients with monogenic AID diagnosed between 1976–2020 were identified based on disease-causing variants in MEFV (Familial Mediterranean Fever, FMF), NLRP3 (Cryopyrin-Associated Periodic Fever Syndrome, CAPS), TNFRSF1A (TNF Receptor Associated Periodic Syndrome, TRAPS), ADA2 (Deficiency of Adenosine DeAminase 2, DADA2), MVK (Hyper-IgD Syndrome, HIDS), PSTPIP1 (Pyogenic Arthritis, Pyoderma gangrenosum, and Acne, PAPA), TNFAIP3 (Haploinsufficiency of A20, HA20), proteasome genes (Chronic Atypical Neutrophilic Dermatosis, Lipodystrophy, and Elevated temperature, CANDLE), and STING1 (STING-Associated Vasculopathy of Infancy, SAVI). Using the NIH Biomedical Translational Research Information System (BTRIS), clinical documentation from 1990–2020 was queried for: “allergic rhinitis”, “hay fever”, “seasonal allergy”, “asthma”, “reactive airway disease”, “eczema”, “atopic dermatitis”, “food allergy”, “urticaria”, “hives”, “angioedema”, “eosinophilia”, “hypereosinophilia”, “eosinophilic esophagitis”, “eosinophilic gastrointestinal disease”, “eosinophilic gastroenteritis”, “eosinophilic colitis”, “EoE”, and “EGID”. Documentation identified through BTRIS was reviewed manually by 3 independent reviewers, clinical laboratory data were obtained from BTRIS, and all biopsies interpreted at the NIH were reviewed for eosinophilic gastrointestinal disease (EGID). Data collected during or after allogeneic hematopoietic stem cell transplantation (HSCT) or during autologous HSCT were excluded.
Survey development
Questionnaires were developed by a panel of allergists, rheumatologists, and survey researchers to assess (1) asthma, (2) allergic rhinitis, (AR) (3) eczema, (4) food allergy, (5) urticaria, and (6) angioedema. Questions regarding asthma, AR, and eczema were taken from National Healthcare Interview Survey (NHIS), National Health and Nutrition Examination Survey (NHANES), and International Study of Asthma and Allergies in Childhood (ISAAC)1 2 4. Questions regarding food allergy were taken from the Chicago Food Allergy Research Survey3. Questions regarding urticaria and angioedema were taken from protocol 09-I-0126, which studies physical urticaria. Urticaria questions were validated by investigators on our study development panel, and angioedema questions had been validated in a cohort of patients with C1 esterase inhibitor deficiency14 15.
Patient recruitment and sample collection
Informed consent was obtained via NIH protocol 94-HG-0104, 17-I-0016, or 10-I-0148. Patients visiting the NIH Clinical Center between Nov 2019-Jun 2020 completed the questionnaires in-person with study investigators, and blood was collected for immunophenotyping. Alternately, patients were contacted and completed the questionnaire via telephone, telemedicine, or electronic communication between Nov 2019-Dec 2020.
T helper Immunophenotyping
Peripheral blood mononuclear cells (PBMCs) were extracted from whole blood using density gradient centrifugation (Ficoll) and cryopreserved. After thawing, cells were rested overnight at 37°C in RPMI with 10% FBS and antibiotics, then stimulated with 20 ng/mL phorbol myristate acetate (PMA), 1 μM ionomycin, 200 units/mL human IL-2, and 60 μg/mL human IL-4 for 5 hours; 10 μg/mL brefeldin A was added after 90 minutes. Cells were stained for viability (Live-Dead BLUE, Invitrogen), fixed and permeabilized (BD Cytofix/Cytoperm), and stained with: CD3 APC-Cy7, CD4 BUV395, CD8 v500, CD45RO PE-Texas Red, IL-2 PerCpCy5.5, IL-4 BUV605, IL-13 BV711, IL-9 PE, IL-5 v450, IFN-γ AF700, TNF-α PE-Cy7, IL-17A FITC, IL-21 AF647, IL-10 e655. Data were collected on a LSRFortessa (BD) and analyzed using FlowJo (Treestar) and Prism (GraphPad).
Outcome measures
All self-reported or chart-based physician-diagnoses of AR, asthma, and eczema were included. A diagnosis of convincing food allergy required ≥1 “stringent” symptom (Chicago Food Allergy Research Study) as the most severe reaction. Biopsy-proven eosinophilic esophagitis (EoE) was defined as ≥15 eosinophils per HPF, and eosinophilic gastroenteritis (EGE) as ≥50 eosinophils per HPF. Comparator data were taken from NCHS (asthma, AR, eczema), Chicago Food Allergy Research Study (food allergy), and population-based databases (EGID)16–19. Episodes of urticaria and angioedema were self-reported. Patients were asked whether symptoms correlated with AID flare. For serum immunoglobulin E (IgE) and absolute eosinophil count (AEC) calculations, the mean value for each patient was used. CD4+ T subsets were compared between AID patients, healthy volunteers (HV), and atopic dermatitis patients (AD) based on effector cytokine production: Th1 (IFN-γ), Th2 (IL-4, IL-5, IL-13), Th9 (IL-9), Th17 (IL-17A).
Statistical analysis
Combined data from chart review and questionnaires in AID patients were compared to the US general population (NHIS). FMF was also compared to other AID because FMF is the prototypical AID and the only one in which allergy was previously studied. Benjamini-Hochberg adjusted Fisher’s t-test was used to compare diagnoses between AID and the general population and between FMF and other AID. Pearson’s test was used to correlate AEC with acute phase reactants (APR). AEC, IgE levels, and CD4+ immunophenotypes were compared using Benjamini-Hochberg adjusted Mann-Whitney test. Statistical analysis was performed in Prism (GraphPad) and R.
Results
Clinical characteristics of study participants
425 monogenic AID patients were enrolled in protocols 94-HG-0105 or 17-I-0016 and assessed at the NIH between 1976–2020 (Table 1). Most carried a diagnosis of FMF (n=118), CAPS (n=85), TRAPS (n=73), DADA2 (n=53), or HIDS (n=38). Smaller cohorts with PAPA (n=18), HA20 (n=14), CANDLE (n=14), and SAVI (n=12) were also followed. All patients carried a molecular diagnosis of MEFV, NLRP3, TNFRSF1A, ADA2, MVK, PSTPIP1, TNFAIP3, proteasome genes, or STING1 disease-causing variants, confirmed by Sanger sequencing.
Table 1.
Demographics of the NIH AID Cohorts
| Total numbers identified and assessed | |||||||||
|---|---|---|---|---|---|---|---|---|---|
| FMF | CAPS | TRAPS | HIDS | PAPA | DADA2 | HA20 | CANDLE | SAVI | |
| Identified (total) | 117 | 85 | 72 | 39 | 18 | 53 | 14 | 14 | 12 |
| Assessed (total, chart review or questionnaire) | 98 | 85 | 70 | 36 | 18 | 53 | 14 | 14 | 12 |
| Underwent retrospective chart review | 93 | 85 | 69 | 36 | 18 | 50 | 14 | 14 | 12 |
| Completed questionnaire | 50 | 39 | 29 | 17 | 11 | 31 | 13 | 5 | 5 |
| Assessed (total, labs) | 113 | 83 | 72 | 39 | 18 | 53 | 14 | 14 | 12 |
| Demographics | |||||||||
| FMF | CAPS | TRAPS | HIDS | PAPA | DADA2 | HA20 | CANDLE | SAVI | |
| Mean age at analysis (range) | 34.8 (2–82) |
26.1 (0–73) |
33.3 (1–40) |
14.1 (1–80) |
31.8 (7–62) |
18.6 (1–58) |
26.5 (4–62) |
14.5 (4–27) |
20.2 (7–55) |
| Mean age at diagnosis (range) | 18.7 (1–54) |
15.8 (0–69) |
23.8 (0–34) |
7.9 (0–66) |
20.5 (0–51) |
16 (0–56) |
23 (2–56) |
9.5 (2–19) |
16.7 (5–54) |
| Mean disease duration in years at analysis (range) | 27.6 (1–68) |
18.25 (0–70) |
26.5 (0–33) |
7.3 (0–63) |
17.5 (0–44) |
13.3 (1–37) |
18.4 (2–50) |
9.4 (2–19) |
24.5 (4–50) |
| Sex (% M) | 62.6% | 45.2% | 54.2% | 34.2% | 72.2% | 47.1% | 30.8% | 57.1% | 41.7% |
| Immunomodulation ever (%) | |||||||||
| FMF | CAPS | TRAPS | HIDS | PAPA | DADA2 | HA20 | CANDLE | SAVI | |
| Any | 96.3% | 100% | 87.1% | 88.9% | 94.4% | 92.2% | 100% | 100% | 91.7% |
| Colchicine | 87.6% | 14.5% | 19.4% | 38.9% | 16.6% | 0% | 28.6% | 35.7% | 0% |
| Steroids | 11.1% | 61.5% | 62.9% | 75% | 83,3% | 11.8% | 92.8% | 100% | 66.7% |
| IL-1 targeted therapy | 38.3% | 100% | 62.3% | 86.1% | 94.4% | 3.9% | 28.6% | 42.9% | 0% |
| TNF-targeted therapy | 11.1% | 6% | 66.1% | 38.9% | 55.6% | 92.2% | 50% | 42.9% | 0% |
| JAK inhibitor | 0% | 0% | 0% | 0% | 5.6% | 0% | 28.6% | 85.7% | 91.7% |
| Other biologics | 6.2% | 2.4% | 9.7% | 8.3% | 11.1% | 17.6% | 7.1% | 50% | 25% |
| Allergic disease-directed therapy* | 7.4% | 23.8% | 9.7% | 50% | 11.1% | 21.6% | 42.8% | 28.6% | 33.3% |
| Immunomodulation at time of analysis (%) | |||||||||
| FMF | CAPS | TRAPS | HIDS | PAPA | DADA2 | HA20 | CANDLE | SAVI | |
| Any | 87.7% | 98.8% | 77.4% | 88.9% | 94.4% | 92.2% | 57.14% | 100% | 75% |
| Colchicine | 82.7% | 2.4% | 1.6% | 0% | 0% | 0% | 23.1% | 0% | 0% |
| Steroids | 1.2% | 8.4% | 12.9% | 16.7% | 44.4% | 11.8% | 7.1% | 64.3% | 41.7% |
| IL-1 targeted therapy | 29.6% | 97.6% | 51.6% | 69.4% | 94.4% | 3.9% | 21.4% | 0% | 0% |
| TNF-targeted therapy | 3.7% | 2.4% | 22.6% | 13.9% | 44.4% | 92.2% | 21.4% | 0% | 0% |
| JAK inhibitor | 0% | 0% | 0% | 0% | 5.6% | 0% | 28.6% | 85.7% | 75% |
| Other biologics | 4.9% | 1.2% | 0% | 5.6% | 0% | 17.6% | 0% | 0% | 8.3% |
| Allergic disease-directed therapy* | 4.9% | 13.1% | 4.8% | 19.4% | 11.1% | 19.6% | 35.7% | 21.4% | 33.3% |
antihistamines, leukotriene inhibitors, nasal or pulmonary corticosteroids, short acting beta agonists, subcutaneous allergen immunotherapy, dupilumab
Clinical laboratory values obtained between 1989–2020 were located for 415 (97.6%) patients. Clinical documentation from 1990–2020 was located for 400 patients (94.1%); questionnaire data were obtained for 201 (50.3%) of these. Mean ages of the cohorts at time of assessment varied, with a higher mean age and disease duration in older cohorts (FMF, TRAPS). For all diseases, onset of symptoms was usually in early childhood. Most patients were receiving treatment with biological immunomodulators, reflecting severe disease; 4.9–35.7% were also receiving prescriptions for allergy-directed therapies, indicating that symptoms were severe enough to be treated in daily clinical practice (Table 1).
Mean total serum IgE levels are reduced in DADA2 and HIDS
IgE is a major mediator of Type 2 immunity, and total serum IgE levels strongly predict allergic disease20 21. 117 AID patients had a serum IgE measured at the NIH Clinical Center between 1989–2020; none of the AID cohorts had an increased prevalence of elevated peak IgE (>100 kU/L) relative to the general population (Figure 1A). Indeed, mean IgE was lower in DADA2 (43.42 kU/L) and HIDS (57.23 kU/L) than in the general population (172.3 kU/L) (Figure 1B, Table S1). Serum IgE increases during childhood, but our findings were not affected by adjusting for age (Figure 1C–D). Reduced total IgE levels in HIDS and DADA2 provide an objective measure of reduced Type 2 immunophenotypes in these patients, suggesting that inactivating MVK and ADA2 mutations repress Type 2 responses.
Figure 1. Serum IgE levels in the general US population and in nine monogenic autoinflammatory diseases (AID).

Data are shown for the general US population, FMF, CAPS, TRAPS, HIDS, PAPA, DADA2, HA20, CANDLE, and SAVI. A. Bar graph shows percentage of patients with a peak serum IgE>100 kU/L B. Violin plot shows serum IgE levels for each population. C-D. Scatterplots show serum IgE (kU/L) vs. age for HIDS (C) and DADA2 (D) cohorts. The geometric mean serum IgE for the general US population, with 95% confidence interval, is shown in black. *p<0.05 vs. general US population; Benjamini-Hochberg adjusted Mann-Whitney.
Peripheral eosinophilia is associated with CAPS
Although IgE is a critical mediator of immediate hypersensitivity reactions, eosinophils also play a major role in allergic responses either through primary eosinophil dysregulation or downstream of other effectors5. Mean AEC was calculated for 414 subjects and was reduced in FMF, PAPA, DADA2, CANDLE, and SAVI relative to the general population (Figure 2A). By contrast, CAPS was associated with elevated mean AEC, eosinophilia (AEC>500), and hypereosinophilia (AEC>1500) (Figure 2A–C). This is consistent with previous reports of eosinophilia in Neonatal-Onset Multisystem Inflammatory Disease (NOMID), the most severe form of CAPS22. Reduced AEC in five AID provides another objective measure of reduced Type 2 immunity, suggesting that autoinflammation generally suppresses Type 2 responses. However, elevated AEC in CAPS suggests that NLRP3-mediated autoinflammation promotes Type 2 immunity.
Figure 2. Eosinophilia and absolute eosinophil counts (AEC) in the general US population and in nine monogenic autoinflammatory diseases (AID).

Data are shown for the general US population, FMF, CAPS, TRAPS, HIDS, PAPA, DADA2, HA20, CANDLE, and SAVI. A. Violin plot shows mean AEC for each population. B-C. Bar graphs show percentage of patients with eosinophilia (peak AEC > 500, B) and hypereosinophilia (peak AEC > 1500, C). D. Volcano plot shows correlation (R, Pearson) vs. p-value (Pearson) of AEC vs. erythrocyte sedimentation rate (ESR, mm/h) for each AID patient with eosinophilia (AEC > 500). Colors of dots indicate specific AID (FMF, green; CAPS, dark blue; TRAPS, purple; HIDS, fuchsia; PAPA, teal; DADA2, orange; HA20, red; CANDLE, yellow). Size of dots distinguishes patients with eosinophilia (AEC > 500) from those with hypereosinophilia (AEC > 1500). E-F. Representative plots for one CAPS patient with hypereosinophilia: dot plot of AEC and ESR values over a period of 8 years (E) and correlation plot of AEC vs. ESR (F). *p<0.05, **p<0.01, ***p<0.005, ****p<0.001 vs. general US population. #p<0.05, ##p<0.01, ###p<0.005, ###p<0.001 vs. FMF; Benjamini-Hochberg adjusted Mann-Whitney (A) or Benjamini-Hochberg adjusted Fisher t-test (B-C).
Eosinophilia can result from primary immune cell dysregulation or from secondary factors like infection and medication toxicity23. One way of determining whether eosinophilia is linked to underlying immune-mediated disease is to assess whether AEC correlates with disease activity23. Because our analysis dated to 1990 and included many time points at which clinical disease activity indices were not yet in use, AID activity was quantified by following acute phase reactant (APR) levels24. We determined the relationship between AEC and APR for all AID patients with at least one instance of eosinophilia (n=76). AEC positively correlated with APR in 16 (21%) AID patients with eosinophilia, including 14 (33.3%) CAPS patients with eosinophilia, and 3 (75%) with hypereosinophilia (Figure 2D–F, Figure S1). AEC negatively correlated with APR in only 4 (9.5%) CAPS patients with eosinophilia and in 0 CAPS patients with hypereosinophilia (Figure 2D, Figure S1). These findings suggest that eosinophilia correlates with autoinflammation in CAPS — particularly in patients with hypereosinophilia — further suggesting that NLRP3-mediated autoinflammation promotes Type 2 responses.
Physician-diagnosed clinical allergy is common in multiple AID
Our analysis of clinical laboratory data suggested that autoinflammation generally represses Type 2 immunity, with the strongest negative signature in DADA2. The exception was CAPS, which was associated with increased clinical laboratory evidence of Type 2 responses linked to disease activity. These findings led us to ask whether these Type 2 immunological signatures correlated with physician-diagnosed disease rates in AID. We first investigated the prevalence of physician-diagnosed eczema because this diagnosis is made on the basis of clinical features25. Unexpectedly, physician-diagnosed eczema was highly prevalent in CAPS, CANDLE, DADA2, and HA20 – with the strongest associations in DADA2 and HA20 (Figure 3A, Table S1). A substantial number of diagnoses were confirmed by the NIH dermatology service in CAPS (35%) and DADA2 (45.8%), providing a gold-standard measure; other patients were diagnosed by NIH rheumatologists and community physicians. Symptoms were mild in most cases but limited daily activities in 4.5% of AID patients who completed the questionnaire.
Figure 3. Common and Disease-specific prevalence of physician-diagnosed allergy-associated diseases in nine monogenic autoinflammatory diseases (AID).
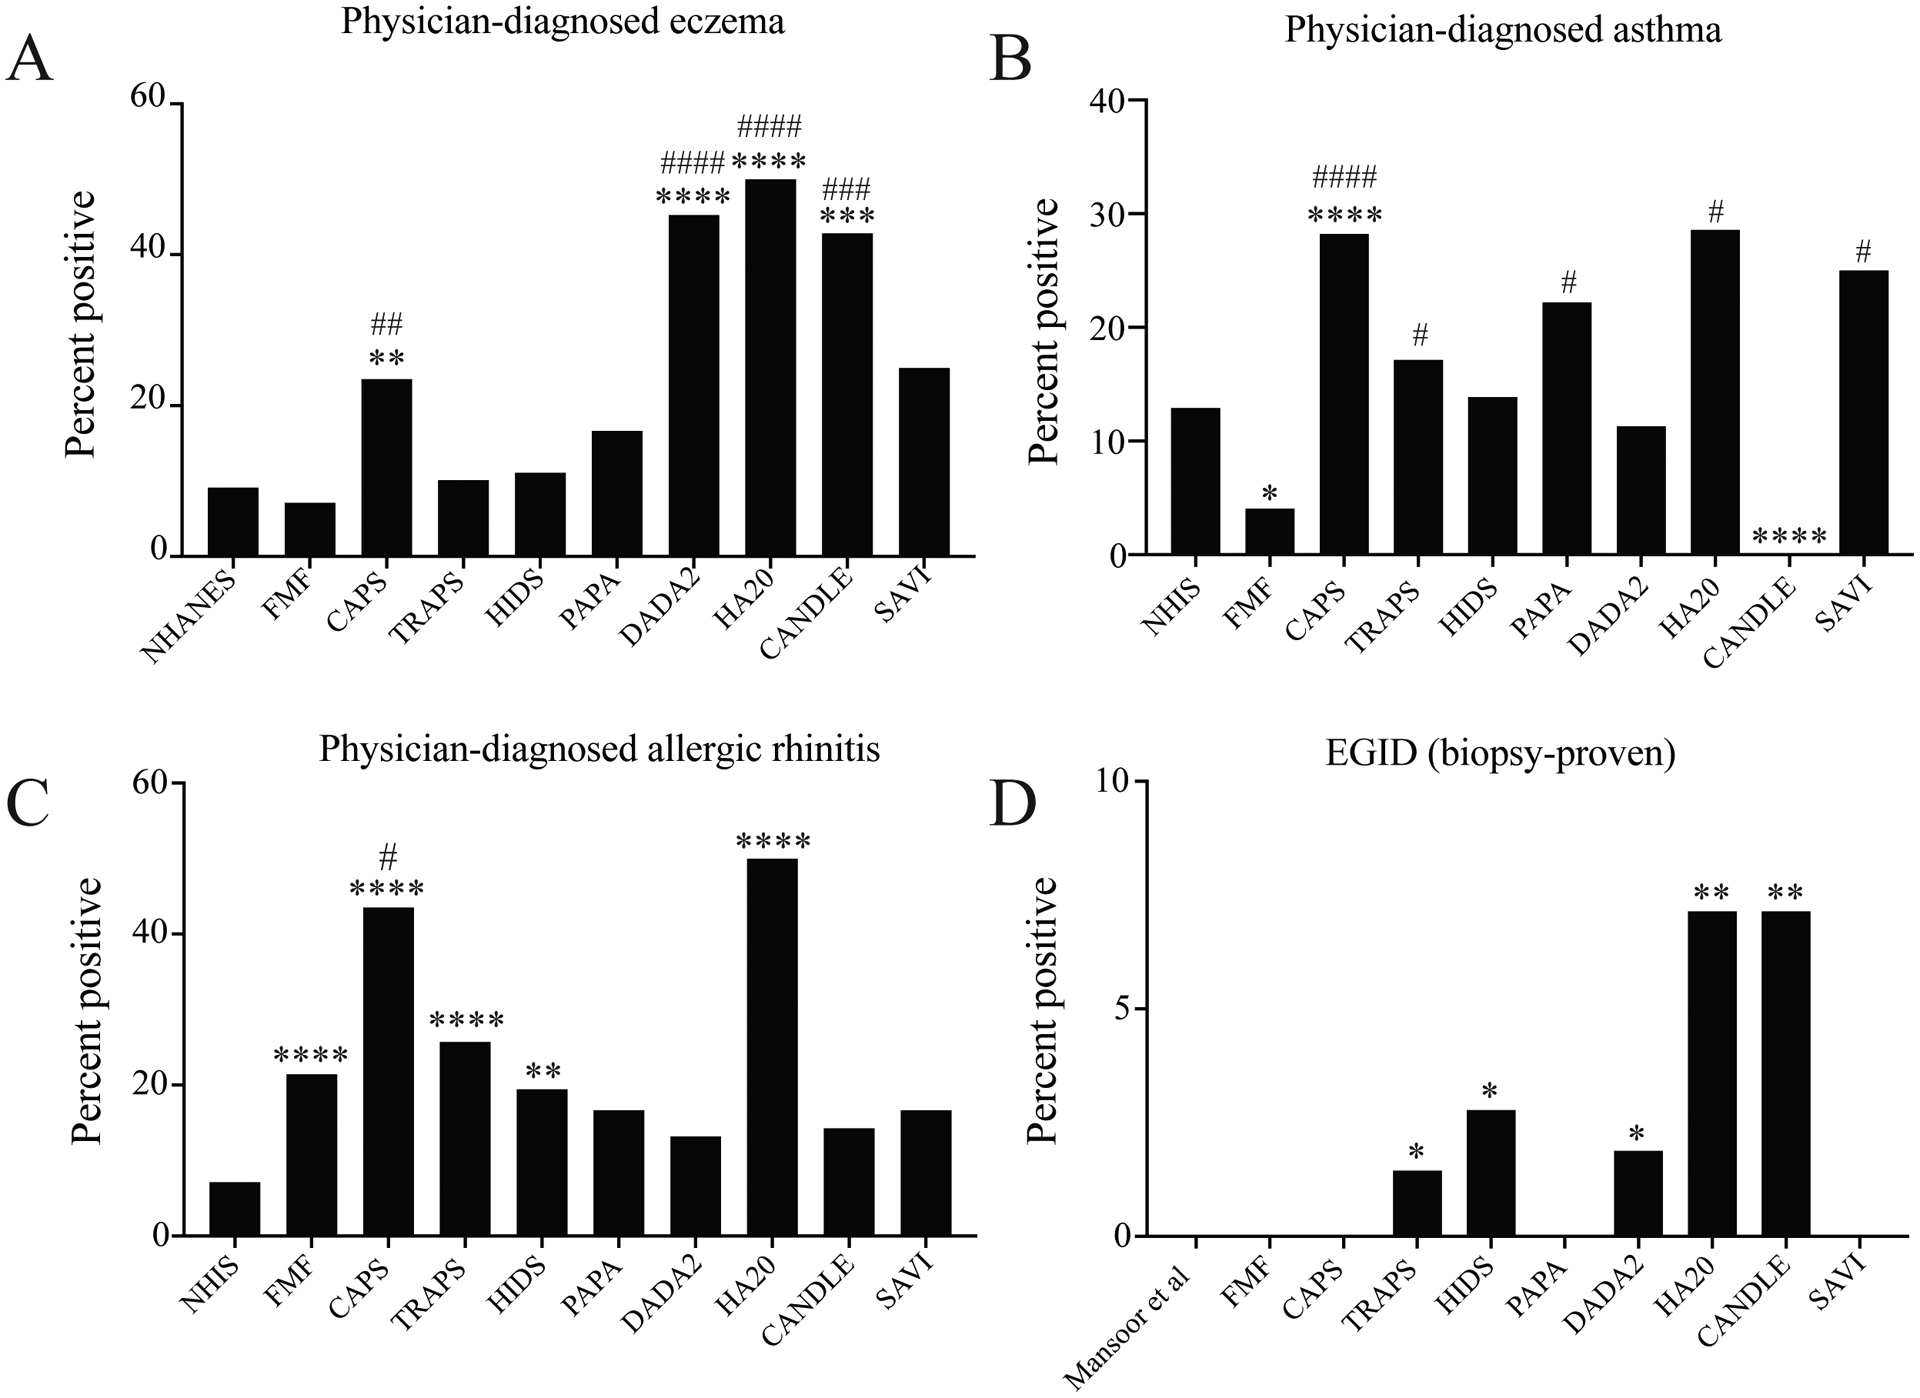
Data are shown for the general US population, FMF, CAPS, TRAPS, HIDS, PAPA, DADA2, HA20, CANDLE, and SAVI. Bar graphs show percentage of patients reporting physician-diagnosed eczema (A), asthma (B), or allergic rhinitis (C); or percentage of patients with a biopsy-proven diagnosis of eosinophilic gastrointestinal disease (EGID) (D) *p<0.05, **p<0.01, ***p<0.005, ****p<0.001 vs. general US population. #p<0.05, ##p<0.01, ###p<0.005, ###p<0.001 vs. FMF; Benjamini-Hochberg adjusted Fisher t-test.
Our observation that eczema was common in four AID led us to determine the prevalence of physician-diagnosed airway inflammation. Allergic airway inflammation can manifest as AR or asthma: patient-reported physician-diagnosed disease is a validated method of measuring AR and asthma prevalence with a high positive predictive value for objective methods like spirometry26. Asthma diagnoses were rare in FMF, consistent with prior reports10 27, and in CANDLE (Figure 3B, Table S1). Conversely, asthma was frequently diagnosed in patients with CAPS, HA20, and SAVI (Figure 3B). Furthermore, physician-diagnosed AR was 2- to 6-fold more common in AID than in the general population, with the highest prevalence in CAPS and HA20 (Figure 3C). Symptoms affected daily activities in 21.4% of AID patients who completed the questionnaire. Many patients were treated with allergy-directed therapies (AR, 35.9%; asthma, 46.6%), suggesting that symptoms were attributed to allergic inflammation.
In addition to skin and airway disease, Type 2 immunity can also cause food allergy. Because cross-sectional investigations do not permit systematic allergen sensitization testing, consensus criteria are often used to estimate food allergy prevalence in population-wide studies3. Based on these criteria, food allergy prevalence was not significantly different between AID and the general population (Table S1). To incorporate a more established measure of allergic gastrointestinal disease, we also investigated EGID, a tissue-specific Type 2 immune response often triggered by exposure to food allergens28. Biopsy-proven eosinophilic esophagitis (EoE) was diagnosed in 3 AID patients (DADA2, TRAPS, and CANDLE), whereas eosinophilic gastroenteritis (EGE) was diagnosed in 2 patients (HA20 and HIDS) (Figure 3D). Although only one patient was diagnosed in each cohort, EGID is so rare that these associations were significant individually and in aggregate. Moreover, eosinophilic GI infiltration not meeting criteria for EGID was noted in four patients (DADA2, n=2; TRAPS, n=1; CAPS, n=1). Larger, multicenter AID cohorts will be needed to determine the strength of this association between two extremely rare diseases.
Chronic idiopathic urticaria and angioedema are rare in AID
Chronic urticaria is challenging to diagnose in AID, because neutrophilic urticaria is a prominent feature of several AID and is only distinguished from true urticaria based on temporal association with flare and histopathological appearance29. Flare-related urticaria, or recurrent hives temporally linked to AID flare, was reported in CAPS (n=78, 91.8%), HIDS (n=8, 22.2%), and CANDLE (n=5, 35.7%) (Table 2). By contrast, chronic idiopathic urticaria unrelated to AID flare was rare (0–5.6%), consistent with the general prevalence of this disease30–32. Angioedema frequently accompanies true urticaria but not neutrophilic urticaria. Recurrent isolated angioedema was not reported by AID patients, but perioral swelling temporally associated with flare was reported by one family with TRAPS and one patient each with DADA2, HA20, and CANDLE. This was not accompanied by urticaria and may represent soft tissue swelling rather than angioedema29.
Table 2.
Prevalence of recurrent flare-related and chronic idiopathic urticaria
| Disease | Any urticaria Number (95% CI) |
Flare-related urticaria Number (95% CI) |
Chronic idiopathic urticaria Number (95% CI) |
|---|---|---|---|
| FMF (n=98) | 8.2% (4.2–15.3%) |
1% (0.01–5.6%) |
2% (0.04–7.1%) |
| CAPS (n=85) | 91.8% (84–96%) |
91.8% (84–96%) |
0 (0–4.3%) |
| TRAPS (n=69) | 8.7% (4–17.7%) |
4.3% (1.2–12%) |
1.4% (0.1–7.8%) |
| HIDS (n=36) | 27.8% (15.8–44%) |
22.2% (11.7–38.1%) |
2.8% (0.1–14.2%) |
| PAPA (n=18) | 16.7% (5.8–39.2%) |
5.6% (0.3–25.8%) |
5.6% (0.2–25.8%) |
| DADA2 (n=53) | 22.6% (13.5–35.5%) |
7.5% (3–17.9%) |
0 (0–6.8%) |
| HA20 (n=14) | 35.7% (16.3–61.2%) |
7.1% (0.01–31.5%) |
0 (0–21.5%) |
| CANDLE (n=14) | 35.7% (16.3–61.2%) |
35.7% (16.3–61.2%) |
0 (0–21.5%) |
| SAVI (n=12) | 8.3% (0.4–35.4%) |
8.3% (0.4–35.3%) |
0 (0–24.2%) |
| General population31–33 | 8.8–23% | NA | 0.5–6% |
Relationship of allergic diagnoses to autoinflammatory symptoms
Together, these cross-sectional analyses indicated that CAPS is associated with a Type 2 clinical and immunological signature, whereas other AID – particularly DADA2 – are associated with a reduced Type 2 immunological signature but high rates of physician-diagnosed allergy. Several primary immune diseases are associated with phenotypes that mimic allergy but are driven by non-Type 2 responses29 34, leading us to hypothesize that many allergic diagnoses might reflect uncontrolled autoinflammation. We tested this hypothesis by asking patients whether allergic symptoms worsened during AID flares. A minority of patients reported an association between AID flare and severity of eczema (12.2%), asthma (23.5%), or AR (14%) (Table S2). Patients with EoE reported no association with AID activity, whereas patients with EGE reported that symptoms worsened during AID flare. This suggests that uncontrolled autoinflammation does not underlie most physician-diagnosed allergy in AID. However, most EGE cases and some eczema, AR, and asthma diagnoses may indeed reflect uncontrolled autoinflammation. This finding highlights the utility of studying physician-diagnosed disease, which – although less discriminatory than allergen sensitization testing – is often used to guide treatment in AID patients (Table 1).
Type 2 immune signatures are unrelated to autoinflammation-directed treatments
Because we analyzed patients on multiple immunomodulatory treatments (Table 1), Type 2 immunological signatures might alternately reflect a drug reaction. We therefore reanalyzed pre-treatment and post-treatment clinical laboratory data in untreated patients (Table S3). IgE and AEC values were not significantly different in untreated vs. treated samples, suggesting that medication effects do not underlie Type 2 immune signatures in these AID. There was a trend towards reduced post-treatment AEC in CAPS, consistent with our observation that AEC correlated with disease activity. To determine whether physician-diagnosed allergy might be related to autoinflammation-directed therapy, we compared rates in patients treated with different immunomodulators (Table S4). We found no significant differences, indicating that allergic diagnoses were related to underlying AID rather than medication reactions.
Th2 or Th9 expansion is seen in multiple AID
Although IgE and eosinophils are important allergic immunomodulators, Type 2 cytokine-secreting T helper 2 (Th2) and Th9 cells are central to Type 2 responses, leading us to ask whether Th2/Th9 expansion might underlie physician-diagnosed allergy in some AID35 36. We therefore immunophenotyped CD4+ cells in ≥4 randomly selected AID patients from 7 cohorts. Most AID patients were treated with biological immunomodulators at the time of analysis, a potential confounder (Table S4). Consistent with prior reports, however, Th17 were expanded in several AID, confirming that these samples displayed AID-related T-cell dysregulation (Figure 4A–B)37 38. Th9 were significantly expanded in HA20; IL-13+ Th2 were not significantly expanded in any AID; IL-4+ Th2 were expanded in TRAPS; and IL-5+ Th2 were expanded in CAPS, TRAPS, and HIDS (Figure 4C–F, Table S5). Th2 expansion in CAPS is consistent with the observed clinical Type 2 signature, whereas Th9 expansion is consistent with the high prevalence of asthma and eczema seen in HA20. Th2/Th9 expansion was not, however, seen in DADA2 or other AID associated with eczema and AR. Together, these results suggest that Th2/Th9 expansion promotes physician-diagnosed allergy in AID like CAPS, but that non-Type-2 mechanisms likely underlie these phenotypes in AID like DADA2.
Figure 4. T helper immunophenotypes in seven monogenic autoinflammatory diseases (AID).

Data are shown for healthy volunteers (HV), atopic dermatitis patients (AD), FMF, CAPS, TRAPS, HIDS, PAPA, DADA2, and HA20. Violin plots show percentage of memory T helper cells (CD3+CD4+CD8−CD45RO+) producing IL-17A (A), IFN-γ (B) IL-9 (C), IL-13 (D), IL-4 (E), and IL-5 (F). *p<0.05, **p<0.01, ***p<0.005, ****p<0.001 vs. HC. #p<0.05, ##p<0.01, ###p<0.005, ###p<0.001 vs. FMF; Benjamini-Hochberg adjusted Mann-Whitney
Discussion
This is the first systematic cross-sectional study of Type 2 immunological and clinical phenotypes in multiple monogenic AID. Whereas we expected a consistent Type 2 immunophenotype across the different AID, we saw variable patterns in the nine syndromes. FMF and CANDLE were associated with reduced Type 2 responses, including AEC and physician-diagnosed asthma. However, CAPS was associated with a Type 2 signature of eosinophilia, physician-diagnosed allergy, and Th2 expansion. Because Type 2 inflammation can be triggered by stimuli other than allergens, the mechanisms underlying Type 2 responses in CAPS may be related to nonallergic factors including T cell- or eosinophil-intrinsic functions of NLRP3. Furthermore, the correlation of AEC with APR suggests that Type 2 immunomodulators could mediate NLRP3-related pathology. These hypotheses both warrant further investigation. Notably, FMF and CAPS had disparate associations despite the central role of IL-1β in both AID, suggesting that MEFV and NLRP3 modulate Type 2 responses by mechanisms other than systemic IL-1β induction. Potential mechanisms include protective linkage of MEFV with asthma-associated genes on chromosome 16 (i.e IL4RA, TPSAB1)10 27. NLRP3 is on the same chromosome as two asthma-associated genes, FLG and IL6RA, raising the possibility of pathogenic linkage39. NLRP3 may also promote Type 2 immunity through direct induction of IL4 transcription or IL-18-dependent augmentation of Th2 differentiation10 11 27 40 41. Future studies should clarify the mechanisms by which these genes modulate Type 2 responses.
Unexpectedly, several AID like DADA2 were associated with a reduced Type 2 immune signature but high rates of physician-diagnosed allergy, suggesting that autoinflammation can masquerade as allergic disease. For example, AID-associated sinus mucosal swelling could mimic AR in CAPS and CANDLE, whereas structural lung disease could mimic asthma in SAVI42–44. Many of these phenotypes, including eczematous dermatitis in DADA2, have not been previously described in AID and are empirically treated with allergy-directed therapies. Of note, 7.5% of AID patients started and later discontinued allergy-directed therapies, suggesting that these may not be efficacious for allergic phenotypes in some AID patients. The observation that autoinflammation can promote allergy-associated phenotypes therefore expands the spectrum of AID and identifies a potential need to alter treatment strategies. Because many AID patients reported symptoms severe enough to limit daily activities, addressing these phenotypes will alleviate a substantial clinical burden. It will be critical to further characterize the mechanisms underlying these phenotypes, to avoid unnecessary treatment with allergy-directed therapies for AID patients.
Several limitations arose due to the study design and populations. Because of the rarity and periodicity of monogenic AID, patients were not age/gender matched and were often clinically inactive when analyzed. Because the study protocols did not enroll healthy subjects, comparator data were obtained from public databases. These subjects were evaluated in other settings and may have undergone less in-depth evaluation for allergic phenotypes. We addressed these potential sources of selection bias by utilizing criteria from these public comparator studies and by including FMF as an additional comparator. We also attempted to address this confounder by assessing for family history of allergy, which was reported in 62% of AID patients. However, the significance of this finding was unclear because most of these family members also had at least one AID-related pathogenic mutation, and because comparator data were not available from the general population studies. Because the NIH is a quaternary referral center, most AID patients were taking immunomodulators at the time of analysis. To address this potential confounder, we performed additional analyses (Table S3–4) and rested PBMCs overnight to reduce in vitro medication effects. Finally, the retrospective design did not permit allergen sensitization testing, allergen-specific IgE, or spirometry. However, patient-reported physician-diagnosis has a high positive predictive value for gold-standard tests and is often used to guide treatment26 45 46. Moreover, using physician-diagnosed disease allowed us to identify autoinflammation as a potential driver of allergy-associated phenotypes, an important finding with clinical implications.
In summary, this study expands the spectrum of AID, with scientific and clinical implications that substantially advance the field. It is the first investigation of allergy-associated phenotypes across multiple AID, representing >20 years of comprehensive investigations at a dedicated AID center. This allowed extensive phenotyping that revealed previously unrecognized correlations. The Type 2 immune signature of CAPS suggests that some patients may benefit from combination therapy targeting autoinflammation and Type 2 inflammation. Conversely, the disparate associations with Type 2 responses and physician-diagnosed allergy in AID like DADA2 suggests that autoinflammation can mimic allergic inflammation. Therefore, physicians should be cautious in attributing allergic symptoms in AID to Type 2 activation, as these symptoms could result from untreated autoinflammation. Further investigation is needed to determine whether these results are generalizable to patients with other polygenic or monogenic AID, or to a subset of non-AID patients with eczema, asthma, or rhinitis. Exploring these mechanisms will further illuminate the multifaceted roles of autoinflammation in immune-mediated pathologies.
Supplementary Material
Key Messages/Bullet points:
What is already known about this subject?
Monogenic autoinflammatory diseases (AID) cause systemic inflammation with heterogeneous clinical and immunological phenotypes
What does this study add?
Familial Mediterranean Fever (FMF) and Chronic Atypical Neutrophilic Dermatosis, Lipodystrophy, and Elevated temperature (CANDLE) are associated with reduced Type 2 responses and a low prevalence of clinical allergy
Cryopyrin Associated Periodic Syndrome (CAPS) is associated with eosinophilia, clinical allergy, and Th2 expansion.
Several AID, including Deficiency of Adenosine DeAminase 2 (DADA2), are associated with reduced Type 2 responses but a high prevalence of physician-diagnosed allergy, suggesting that autoinflammation can masquerade as allergic disease
How might this impact on clinical practice or future developments?
Physicians should consider Type 2 immunity as a factor in CAPS but should be cautious in attributing allergic symptoms in other AID to Type 2 immune activation, as these features could be due to untreated autoinflammation. Understanding how innate genes modulate allergic phenotypes will provide new insights into the role of innate immunity in allergy-associated diseases, and may identify novel targets in patients refractory to treatments targeting Type 2 immunomodulators.
Acknowledgements:
The authors would like to thank Ms. Marcia Grady and Mr. Ryan Laird for their help navigating the relevant patient databases. The authors would like to thank Laura Lewandowski for her constructive suggestions and useful critiques of the manuscript.
Funding:
This study was funded through the National Institutes of Health (NIAID, NHGRI).
Patient and Public Involvement Statement:
Because the IRB-approved protocols used to recruit patient to the study rely on self-referral of patients with rare conditions, patients were heavily involved in recruitment to the study. Additionally, the questionnaires used for patient assessments (ISAAC, Chicago Food Allergy Survey, NCHS questionnaires) relied heavily on input from patients and public laypersons, as documented in the original studies1–4. After the study has been published and after the journal embargo period, results will be made available to patients and the general public via PubMed Central. We thank the patients for their efforts and contributions.
Abbreviations:
- AID
autoinflammatory disease
- FMF
Familial Mediterranean Fever
- CAPS
Cryopyrin-Associated Periodic Syndrome
- TRAPS
TNF-Receptor Associated Periodic Fever Syndrome
- HIDS
Hyper-IgD Syndrome
- PAPA
Pyogenic Arthritis, Pyoderma gangrenosum, and Acne
- CANDLE
Chronic Atypical Neutrophilic Dermatosis, Lipodystrophy, and Elevated temperature
- SAVI
STING-Associated Vasculopathy of Infancy
- HA20
Haploinsufficiency of A20
- DADA2
Deficiency of ADA2
- EGID
Eosinophilic Gastrointestinal Disease
- IgE
Immunoglobulin E
- AEC
Absolute Eosinophil Count
- Th
T helper
- NCHS
National Center on Healthcare Statistics
- NHIS
National Health Interview Survey
- NHANES
National Health And Nutrition Examination Survey
Footnotes
Ethical Approval Information: Studies were performed on IRB-approved protocols 94-HG-0105, 17-I-0016, or 10-I-1048.
Competing interests: none
Data sharing statement: All data relevant to the study are included in the article and uploaded as supplementary information. Raw data are available upon reasonable request.
References
- 1.Investigators N. Demographics, Laboratory, and Questionnaire Data. National Health and Nutrition Examination Survey. National Center for Health Statistics, 2005–2006. [Google Scholar]
- 2.Investigators N. Tables of Summary Health Statistics for public use. National Health Interview Survey. National Center for Health Statistics, 2015–2018. [Google Scholar]
- 3.Gupta RS, Kim JS, Springston EE, et al. Development of the Chicago Food Allergy Research Surveys: assessing knowledge, attitudes, and beliefs of parents, physicians, and the general public. BMC Health Serv Res 2009;9:142. doi: 10.1186/1472-6963-9-142 [published Online First: 2009/08/12] [DOI] [PMC free article] [PubMed] [Google Scholar]
- 4.Asher MI, Weiland SK. The International Study of Asthma and Allergies in Childhood (ISAAC). ISAAC Steering Committee. Clin Exp Allergy 1998;28 Suppl 5:52–66; discussion 90–1. doi: 10.1046/j.1365-2222.1998.028s5052.x [published Online First: 1999/02/13] [DOI] [PubMed] [Google Scholar]
- 5.Gause WC, Rothlin C, Loke P. Heterogeneity in the initiation, development and function of type 2 immunity. Nat Rev Immunol 2020. doi: 10.1038/s41577-020-0301-x [published Online First: 2020/05/06] [DOI] [PMC free article] [PubMed] [Google Scholar]
- 6.Evavold CL, Kagan JC. How Inflammasomes Inform Adaptive Immunity. J Mol Biol 2018;430(2):217–37. doi: 10.1016/j.jmb.2017.09.019 [published Online First: 2017/10/11] [DOI] [PMC free article] [PubMed] [Google Scholar]
- 7.Gonzales-van Horn SR, Farrar JD. Interferon at the crossroads of allergy and viral infections. J Leukoc Biol 2015;98(2):185–94. doi: 10.1189/jlb.3RU0315-099R [published Online First: 2015/05/31] [DOI] [PMC free article] [PubMed] [Google Scholar]
- 8.Aydogmus C, Ayaz NA, Cakan M, et al. Is there any difference regarding atopy between children with familial Mediterranean fever and healthy controls? Allergol Immunopathol (Madr) 2017;45(6):549–52. doi: 10.1016/j.aller.2016.12.006 [published Online First: 2017/05/04] [DOI] [PubMed] [Google Scholar]
- 9.Yazici A, Orge Gonullu E, Kardes B, et al. The prevalence of atopy in patients with familial Mediterranean fever and Behcet’s disease. Clin Exp Rheumatol 2013;31(3 Suppl 77):68–70. [published Online First: 2013/10/23] [PubMed] [Google Scholar]
- 10.Brenner-Ullman A, Melzer-Ofir H, Daniels M, et al. Possible protection against asthma in heterozygotes for familial Mediterranean fever. Am J Med Genet 1994;53(2):172–5. doi: 10.1002/ajmg.1320530210 [published Online First: 1994/11/01] [DOI] [PubMed] [Google Scholar]
- 11.Hitomi Y, Ebisawa M, Tomikawa M, et al. Associations of functional NLRP3 polymorphisms with susceptibility to food-induced anaphylaxis and aspirin-induced asthma. J Allergy Clin Immunol 2009;124(4):779–85 e6. doi: 10.1016/j.jaci.2009.07.044 [published Online First: 2009/09/22] [DOI] [PubMed] [Google Scholar]
- 12.Kwan M, Allen IC, Brickey WJ, et al. The Nlrp3 Inflammasome Affects Airway Inflammation, IgE/IL-13 Production And Mast Cell Function In A Subchronic Model Of Asthma. Journal of Allergy and Clinical Immunology 2010;125(2) doi: 10.1016/j.jaci.2009.12.927 [DOI] [Google Scholar]
- 13.Manthiram K, Zhou Q, Aksentijevich I, et al. The monogenic autoinflammatory diseases define new pathways in human innate immunity and inflammation. Nat Immunol 2017;18(8):832–42. doi: 10.1038/ni.3777 [published Online First: 2017/07/20] [DOI] [PubMed] [Google Scholar]
- 14.Komarow HD, Arceo S, Young M, et al. Dissociation between history and challenge in patients with physical urticaria. J Allergy Clin Immunol Pract 2014;2(6):786–90. doi: 10.1016/j.jaip.2014.07.008 [published Online First: 2014/12/03] [DOI] [PMC free article] [PubMed] [Google Scholar]
- 15.Madsen F, Attermann J, Linneberg A. Epidemiology of non-hereditary angioedema. Acta Derm Venereol 2012;92(5):475–9. doi: 10.2340/00015555-1389 [published Online First: 2012/07/14] [DOI] [PubMed] [Google Scholar]
- 16.Gupta RS, Warren CM, Smith BM, et al. The Public Health Impact of Parent-Reported Childhood Food Allergies in the United States. Pediatrics 2018;142(6) doi: 10.1542/peds.2018-1235 [published Online First: 2018/11/21] [DOI] [PMC free article] [PubMed] [Google Scholar]
- 17.Mansoor E, Saleh MA, Cooper GS. Prevalence of Eosinophilic Gastroenteritis and Colitis in a Population-Based Study, From 2012 to 2017. Clin Gastroenterol Hepatol 2017;15(11):1733–41. doi: 10.1016/j.cgh.2017.05.050 [published Online First: 2017/06/13] [DOI] [PubMed] [Google Scholar]
- 18.Mansoor E, Cooper GS. The 2010–2015 Prevalence of Eosinophilic Esophagitis in the USA: A Population-Based Study. Dig Dis Sci 2016;61(10):2928–34. doi: 10.1007/s10620-016-4204-4 [published Online First: 2016/06/03] [DOI] [PMC free article] [PubMed] [Google Scholar]
- 19.Gupta RS, Warren CM, Smith BM, et al. Prevalence and Severity of Food Allergies Among US Adults. JAMA Netw Open 2019;2(1):e185630. doi: 10.1001/jamanetworkopen.2018.5630 [published Online First: 2019/01/16] [DOI] [PMC free article] [PubMed] [Google Scholar]
- 20.Salo PM, Calatroni A, Gergen PJ, et al. Allergy-related outcomes in relation to serum IgE: results from the National Health and Nutrition Examination Survey 2005–2006. J Allergy Clin Immunol 2011;127(5):1226–35 e7. doi: 10.1016/j.jaci.2010.12.1106 [published Online First: 2011/02/16] [DOI] [PMC free article] [PubMed] [Google Scholar]
- 21.Gergen PJ, Arbes SJ Jr., Calatroni A, et al. Total IgE levels and asthma prevalence in the US population: results from the National Health and Nutrition Examination Survey 2005–2006. J Allergy Clin Immunol 2009;124(3):447–53. doi: 10.1016/j.jaci.2009.06.011 [published Online First: 2009/08/04] [DOI] [PMC free article] [PubMed] [Google Scholar]
- 22.Aksentijevich I, Nowak M, Mallah M, et al. De novo CIAS1 mutations, cytokine activation, and evidence for genetic heterogeneity in patients with neonatal-onset multisystem inflammatory disease (NOMID): a new member of the expanding family of pyrin-associated autoinflammatory diseases. Arthritis Rheum 2002;46(12):3340–8. doi: 10.1002/art.10688 [published Online First: 2002/12/17] [DOI] [PMC free article] [PubMed] [Google Scholar]
- 23.Klion AD. How I treat hypereosinophilic syndromes. Blood 2015;126(9):1069–77. doi: 10.1182/blood-2014-11-551614 [published Online First: 2015/05/13] [DOI] [PMC free article] [PubMed] [Google Scholar]
- 24.Piram M, Kone-Paut I, Lachmann HJ, et al. Validation of the auto-inflammatory diseases activity index (AIDAI) for hereditary recurrent fever syndromes. Ann Rheum Dis 2014;73(12):2168–73. doi: 10.1136/annrheumdis-2013-203666 [published Online First: 2013/09/13] [DOI] [PMC free article] [PubMed] [Google Scholar]
- 25.Quaranta M, Knapp B, Garzorz N, et al. Intraindividual genome expression analysis reveals a specific molecular signature of psoriasis and eczema. Sci Transl Med 2014;6(244):244ra90. doi: 10.1126/scitranslmed.3008946 [published Online First: 2014/07/11] [DOI] [PubMed] [Google Scholar]
- 26.Kilpelainen M, Terho EO, Helenius H, et al. Validation of a new questionnaire on asthma, allergic rhinitis, and conjunctivitis in young adults. Allergy 2001;56(5):377–84. doi: 10.1034/j.1398-9995.2001.056005377.x [published Online First: 2001/05/15] [DOI] [PubMed] [Google Scholar]
- 27.Rabinovitch E, Harats D, Yaron P, et al. Familial Mediterranean fever gene and protection against asthma. Annals of Allergy, Asthma & Immunology 2007;99(6):517–21. doi: 10.1016/s1081-1206(10)60380-8 [DOI] [PubMed] [Google Scholar]
- 28.Rochman M, Azouz NP, Rothenberg ME. Epithelial origin of eosinophilic esophagitis. J Allergy Clin Immunol 2018;142(1):10–23. doi: 10.1016/j.jaci.2018.05.008 [published Online First: 2018/07/08] [DOI] [PMC free article] [PubMed] [Google Scholar]
- 29.Figueras-Nart I, Mascaro JM Jr., Solanich X, et al. Dermatologic and Dermatopathologic Features of Monogenic Autoinflammatory Diseases. Front Immunol 2019;10:2448. doi: 10.3389/fimmu.2019.02448 [published Online First: 2019/11/19] [DOI] [PMC free article] [PubMed] [Google Scholar]
- 30.Bernstein JA, Lang DM, Khan DA, et al. The diagnosis and management of acute and chronic urticaria: 2014 update. J Allergy Clin Immunol 2014;133(5):1270–7. doi: 10.1016/j.jaci.2014.02.036 [published Online First: 2014/04/29] [DOI] [PubMed] [Google Scholar]
- 31.Greaves MW. Chronic urticaria. N Engl J Med 1995;332(26):1767–72. doi: 10.1056/NEJM199506293322608 [published Online First: 1995/06/29] [DOI] [PubMed] [Google Scholar]
- 32.Zuberbier T, Balke M, Worm M, et al. Epidemiology of urticaria: a representative cross-sectional population survey. Clin Exp Dermatol 2010;35(8):869–73. doi: 10.1111/j.1365-2230.2010.03840.x [published Online First: 2010/05/12] [DOI] [PubMed] [Google Scholar]
- 33.Furue M, Yamazaki S, Jimbow K, et al. Prevalence of dermatological disorders in Japan: a nationwide, cross-sectional, seasonal, multicenter, hospital-based study. J Dermatol 2011;38(4):310–20. doi: 10.1111/j.1346-8138.2011.01209.x [published Online First: 2011/03/24] [DOI] [PubMed] [Google Scholar]
- 34.Lehman H, Gordon C. The Skin as a Window into Primary Immune Deficiency Diseases: Atopic Dermatitis and Chronic Mucocutaneous Candidiasis. J Allergy Clin Immunol Pract 2019;7(3):788–98. doi: 10.1016/j.jaip.2018.11.026 [published Online First: 2019/03/06] [DOI] [PubMed] [Google Scholar]
- 35.Kaplan MH, Hufford MM, Olson MR. The development and in vivo function of T helper 9 cells. Nat Rev Immunol 2015;15(5):295–307. doi: 10.1038/nri3824 [published Online First: 2015/04/08] [DOI] [PMC free article] [PubMed] [Google Scholar]
- 36.Nakayama T, Hirahara K, Onodera A, et al. Th2 Cells in Health and Disease. Annu Rev Immunol 2017;35:53–84. doi: 10.1146/annurev-immunol-051116-052350 [published Online First: 2016/12/04] [DOI] [PubMed] [Google Scholar]
- 37.Ovadia A, Livneh A, Feld O, et al. T helper 17 polarization in familial Mediterranean fever. Genes Immun 2013;14(4):212–6. doi: 10.1038/gene.2013.6 [published Online First: 2013/03/08] [DOI] [PubMed] [Google Scholar]
- 38.Meng G, Zhang F, Fuss I, et al. A mutation in the Nlrp3 gene causing inflammasome hyperactivation potentiates Th17 cell-dominant immune responses. Immunity 2009;30(6):860–74. doi: 10.1016/j.immuni.2009.04.012 [published Online First: 2009/06/09] [DOI] [PMC free article] [PubMed] [Google Scholar]
- 39.Bonnelykke K, Sparks R, Waage J, et al. Genetics of allergy and allergic sensitization: common variants, rare mutations. Curr Opin Immunol 2015;36:115–26. doi: 10.1016/j.coi.2015.08.002 [published Online First: 2015/09/20] [DOI] [PMC free article] [PubMed] [Google Scholar]
- 40.Gurung P, Karki R, Vogel P, et al. An NLRP3 inflammasome-triggered Th2-biased adaptive immune response promotes leishmaniasis. J Clin Invest 2015;125(3):1329–38. doi: 10.1172/JCI79526 [published Online First: 2015/02/18] [DOI] [PMC free article] [PubMed] [Google Scholar]
- 41.Bruchard M, Rebe C, Derangere V, et al. The receptor NLRP3 is a transcriptional regulator of TH2 differentiation. Nat Immunol 2015;16(8):859–70. doi: 10.1038/ni.3202 [published Online First: 2015/06/23] [DOI] [PubMed] [Google Scholar]
- 42.Almeida de Jesus A, Goldbach-Mansky R. Monogenic autoinflammatory diseases: concept and clinical manifestations. Clin Immunol 2013;147(3):155–74. doi: 10.1016/j.clim.2013.03.016 [published Online First: 2013/05/29] [DOI] [PMC free article] [PubMed] [Google Scholar]
- 43.Ahmadi N, Brewer CC, Zalewski C, et al. Cryopyrin-associated periodic syndromes: otolaryngologic and audiologic manifestations. Otolaryngol Head Neck Surg 2011;145(2):295–302. doi: 10.1177/0194599811402296 [published Online First: 2011/04/16] [DOI] [PMC free article] [PubMed] [Google Scholar]
- 44.Liu Y, Jesus AA, Marrero B, et al. Activated STING in a vascular and pulmonary syndrome. N Engl J Med 2014;371(6):507–18. doi: 10.1056/NEJMoa1312625 [published Online First: 2014/07/17] [DOI] [PMC free article] [PubMed] [Google Scholar]
- 45.Drucker AM, Cho E, Li WQ, et al. Diagnosis validation and clinical characterization of atopic dermatitis in Nurses’ Health Study 2. J Eur Acad Dermatol Venereol 2019;33(3):588–94. doi: 10.1111/jdv.15360 [published Online First: 2018/11/24] [DOI] [PMC free article] [PubMed] [Google Scholar]
- 46.Yang CL, To T, Foty RG, et al. Verifying a questionnaire diagnosis of asthma in children using health claims data. BMC Pulm Med 2011;11:52. doi: 10.1186/1471-2466-11-52 [published Online First: 2011/11/24] [DOI] [PMC free article] [PubMed] [Google Scholar]
Associated Data
This section collects any data citations, data availability statements, or supplementary materials included in this article.