

Abstract
Regenerative, cell‐based therapy is a promising treatment option for diabetic kidney disease (DKD), which has no cure. To prepare for clinical translation, this systematic review and meta‐analysis summarized the effect of cell‐based interventions in DKD animal models and treatment‐related factors modifying outcomes. Electronic databases were searched for original investigations applying cell‐based therapy in diabetic animals with kidney endpoints (January 1998‐May 2019). Weighted or standardized mean differences were estimated for kidney outcomes and pooled using random‐effects models. Subgroup analyses tested treatment‐related factor effects for outcomes (creatinine, urea, urine protein, fibrosis, and inflammation). In 40 studies (992 diabetic rodents), therapy included mesenchymal stem/stromal cells (MSC; 61%), umbilical cord/amniotic fluid cells (UC/AF; 15%), non‐MSC (15%), and cell‐derived products (13%). Tissue sources included bone marrow (BM; 65%), UC/AF (15%), adipose (9%), and others (11%). Cell‐based therapy significantly improved kidney function while reducing injury markers (proteinuria, histology, fibrosis, inflammation, apoptosis, epithelial‐mesenchymal‐transition, oxidative stress). Preconditioning, xenotransplantation, and disease‐source approaches were effective. MSC and UC/AF cells had greater effect on kidney function while cell products improved fibrosis. BM and UC/AF tissue sources more effectively improved kidney function and proteinuria vs adipose or other tissues. Cell dose, frequency, and administration route also imparted different benefits. In conclusion, cell‐based interventions in diabetic animals improved kidney function and reduced injury with treatment‐related factors modifying these effects. These findings may aid in development of optimal repair strategies through selective use of cells/products, tissue sources, and dose administrations to allow for successful adaptation of this novel therapeutic in human DKD.
Keywords: apoptosis, chronic kidney disease, diabetes, diabetic nephropathy, extracellular vesicles, inflammation, mesenchymal stem cells, stem cells, umbilical cord blood
Cell‐based therapies improve diabetic kidney repair: a systematic review and meta‐analysis.
Significance statement.
This systematic review and meta‐analysis quantitatively summarizes the therapeutic effect and factors influencing regenerative, cell‐based therapies in experimental diabetic kidney disease (DKD). In 40 studies (992 diabetic rodents), infusion of mesenchymal stromal cells, umbilical cord/amniotic fluid cells, other tissue‐derived cells, or cell products improved kidney function while reducing kidney injury markers (proteinuria, fibrosis, inflammation, apoptosis, epithelial‐mesenchymal transition, histology, and oxidative stress) and supporting repair. Approaches incorporating preconditioning, xenotransplantation, and disease‐source strategies were also effective. Notably, treatment‐related factors, such as cell type, tissue source, source health, dose, and infusion route, influenced cell‐based therapy effects on kidney outcomes. Collectively, these findings provide evidence of the therapeutic benefit derived by cell‐based therapy in DKD and may inform experimental and clinical translation of these findings.
1. INTRODUCTION
Diabetic kidney disease (DKD), the leading cause of end‐stage kidney disease in the United States, has no adequate cure.1 Regenerative, cell‐based therapies such as mesenchymal stromal cells (MSC), the most extensively studied cells, facilitate kidney repair through paracrine‐mediated actions, including release of extracellular vesicles, and cell‐cell interactions reactivating endogenous repair systems.2, 3, 4, 5, 6, 7 In the injured kidney, MSC release antifibrotic and antiapoptotic (ie, hepatocyte growth factor [HGF]), pro‐angiogenic (ie, vascular endothelial growth factor), and anti‐inflammatory (ie, indoleamine 2,3 deoxygenase; prostaglandin E2) soluble mediators.2, 3, 4, 5, 6, 7 Furthermore, peripheral delivery of cells induces reparative effects. Proposed mechanisms include the engulfment of apoptotic MSC by macrophages which promote an anti‐inflammatory macrophage phenotype switch associated with interleukin (IL)‐10 release that dampens the inflammatory response.8, 9 Collectively, these reparative actions by MSC, other stem cells, and cell‐derived products reduce glomerulosclerosis, interstitial fibrosis, tubulointerstitial inflammation, and oxidative stress in the damaged kidney.
In addition to DKD, these reparative effects have been demonstrated in several animal models of kidney disease, including renovascular disease, lupus nephritis, chemotherapy‐induced injury, acute kidney injury, and kidney transplantation.10, 11, 12, 13 Cell‐based therapies were safe, reduced kidney injury, and improved kidney function therein providing preclinical evidence supporting clinical trial pursuits in humans with DKD.6, 13, 14, 15 Earlier attempts to quantitatively summarize cell‐based therapy effects in experimental DKD were limited by a small number of available studies.6, 16 Yet, stem cell‐based therapies improved kidney function, proteinuria, metabolic parameters, and kidney/body weight in diabetic animals (n = 8 original studies).16 In the last decade, the number of investigations in animal models of DKD has more than tripled.17, 18, 19, 20, 21, 22 Collectively, these encouraging studies provided the basis for a single early‐phase clinical trial in DKD23 and others are currently underway (NCT02585622, NCT03840343, NCT04869761, NCT04125329, NCT04216849, NCT02008851, NCT03270956, NCT02836574).
A better understanding of the impact of numerous treatment‐related factors on regenerative, cell‐based therapy approaches in DKD is needed.10, 24 First, the most optimal cell dose, number of administrations,25, 26, 27, 28, 29, 30 and delivery route26, 31, 32, 33, 34, 35, 36, 37, 38 have yet to be determined. Second, exploitation of stem cell paracrine‐mediated activities using cell‐derived products, such as extracellular vesicles and conditioned medium, has not been fully explored.22, 39, 40, 41, 42 Third, the pro‐apoptotic, DKD microenvironment reduces stem cell function and vitality,11, 43, 44, 45 thus novel preconditioning strategies and alternative delivery methods are being actively pursued.21, 22, 32, 34, 46, 47, 48, 49, 50, 51 Fourth, feasibility of cells harvested from diseased (autologous) host sources requires additional testing.35, 45, 46, 50 Each of these treatment‐related factors may influence effects of cell‐based therapy on kidney outcomes.
The current pool of available studies now affords an opportunity to summarize the effect of cell‐based therapy in experimental models of DKD and gain better understanding of how treatment‐related factors may influence DKD outcomes. These findings may offer direction for new interventions in experimental models of DKD and inform the translation of cell‐based therapies to clinical trials. Thus, the aim of this systematic review and meta‐analysis project was to (a) to evaluate the regenerative effect of cell‐based therapies in animal models of DKD and (b) to determine the impact of treatment‐related factors on kidney outcomes.
2. MATERIALS AND METHODS
2.1. Data sources and searches
A systemic review and meta‐analysis was conducted to examine the effects of cell and cell‐based therapies on kidney outcomes measures in animal models of diabetes. We searched for studies published between January 1, 1998 and May 3, 2019 in MEDLINE (R), Embase, Web of Science, and Scopus. Database searches were adapted from Papazova et al6 and formatted for DKD query (Material S1 in Supporting Information).
2.2. Study selection
Search results yielded 699 English language articles which were subjected to initial screening of titles and abstracts with full‐text reviews for clarification (L.J.H., J.M.M.). Articles were initially prescreened for content that included regenerative, cell‐based therapy studies in animal models of diabetes which contained kidney outcomes. Regenerative therapies applied in nondiabetes conditions and human studies were excluded. Nonoriginal investigations, including conference abstracts, reviews, systematic reviews, and meta‐analyses, were excluded but used to search for additional articles.
Eligibility was then assessed in the remaining 51 articles (Figure 1). Initial full text reviews were independently conducted in first (X.B., S.M.C., S.M.H., X.Z., A.K.) and second (J.M.M., T.A., L.J.H., G.B.‐B.) rounds to assess inclusion and exclusion criteria below. In the case of disagreement, a third review was performed (L.J.H.). Final study cohort was reviewed by the team. Out of the 51 articles, 40 studies were included in the final qualitative and quantitative synthesis.
FIGURE 1.
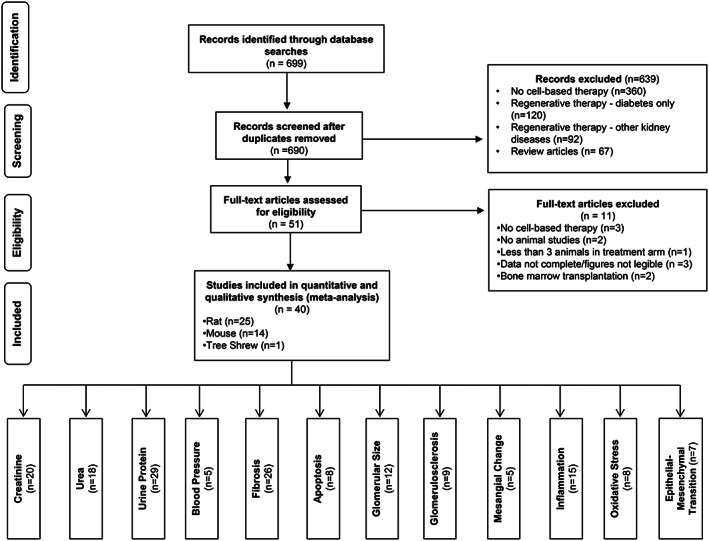
PRISMA flow diagram of study selection criteria and kidney outcomes. The studies were selected according to the inclusion and exclusion criteria. Titles and abstract were initially screened, followed by more in‐depth full‐text reviews
2.2.1. Inclusion criteria
Studies meeting all three inclusion criteria were appraised and analyzed. Inclusion criteria were: (a) original investigation in animals with diabetes, (b) cell or cell‐based therapy intervention, and (c) kidney outcome measures reported postintervention.
2.2.2. Exclusion criteria
Articles undergoing full‐text reviews were excluded for the following reason(s): (a) fewer than three animals in treatment/intervention group(s), (b) lack of appropriate diabetes control group, (c) cell‐based intervention using irradiation and/or bone‐marrow transplantation procedure, or (d) incomplete or illegible data or figures preventing data abstraction and comparison to other studies.
2.3. Data extraction and quality assessment
Study characteristics captured included animal demographics, experimental groups, diabetes induction, cell type, and kidney‐based outcomes. Animal demographics included species, strain, sex, and diabetes model. Cell/cell product data included: cell type (or cell product including exosomes, extracellular vesicles, or microvesicles, and conditioned medium), tissue source, and host source (within species or xenotransplantation from humans), and host source health (diseased or healthy). Manipulation of animal exposures (ie, cyclosporine gavage) and cell manipulations were captured. MSC are differentiated from other multipotent cells as defined by criteria provided by the International Society for Cellular Therapy.52 Preconditioning methods, homing methods (ie, ultrasound‐targeted microbubble destruction), and cell sorting were collectively grouped as “preconditioning” for the subgroup analyses. Cell treatment‐related data included cell number per dose administration, dosing frequency, dosing number, and route of cell delivery. Cell‐based interventions were also categorized as preventative if therapy was given before or during induction of diabetes (0‐6 days for induction models) or rescue if the intervention was given after initiation of the diabetic model. The duration of follow‐up was captured for each animal.
Kidney‐based outcomes in blood, urine, or kidney tissue samples included: plasma creatinine, plasma urea (or blood urea nitrogen [BUN]), urinary protein (or albumin), glomerular filtration rate/creatinine clearance, renal histology, blood pressure (BP), kidney injury markers (including glomerular/mesangial histologic changes, markers of inflammation, fibrosis, apoptosis, oxidative stress, and epithelial‐to‐mesenchymal transition [EMT]). For the primary analyses, measurements from the latest time point after cell intervention were used. Measurements were abstracted at various time points following cell intervention (early (<4 weeks), middle (4‐7 weeks), and late (≥8 weeks) when reported.
The control (including animals receiving anti‐diabetes therapy) and experimental groups were compared. BUN measurements were converted to urea (mg/dL). Plasma and serum creatinine were converted to mg/dL. Proteinuria and albuminuria were converted to mg per 24 hours. Urine albumin‐to‐creatinine ratio (UACR) data were uniformly converted to μg/mg. In studies that reported multiple measurements of urine protein excretion, only one was included in the final analysis, with the default being UACR when available.
All outcomes were captured as %change or in actual units. Data were collected from article text and tables. Article authors were contacted by email to request missing data. Results in graphs were abstracted using WebPlotDigitizer v.4.1 (Austin, Texas) software. Data extraction was done independently by two reviewers (J.M.M., T.A.) with a third reviewer (G.B.‐B.) for quality control. The SEM was converted to SD (SD = √n × SEM).
Assessment of the reporting quality of included studies was performed using a scoring system adapted from Papazova et al6 and Wever et al.53 Evaluation of risk of bias was performed using Systematic Review Centre for Laboratory animal Experimentation (SYRCLE) risk of bias tool.54 Funnel plot was produced for creatinine outcome to assess the potential for publication bias.55 Scoring of quality assessment (G.B.‐B., J.M.M.) and risk of bias (G.B.‐B., T.A.) were performed by two independent reviewers with a third reviewer (L.J.H.) for discrepancies.
2.4. Data synthesis and analysis
Outcomes were estimated as weighted mean difference (WMD) for creatinine, urea, and BP as these outcomes were measured consistently across studies and were presented in natural units. Urine protein excretion measures (UACR, albuminuria, proteinuria) were grouped and reported as a standardized mean difference (SMD). For all other kidney outcomes, results were expressed as SMD with 95% confidence intervals (CIs) due to heterogeneity of measurement methods.56 Random‐effects model (RE) was used to conduct meta‐analysis due to heterogeneity across studies.57 Heterogeneity was expressed using the (I 2) index.58 I 2 > 50% was considered to suggest substantial heterogeneity.
Though multiple injury markers were analyzed, five outcomes were considered primary outcomes of interest (creatinine, urea, proteinuria, fibrosis, and inflammation). Subgroup‐analyses of these primary outcomes were performed to assess the animal‐ and treatment‐related effects of cell‐based therapy. For animal‐related effect analyses, species (rat, mouse, tree shrew), sex (male, female), and diabetes induction (Streptozotocin [STZ], db/db, other) were compared. Treatment‐related effect analyses included: cell type (MSC, umbilical cord/amniotic fluid cells [UC/AF], non‐MSC, cell products), tissue source (bone marrow [BM], adipose, UC/AF, other), host source (within species, xenotransplant), host source's health (healthy, disease), cell manipulation (standard culture medium, preconditioning/homing/manipulation methods), route of delivery (tail vein, other), cell dose total (low [<105 cells], medium [105‐106 cells], high [>107 cells]),59 outcome reporting times (early [<4 weeks], middle [4‐7 weeks], and late [≥8 weeks]), and dosing frequency (single, multiple). Differences between the groups were evaluated using an interaction test as suggested by Altman and Bland.60 Analysis was conducted using Stata software package (StataCorp. 2017. Stata Statistical Software: Release 15. College Station, TX: StataCorp LLC).
This systematic review was registered at the International prospective register of systematic reviews (ID: CRD42019136200).
3. RESULTS
3.1. Study selection and characteristics
Electronic search generated 699 articles. After title and abstract reviews, 51 articles underwent full text reviews among which 40 original articles met inclusion criteria (Material S2 in Supporting Information). A total of 992 diabetic animals (438 control; 554 treated) were used to investigate cell‐based therapy effects on DKD (Table S1). Studies included 580 rats (59%), 400 mice (40%), and 12 tree shrews (1%) with 840 male and 152 female animals. Three diabetes models were used: streptozotocin (STZ; type 1 diabetes) (81%), genetic defect in leptin receptor (db/db, 11%; type 2 diabetes), and high fat diet (8%; type 2 diabetes). Some studies examined more than one diabetes model per article42, 46 and others further modified the injury model (ie, STZ plus uric acid).22
3.2. Cell‐based therapy characteristics
Several cells/products were infused (Table 1). Over half (61%) of studies used MSC followed by UC/AF cells (11%), other cells (Non‐MSC 15%), and cell products (extracellular vesicles or conditioned medium; 13%). Tissue sources for cells/products were derived from BM (65%), UC/AF (15%), adipose (9%), and other tissues (dental pulp, liver, pancreas, kidney, urine; 11%). Most studies used allogeneic cells/products (78%) and others were from human hosts (22%; xenotransplant). Cell passage was provided in 32 studies among which the majority utilized cells at passage 3 or fewer (75%), followed by passages 4 to 5 (9.4%) and passages 6 or more (15.6%). In 25 (67.6%) of 37 studies reporting culture medium, solutions were comprised of a combination of Dulbecco's Modified Eagle Medium (DMEM) plus 10% to 20% fetal bovine serum with varying supplements, growth factors, and antibiotics. A healthy host donated cells for nearly all studies (93%) leaving a small minority with diseased (diabetic) hosts. Fifty‐nine percent of studies administered cell/product in a single dose, while the remaining studies delivered multiple doses (range: 2‐8 doses/animal). A total cell dose less than 1.0 × 10⁷ cells/animal was provided in 61% of studies. Cells/product were delivered to animals through multiple routes (renal subcapsule, intracardiac, peritoneal cavity, jugular vein, renal artery, orbital plexus, and pudendal vein) though tail vein was most common (70%). Rescue therapy was most often used (89%) over preventative approaches. A quarter of studies employed “preconditioning” methods to improve cell function/vitality (Table S2). Cell/animal manipulations consisted of protein overexpression (SIRT3), preconditioning (growth factors, cytokines, umbilical cord extract, melatonin), transfection (microRNA‐124a, shRNA against HIF1‐a; miRNA‐451a), and cell sorting combined with homing (microbubble destruction) or coadministration of cyclosporine to animals.
TABLE 1.
Pooled cell types
| Mesenchymal stem/stromal cells (MSC) | Umbilical cord and amniotic fluid stem cells (UC/AF) | Nonmesenchymal stem/stromal cells (non‐MSC) | Cell products |
|---|---|---|---|
|
Adipose‐derived (MSC‐Ad) Bone marrow‐derived (MSC‐BM) Human umbilical cord blood‐derived (MSC‐hUCB) |
Amniotic fluid stem cells (AFSC) Human umbilical cord blood‐derived mononuclear cells (HUCB‐SC) Human umbilical cord Wharton jelly cells (hUCWJC) |
Early outgrowth bone marrow cells (EoBMC) Dental pulp stem cells (DPSC) Myeloid‐derived suppressor cells (MDSC) Pancreatic progenitor (fetal) cells Selected renal cells (SRC) |
MSC‐derived: Exosomes, extracellular vesicles, or microvesicles (MSC‐EV) Conditioned medium (MSC‐CM) Other cell‐derived: Human‐liver stem‐like cells (HLSC‐EV) Urine‐derived stem cells (USC‐EV) |
| Articles | |||
|
Fang 2012 (MSC‐Ad) Ni 2015 (MSC‐Ad) Tang 2018 (MSC‐Ad) Zhang 2013‐1 (MSC‐Ad) Park 2012‐1 (MSC‐hUCB) All remaining papers (MSC‐BM) |
El‐Ashmawy 2018 (HUCB‐SC) Feng (AFSC) Maldonado 2017 (hUCWJC) Masoad 2012 (HUCB‐SC) Park 2012‐2 (HUCB‐SC) |
Guimaraes et al 2013 (DPSC) Hsieh 2018 (MDSC) Jiang 2017 (Pancreatic progenitor) Kelly (SRC) Zhang 2012 (EoBMC) |
Ebrahim 2018 (MSC‐EV) Grange 2019 (HLSC‐EV) and (MSC‐EV) Jiang 2016 (USC‐EV) Nagaishi 2016 (MSC‐CM) and (MSC) Zhong 2019 (MSC‐hUC‐EV) |
3.3. Meta‐analysis
3.3.1. Kidney function, histology, and BP
Effects of cell‐based therapy are shown for abstracted kidney outcomes (Figure 2). Compared with controls, animals receiving cell‐based therapy had improved kidney function as evidenced by reduced serum creatinine (Figure S1) and serum urea. Diabetes‐induced renal histological changes, including glomerular size, glomerulosclerosis, and mesangial alterations, were improved. A significant reduction in both systolic and diastolic BP was also found. Heterogeneity was observed for nearly all outcomes (I 2 ≥ 77.9%). Overall, cell‐based therapy improved kidney function, histology, and BP in animal models of DKD.
FIGURE 2.
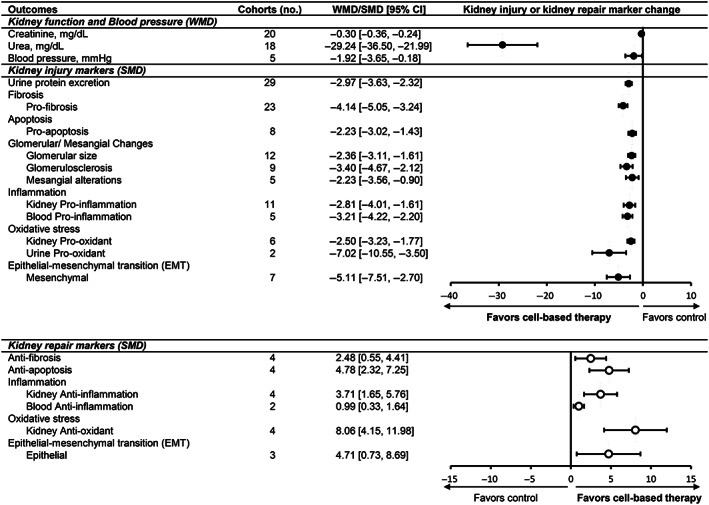
Effect of cell‐based therapies on kidney outcomes in animal models of DKD. Forest plots display changes in kidney function, blood pressure, kidney injury markers, and kidney repair markers following cell‐based therapy in diabetic animals. Data are displayed as weighted mean difference (WMD) or standardized mean difference (SMD) and 95% confidence intervals (CIs). Weights are from random effects analysis. Creatinine and urea are measured in plasma. Blood pressure represents systolic and diastolic readings. Forest plot: closed circles represent kidney injury markers; open circles represent kidney repair markers. DKD, diabetic kidney disease; EMT, epithelial‐mesenchymal transition
3.3.2. Kidney injury markers (proteinuria, fibrosis, inflammation, apoptosis, oxidative stress, EMT)
Several studies (n = 32) examined cell‐based therapy effects on urine protein excretion in DKD animals. Among these, three studies had substantial data outliers and were excluded from the meta‐analysis.21, 32, 61 Urine protein excretion was reduced in treated animals (Figure S2), specifically UACR (WMD −60.090 μg/mg; 95% CI: −65.56, −54.62), albuminuria (WMD −28.83 mg/24 h; 95% CI: −41.813, −15.851), and proteinuria (WMD −14.28 mg/24 h; 95% CI: −21.078, −7.474). Other markers of kidney injury, such as fibrosis (Figure S3), were consistently reduced by cell/product therapy compared to controls. Moreover, a reduction in injury markers (inflammation, oxidative stress, apoptosis, and EMT) was accompanied by an increase in pro‐repair markers (anti‐inflammation, antioxidant, anti‐fibrosis) following cell/product treatment.
Additional analyses focused on individual markers of inflammation, fibrosis, and oxidative stress (Figure 3; Table S3). Among pro‐inflammatory markers, tumor necrosis factor‐α (TNF‐α), leukocyte infiltration, macrophage attractors, and macrophage abundance were significantly reduced (kidney, blood) and anti‐inflammatory interleukin (IL)‐10 (kidney, blood) was increased (Figure 4). The most commonly tested pro‐fibrosis markers included transforming growth factor‐β (TGF‐β), fibronectin, and collagen I, which were all significantly reduced. Pro‐oxidative stress markers in the kidney and urine were significantly reduced. However, antioxidant markers in the kidney were not affected. Overall, cell‐based therapy was associated with a decrease in kidney injury markers across multiple sites (blood, kidney, and urine) and an increase in markers of pro‐repair.
FIGURE 3.
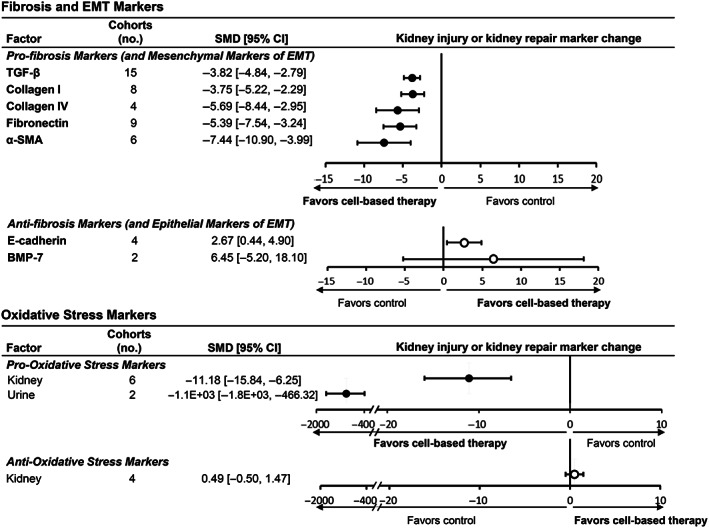
Subgroup analyses of cell‐based therapy effects on specific markers of fibrosis, epithelial‐mesenchymal transition, and oxidative stress in animal models of DKD. Forest plots display changes in markers of kidney repair and injury for fibrosis and epithelial‐mesenchymal‐transition (upper panel), and oxidative stress (lower panel) in kidney, blood, and/or urine following cell or cell product administration to animals with diabetes. Data are displayed as standardized mean difference (SMD) and 95% confidence intervals (CIs). Forest plot: closed circles represent kidney injury markers; open circles represent kidney repair markers. 95% CI, 95% confidence interval; α‐SMA, α‐smooth muscle actin; BMP‐7, bone morphometric protein‐7; DKD, diabetic kidney disease; EMT, epithelial‐mesenchymal transition; TGF‐β, transforming growth factor‐β. Pro‐oxidative stress markers included: MDA, malondialdehyde; ROS, reactive oxygen species; LPO, lipid peroxidation; DHE fluorescence, dihyhroethidium fluorescence, urinary isoprostane. Anti‐oxidative stress markers included: total anti‐oxidant capacity and superoxide dismutase (SOD)
3.4. Treatment‐related factors affecting kidney outcomes
Five outcomes were considered primary outcomes of interest (creatinine, urea, proteinuria, fibrosis, and inflammation) for which subgroup analyses of animal‐ and treatment‐related effects were performed (Tables S4‐S9).
FIGURE 4.
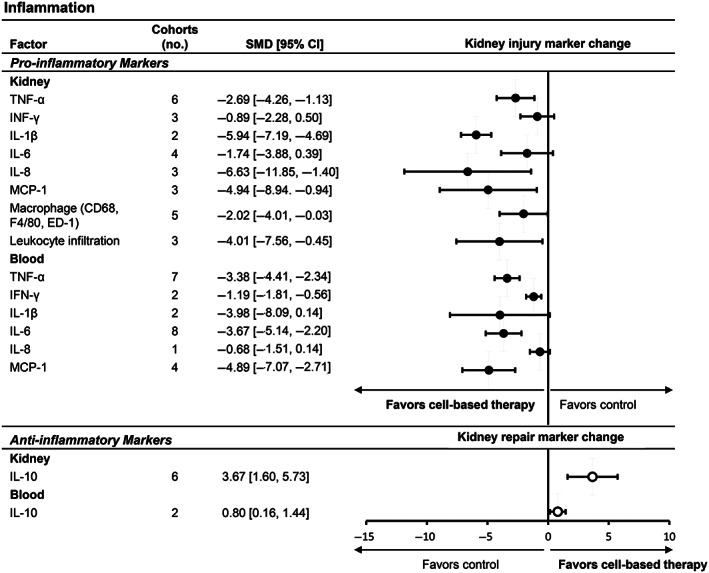
Subgroup analyses of cell‐based therapy effects on individual markers of inflammation in animal models of DKD. Forest plots display changes in markers of kidney repair (upper panel) and injury (lower panel) for inflammation in kidney, blood, and/or urine following cell or cell product administration to animals with diabetes. Data are displayed as standardized mean difference (SMD) and 95% confidence intervals (CIs). Forest plot: closed circles represent kidney injury markers; open circles represent kidney repair markers. 95% CI, 95% confidence interval; CD68, cluster of differentiation 68; DKD, diabetic kidney disease; ED‐1, monoclonal CD68 antibody; IL, interleukin; INF‐ γ, interferon gamma; MCP‐1, monocyte chemoattractant protein‐1; TNF‐α, tumor necrosis factor‐α
3.4.1. Cell type
Of the cell groups (MSC, UC/AF, non‐MSC, and cell product), only cell product failed to significantly reduce creatinine compared to controls (Table 2). MSC (P < .0001) and UC/AF (P = .05) more effectively reduced creatinine vs non‐MSC therapy. All groups reduced urea but no between group differences were observed (P ≤ .7). UC/AF cells were associated with a greater reduction in urine protein compared to MSC (P = .03) or cell product (P = .04), while non‐MSC failed to significantly reduce excretion. For fibrosis, product reduced pro‐fibrotic markers greater than MSC (P = .03) and UC/AF (P = .03). Notably, UC/AF failed to reduce pro‐fibrosis markers. Finally, MSC consistently altered pro‐inflammatory and anti‐inflammatory markers. Overall, cell types that emerged as particularly effective included MSC and UC/AF for creatinine, UC/AF for urine protein, and cell product for fibrosis outcomes.
TABLE 2.
Effect of treatment‐related factors: cell type
| Cell type | No. of articles | WMD/SMD [95% CI] | Comparison group | P value |
|---|---|---|---|---|
| Creatinine (mg/dL) | ||||
| MSC | 13 | −0.29 [−0.36, −0.22] | MSC vs UC/AF | .7 |
| UC/AF | 4 | −0.34 [−0.57, −0.10] | MSC vs Non‐MSC | <.0001 |
| Non‐MSC | 1 | −0.10 [−0.13, −0.07] | MSC vs Product | .7 |
| Cell product | 2 | −0.41 [−1.03, 0.20] | Non‐MSC vs UC/AF | .05 |
| — | Non‐MSC vs Product | .3 | ||
| — | UC/AF vs Product | .8 | ||
| — | Non‐MSC vs Product | .09 | ||
| Urea (mg/dL) | ||||
| MSC | 12 | −31.66 [−44.46, −18.85] | MSC vs UC/AF | .06 |
| UC/AF | 3 | −17.32 [−25.22, −9.42] | MSC vs Non‐MSC | .08 |
| Non‐MSC | 1 | −19.25 [−24.33, −14.17] | MSC vs Product | .3 |
| Cell product | 2 | −59.22 [−105.86, −12.59] | UC/AF vs Non‐MSC | .7 |
| — | UC/AF vs Product | .08 | ||
| — | Non‐MSC vs Product | .09 | ||
| Urine protein | ||||
| MSC | 20 | −2.38 [−2.97, −1.79] | MSC vs UC/AF | .03 |
| UC/AF | 3 | −26.43 [−48.19, −4.67] | MSC vs Non‐MSC | .3 |
| Non‐MSC | 2 | −43.85 [−116.81, 29.10] | MSC vs Product | .2 |
| Cell product | 4 | −3.823 [−5.68, −1.96] | UC/AF vs Non‐MSC | .7 |
| — | UC/AF vs Product | .04 | ||
| — | Non‐MSC vs Product | .3 | ||
| Fibrosis | ||||
| Pro‐fibrosis | ||||
| MSC | 16 | −3.93 [−5.03, −2.83] | MSC vs UC/AF | .5 |
| UC/AF | 2 | −2.50 [−6.68, 1.68] | MSC vs Non‐MSC | .4 |
| Non‐MSC | 3 | −5.30 [−8.28, −2.32] | MSC vs Product | .03 |
| Cell product | 2 | −9.51 [−14.28, −4.73] | Non‐MSC vs UC/AF | .3 |
| — | Non‐MSC vs Product | .1 | ||
| — | UC/AF vs Product | .03 | ||
| Antifibrosis | ||||
| MSC | 3 | 4.01 [0.87, 7.15] | MSC vs UC/AF | .1 |
| UC/AF | 1 | 1.33 [0.15, 2.50] | — | — |
| Inflammation | ||||
| Blood pro‐inflammation | ||||
| MSC | 5 | −2.83 [−3.71, −1.95] | MSC vs UC/AF | .7 |
| UC/AF | 1 | −3.62 [−7.07, −0.18] | — | — |
| Blood anti‐inflammation | — | |||
| MSC | 2 | 0.99 [0.33, 1.64] | — | — |
| Kidney pro‐inflammation | — | |||
| MSC | 9 | −3.27 [−4.80, −1.74] | — | — |
| UC/AF | — | MSC vs Non‐MSC | .05 | |
| Non‐MSC | 1 | −1.22 [−2.60, 0.16] | — | — |
| Cell product | — | — | — | |
| Kidney anti‐inflammation | — | — | — | |
| MSC | 4 | 3.71 [1.65, 5.76] | — | — |
| — | — | — | ||
Note: Bold values are those that are statistically significant.
Abbreviations: CI, confidence interval; MSC, mesenchymal stem cells; Non‐MSC, other cells; SMD, standardized mean difference; UC/AF, umbilical cord/amniotic fluid cells; UCB, umbilical cord and amniotic fluid stem cells; WMD, weighted mean difference.
3.4.2. Cell tissue source
Cell tissue sources were grouped as BM, adipose, UC/AF, and other (liver, pancreas, urine, and dental pulp). For both creatinine and urea outcomes, BM and UC/AF induced greater reductions vs adipose (P ≤ .01; Table 3). Other sources failed to reduce creatinine. Urine protein reduction was greater with UC/AF compared to BM (P = .03) but not to other sources (P = .06). Other sources reduced pro‐fibrotic markers greater than BM (P = .03) and adipose (P = .009). No differences were observed between sources for inflammation outcomes. Collectively, various tissue sources had notable effects on kidney function (BM, UC/AF), urine protein (UC/AF), and fibrosis (other) outcomes.
TABLE 3.
Effect of treatment‐related factors: cell tissue source
| Cell tissue source | No. of articles | WMD/SMD [95% CI] | Comparison group | P value |
|---|---|---|---|---|
| Creatinine (mg/dL) | ||||
| BM | 9 | −0.39 [−0.47, −0.30] | BM vs Adipose | <.0001 |
| Adipose | 3 | −0.14 [−0.20, −0.09] | BM vs UC/AF | .7 |
| UC/AF | 6 | −0.35 [−0.56, −0.13] | BM vs Other | <.0001 |
| Other | 2 | −0.07 [−0.21, 0.07] | UC/AF vs Adipose | .07 |
| — | UC/AF vs Other | .04 | ||
| — | Adipose vs Other | .4 | ||
| Urea (mg/dL) | ||||
| BM | 9 | −30.99 [−46.17, −15.81] | BM vs Adipose | .01 |
| Adipose | 3 | −9.87 [−15.57, −4.18] | BM vs UC/AF | .2 |
| UC/AF | 4 | −44.16 [−57.08, −31.24] | BM vs Other | .2 |
| Other | 2 | −19.72 [−24.73, −14.70] | Adipose vs UC/AF | <.0001 |
| — | Adipose vs Other | .01 | ||
| — | Other vs UC/AF | .0005 | ||
| Urine protein | ||||
| BM | 20 | −2.54 [−3.135, −1.945] | BM vs UC/ AF | .03 |
| UC/AF | 4 | −8.32 [−13.57, −3.07] | BM vs Other | .06 |
| Other | 4 | −6.22 [−10.02, −2.42] | UC/AF vs Other | .5 |
| Fibrosis | ||||
| Pro‐fibrosis | ||||
| BM | 15 | −4.34 [−5.56, −3.12] | BM vs Adipose | .2 |
| Adipose | 2 | −2.86 [−4.64, −1.08] | BM vs UC/AF | 1.0 |
| UC/AF | 4 | −4.37 [−7.64, −1.09] | BM vs Other | .03 |
| Other | 2 | −9.61 [−14.32, −4.89] | UC/AF vs Adipose | .4 |
| — | UC/AF vs Other | .07 | ||
| — | Adipose vs Other | .009 | ||
| Antifibrosis | ||||
| BM | 2 | 6.84 [−4.02, 17.69] | BM vs UC/AF | .3 |
| UC/AF | 2 | 1.32 [0.49, 2.15] | — | — |
| Inflammation | ||||
| Blood pro‐inflammation | ||||
| BM | 3 | −2.46 [−3.36, −1.55] | BM vs Adipose | .4 |
| Adipose | 2 | −3.43 [−5.53, −1.33] | BM vs UC/AF | .5 |
| UC/AF | 1 | −3.62 [−7.07, −0.18] | Adipose vs UC/AF | .9 |
| Blood anti‐inflammation | ||||
| BM | 2 | 0.99 [0.33, 1.64] | — | — |
| Kidney pro‐inflammation | ||||
| BM | 8 | −3.33 [−5.03, −1.64] | BM vs Adipose | .9 |
| Adipose | 1 | −3.12 [−4.64, −1.61] | BM vs Kidney | .06 |
| Kidney | 1 | −1.22 [−2.60, 0.16] | Adipose vs Kidney | .07 |
| Kidney anti‐inflammation | ||||
| BM | 4 | 3.71 [1.65, 5.76] | — | — |
Note: Bold values are those that are statistically significant.
Abbreviations: BM, bone marrow; CI, confidence interval; SMD, standardized mean difference; UC/AF, umbilical cord/amniotic fluid; WMD, weighted mean difference.
3.4.3. Cell donor health
Healthy‐source cells exerted greater reductions on creatinine (P = .002), urea (P = .02), urine protein (P = .002), and kidney pro‐inflammatory markers (P = .05) (Table S11). Surprisingly, based on one study,50 disease‐source cells achieved a greater reduction in pro‐fibrotic markers vs healthy (P = .03).
3.4.4. Cell source species
Comparison of within‐species vs xenotransplantation revealed no differential effect between groups for creatinine, fibrosis, and inflammation outcomes. However, xenotransplantation was associated with greater reduction of urea (P < .0001) and urine protein (P = .03) compared to within‐species group.
3.4.5. Delivery route
Tail vein delivery was associated with greater reductions in creatinine (P ≤ .0001), urea (P < .0001) and greater improvement in kidney anti‐inflammatory markers (P ≤ .001) than other routes (Table S12). However, effects on urine protein, pro‐fibrotic, and pro‐inflammatory markers were not different. Interestingly, antifibrotic makers were increased greater with other (renal artery; n = 1)37 route (P < .0001) compared to tail vein.
3.4.6. Dosing regimen
Only pro‐fibrotic markers were blunted to a greater degree following multiple vs single dosing regimens (P = .03). Other kidney outcomes (creatinine [P = .7], urea [P = .08], urine protein [P = .7], pro‐inflammatory [P = .7 kidney; P = .06 blood], blood anti‐inflammatory markers [P = .9]) revealed no differential effects between dosing regimens.
3.4.7. Dose
Based on the low (<1.0 × 10⁵ cells/animal), medium (1.0 × 10⁵ to 1.0 × 10⁶), and high cell dose groupings (>1.0 × 10⁷), lower cell dose imparted stronger kidney fibrosis effects compared to the higher doses. Greater dose (≥1.0 × 10⁷ cells/animal) was associated with a larger reduction in urea (P = .04 vs Medium dose; Table S10), whereas lesser dose (<1.0 × 10⁷) and medium (1.0 × 10⁵ to 1.0 × 10⁶) reduced pro‐fibrotic markers more effectively (P = .01 and P < .001, respectively) compared to greater dose. No effect differences between groups were observed for creatinine, urine protein, or inflammation markers.
3.4.8. Outcome timing
A trend was observed for improved outcome effect of lowering serum creatinine (P = .06) at less than 4 weeks (early) compared to late (≥8 weeks). However, no effect difference between timing assessment was determined between early, medium (4‐7 weeks), or late (≥8 weeks) time points for urea or urine protein excretion. Profibrotic markers demonstrated a trend toward improved antifibrotic activity at late compared to medium outcome timing (P = .08).
3.4.9. Cell/animal manipulation
Analyses of “preconditioned” vs standard therapy revealed no differential effect for creatinine (P = .07), urea (P = .8), urine protein (P = .9), pro‐fibrosis (P = .2), or blood pro‐inflammatory markers (P = .3). Nevertheless, preconditioning improved pro‐inflammatory (n = 1; P = .02) and anti‐inflammatory kidney markers (n = 2) (P = .05) compared to standard culture/administered groups.
3.5. Animal‐related factors affecting kidney outcomes
3.5.1. Animal type
Studies in rats were associated with greater creatinine reduction compared to mice (P = .004) or tree shrews (n = 1; P < .0001) (Table S13). Rats also had greater urea reduction compared to tree shrews (P = .009) but not mice (P = .3). Urine protein reduction was greater in rats compared to mice (P = .003) but not tree shrews (P = .1). Minimal group differences were found in fibrosis and inflammatory outcomes.
3.5.2. Animal sex
Subgroup analyses yielded no significant effect differences in kidney outcomes between male and female animals (P ≥ .2 for all).
3.5.3. Diabetes model
STZ (type 1 diabetes) was associated with greater reduction in creatinine and urea than db/db (P ≤ .0001) or diet (n = 1; P < .0001) models (Table S14). No effect differences were noted between STZ and db/db models for fibrosis (P = .8) or pro‐inflammation (blood P = .3; kidney P = .07) outcomes.
3.5.4. Rescue vs prevention timing
Prevention therapy more effectively reduced urine protein (P = .03). Yet, rescue therapy more effectively reduced pro‐fibrotic markers (P ≤ .0001). There were no effect differences between groups for creatinine (P = .8), urea (P = .6), or antifibrosis (P = .1) outcomes.
3.6. Quality
Quality assessment of all 40 studies was performed using 15 parameters (Figure S4 ). Ten studies were of high quality (>70% parameters with “yes” response) and none were of low quality (<50% with “yes” responses). Notably, few (10%) studies reported animal baseline characteristics. There was uncertainty as to whether allocation of animals, dropouts, blinding of investigators, and outcome assessors were used for ≥87.5% of the studies. Random allocation of animals was reported in 67.5% of studies. Most studies sufficiently reported data to allow for meta‐analyses and potential replication of interventions.
3.7. Risk of bias
Risk of bias assessment was performed with 10 parameters (Figure S5). Risk of bias was low for selection, reporting, and other sources of bias. The most notable limitations were in performance, detection, and attrition bias primarily due to a lack of studies reporting methodology.
3.8. Publication bias
Publication bias was evaluated for plasma creatinine, a primary outcome (Figure S6), which did not demonstrate publication bias (P = .85 for Egger's test). However, in the presence of heterogeneity, the statistical assessment of publication bias is unreliable.
4. DISCUSSION
4.1. Main findings
This systematic review and meta‐analysis of 40 studies demonstrated that cell‐based therapy effectively improves kidney function and reduces clinical, serologic, and histologic markers associated with DKD pathogenesis and progression while promoting repair in diabetic animals. Subgroup analyses compared the effects of varying cell types, tissue and host sources, doses, preconditioning methods, and delivery routes in DKD treatment. Notably, MSC and UC/AF cells appear particularly effective in improving kidney function (creatinine, urea), while cell‐derived products (extracellular vesicles [EV] and conditioned medium) achieved a more robust decrease in pro‐fibrotic marker expression than cell groups. Furthermore, BM and UC/AF sources more effectively improved kidney function and proteinuria compared to adipose and other tissue sources. Collectively, these findings may inform design of future experiments in animals and optimize therapeutic strategies for translation to clinical trials for DKD.
In this meta‐analysis, five primary outcomes (creatinine, urea, proteinuria, fibrosis, and inflammation) were ascertained. Yet, other surrogate markers of the complex pathogenesis involved in DKD such as histology (glomerular and mesangial alterations), BP, oxidative stress, apoptosis, and EMT were also captured. In DKD, high systemic glucose is a major inducer of oxidative stress generation,62 pro‐fibrotic pathway activation,63 and podocyte dysfunction and apoptosis.64, 65, 66 Activation of the renin‐angiotensin‐aldosterone system increases BP,67, 68 promotes inflammation (TNF‐α),69 and activates pro‐fibrotic (TGF‐β) pathways,70, 71, 72 including EMT in DKD. These processes result in classic histologic DKD kidney changes in humans and animals such as glomerulomegaly,73 glomerulosclerosis, and mesangial expansion74 that closely associate with DKD progression.75 Summarily, kidney fibrosis, fueled by maladaptive inflammation, represents a common final pathway of all chronic kidney disease (CKD).76, 77 Each of these pathways were captured in the current meta‐analysis which also emphasized effects on individual markers of injury (TGF‐β, collagen I, fibronectin, reactive oxidative species, TNF‐α, macrophage, and leucocyte infiltration) and repair (E‐cadherin, superoxide dismutase, IL‐10). This evidence synthesis suggested that cell‐based therapy substantially improved injury while simultaneously promoting pro‐repair activities in the kidney, blood, and urine in animals, therein targeting multiple pathogenic pathways in DKD.
4.2. Effects of animal‐ and treatment‐related factors
Given lack of consensus for the most optimal cell type/product or therapy regimen in DKD, our subgroup analyses assessed how the choice of diabetes models and cell regimens influenced kidney outcomes. Among animal‐related factors, rats (most used) offer an advantage over mice for kidney function and proteinuria outcome effects. Despite concerns that female rodents exhibit less proteinuria,78, 79 no sex‐related differences were observed for this or other outcomes. STZ‐induced diabetes (the primary model in rats) appeared to be advantageous for detecting kidney function effects though no between‐group differences (STZ vs db/db or diet models) were found for proteinuria, fibrosis, or inflammation outcomes. Thus, despite concern for potential off‐target STZ exposure effects,80, 81 cell‐based therapy in STZ‐rats appear particularly informative while other animals and diabetes models (type 2) also offer insightful findings.
There is still much to be uncovered in the optimization of cell manufacture and delivery for DKD therapy. While MSC represent the most widely studied cells in DKD,82 the current meta‐analysis shows that other cell types may have equal effect in improving kidney outcomes. UC/AF cells reduced creatinine, fibrosis, and inflammation like MSC and to greater degree than non‐MSC. UC/AF cells also reduced proteinuria greater than MSC. Surprisingly, cell‐derived products were superior for antifibrosis outcomes compared to other cells, despite a limited number of studies. For cell tissue source, BM (most popular) and UC/AF emerged as strong effect modifiers. These findings are particularly relevant given the need for economic considerations.83 UC/AF represents an optimal source tissue for cell/product harvest given the accessibility ease and low harvest costs.7, 36, 84, 85, 86, 87 Only one study directly compared the effectiveness of products (conditioned medium) to MSC,42 and none compared UC/AF to MSC in DKD animals. Finally, processing methods including cell passage number, supplements or growth factors, and fresh vs cryopreserved cells were summarized when available but may influence repair efficiency. Thus, future studies may be warranted to definitively answer superiority of cells vs products and cell tissue source for DKD therapy.
We and others examined efficacy of various cell delivery routes and doses in animal models of CKD.6, 18, 35, 49, 88, 89 In this meta‐analysis, tail vein (70% of studies) was most effective at reducing kidney function outcomes, but antifibrotic factors were more effectively reduced by renal arterial delivery in a single study.37 Prior meta‐analyses yielded differing conclusions when comparing systemic/peripheral to intra‐arterial delivery. While Papazova et al6 found no consistent advantage in small and large animals, Wang et al38 deduced that intra‐arterial delivery more effectively improved outcomes in small animal models of CKD. Higher cell doses have also been tested in recent years, in this meta‐analysis, the higher dose more effectively reduced urea levels but no difference was found in creatinine or urine protein excretion, implying that kidney function is not fully influenced by higher doses. Interestingly, the lower cell dose more effectively reduced fibrosis compared to medium and high cell doses suggesting that greater cell doses are not essential for renal repair in DKD. Several studies have demonstrated the importance of various secreted antifibrotic factors such as HGF and bone morphogenetic protein‐7 (BMP‐7).29, 90, 91 In diabetic kidney models, HGF reduced kidney fibrosis through blockade of tubular epithelial cell EMT90 and inhibition of MCP‐1 expression, therein reducing kidney macrophage infiltration.29 Intuitively, repeat cell dose increases the exposure time of cells/product, but this meta‐analysis identified only pro‐fibrotic markers to be more improved with a multiple dosing regimen.
Other findings in xenotransplant and disease‐source therapy are also noteworthy. Uniquely, the low immunogenic properties of MSC and other cells/products permitted successful studies in xenotransplantation92, 93, 94, 95 Interestingly, xenotransplantation yielded greater reduction in urea and proteinuria compared to the within‐species groups. Our study also determined that disease‐source cells sufficiently induced renal repair.45 Specifically, Zhang et al50 found that disease‐source compared to healthy early outgrowth BM cells were equally effective in reducing glomerular/interstitial fibrosis and oxidative stress. Fang et al4 determined that disease‐source MSC inhibited oxidative stress, pro‐inflammatory gene expression, and MAPK signaling, a regulator of inflammation, pathway activation. These and other studies provide insightful direction as cell‐based therapy is tested in multiple diseases and autologous therapy is entertained.
Given the harsh, DKD microenvironment cells/products encounter after infusion, development of methods to improve delivery and maintain vitality are necessary. In this meta‐analysis, preconditioning and other cell/animal manipulations of either disease‐source or healthy cells had a robust effect on pro‐inflammatory and anti‐inflammatory profiles compared to standard treated groups. Moreover, in these studies, preconditioning improved the health of disease cells to comparable efficacy of healthy cells. These findings again support testing of autologous therapy regimens.
For quality assessments, most of the studies were of high quality, no articles were of low quality, and bias risk was low, likely due to the exclusion criteria employed. However, there is room for improvement in reporting/implementing such as random allocation and animal housing that may skew results when measuring outcome parameters.
4.3. Limitations and strengths
Some limitations exist. To date, current models of DKD parallel only early features of human DKD therein limiting translation.80, 81, 96 However, outcomes assessed in this meta‐analysis incorporated markers that are characteristics of advanced human DKD (proteinuria, glomerular/mesangial histology changes, fibrosis, and kidney function).96 Additionally, like other studies, this meta‐analysis was conducted in the setting of substantial heterogeneity. Wang et al38 found heterogeneity in creatinine outcome to be independently associated with differences in measurement time point and cell therapy delivery route, which cannot be altered. Nonetheless, in the current meta‐analysis, beneficial effects of cell‐based therapy were consistently shown with 95% CIs frequently overlapping and supporting the findings. Furthermore, use of random‐effect analysis limited the risk of reporting erroneous estimates. The strengths of this meta‐analysis relate to the comprehensive literature search and independent reviews for study selection and appraisal. Study findings expand upon initial evidence synthesis attempts in DKD16 and CKD6, 38 animals and offer the advantage of including recent, within the last decade, investigations when the regenerative field in DKD has substantially grown.
5. CONCLUSION
In conclusion, this systematic review and meta‐analysis provide insurmountable evidence for the efficacy of cell‐based therapy in experimental animal models of DKD. Cell‐based therapy improved functional and structural outcomes inherent in DKD pathogenesis and progression for which treatment‐related factors further modified this effect. These quantitatively summarized preclinical findings can help guide therapy selection and delivery strategies to aid in successful translation of findings to clinical trials.
CONFLICT OF INTEREST
L.O.L. received grant funding from Novo Nordisk and is an advisor to Weijian Technologies and AstraZeneca. All other authors declared no financial conflicts of interest.
AUTHOR CONTRIBUTIONS
L.J.H.: designed the study, carried out the reviews, analyzed the data, created figures, drafted and revised the paper, critically reviewed and edited the paper; G.B.‐B.: carried out the reviews, abstracted data, analyzed the data, created figures, drafted and revised the paper, critically reviewed and edited the paper; X.B.: carried out the reviews, abstracted data, critically reviewed and edited the paper; T.A.: carried out the reviews, abstracted data, analyzed the data, drafted and revised the paper, critically reviewed and edited the paper; J.M.M.: carried out the reviews, drafted and revised the paper, critically reviewed and edited the paper; S.M.C., X.Z., S.M.H., A.K.: carried out the reviews, critically reviewed and edited the paper; J.M.M.: abstracted data, analyzed the data; M.H.M.: analyzed the data, drafted and revised the paper, critically reviewed and edited the paper; E.C.L., S.R.K., B.T., L.O.L.: critically reviewed and edited the paper; All authors approved the final version of the manuscript.
Supporting information
Table S1 Study Characteristics (n = 40)
Table S2. Studies with preconditioning, cell and/or animal manipulations for optimization of cell‐based therapy in DKD
Table S3. Abstracted individual markers of kidney injury and repair measured after cell‐based therapy in animal models of DKD
Table S4. Serum Creatinine: Subgroup Analyses of Animal‐ and Cell‐Related Factor Effect
Table S5. Serum Urea: Subgroup Analyses of Animal‐ and Cell‐Related Factor Effect
Table S6. Urine Protein Excretion: Subgroup Analyses of Animal‐ and Cell‐Related Factor Effect
Table S7. Kidney fibrosis: Subgroup Analyses of Animal‐ and Cell‐Related Factor Effect
Table S8. Pro‐ and Anti‐Inflammatory Markers in Kidney: Subgroup Analyses of Animal‐ and Cell‐Related Factor Effect
Table S9. Pro‐ and Anti‐Inflammatory Markers in Blood: Subgroup Analyses of Animal‐ and Cell‐Related Factor Effect
Table S10. Effect of treatment‐related factors: Cell dose, total
Table S11. Effect of treatment‐related factors: Cell source health
Table S12. Effect of treatment‐related factors: Cell delivery route
Table S13. Effect of animal‐related factors: Animal type
Table S14. Effect of animal‐related factors: Diabetes model
Figure S1. Effect of cell‐based therapy on serum creatinine in animal models of DKD
Figure S2. Effect of cell‐based therapy on urine protein excretion in animal models of DKD
Figure S3. Effect of cell‐based therapy on markers of fibrosis in animal models of DKD
Figure S4. Quality Assessment
Figure S5. Risk of Bias Assessment
Figure S6. Funnel plot of serum creatinine for publication bias analysis
Material S1: Database Queries (Examples)
Material S2: Articles included in meta‐analysis of cell‐based therapy in animal models of DKD
Figure S1 . Effect of cell‐based therapy on serum creatinine in animal models of DKD
Forest plot displays changes in serum creatinine (mg/dl) following cell/cell product administration in animals with diabetes. Data are displayed as weighted mean difference (WMD) and 95% confidence intervals (CI). Weights are from random effects analysis. Abbreviations: DKD: diabetic kidney disease; MSC: Mesenchymal stem cell, MSC‐EV: MSC‐derived exosomes or extracellular vesicles, AFSC: Amniotic fluid stem cells, HUCB‐SC: Human umbilical cord blood‐derived mononuclear cells, HLSC‐EV: Human‐liver stem‐like cells, SRC: selected renal cells, Ad: Adipose, BM: Bone Marrow, UC: Umbilical Cord, AF: Amniotic fluid, Liv: Liver, Kid: Kidney
Figure S2 . Effect of cell‐based therapy on urine protein excretion in animal models of DKD
Forest plot displays changes in urine protein excretion following cell or cell product administration to animals with diabetes. Data are displayed as weighted mean difference (WMD) and 95% confidence intervals (CI). Weights are from random effects analysis. Abbreviations: DKD: diabetic kidney disease; MSC: Mesenchymal stem cell, MSC‐EV: MSC‐derived exosomes or extracellular vesicles, HUCB‐SC: Human umbilical cord blood‐derived mononuclear cells, USC‐EV: Urine‐derived stem cells, HLSC‐EV: Human‐liver stem‐like cells, Panc FPC: Pancreatic progenitor (fetal) cells, DPSC=Dental pulp stem cells, MSC‐hUCB=Human umbilical cord blood‐derived mesenchymal cells, BM: Bone Marrow, UC: Umbilical Cord, Liv: Liver, Panc: Pancreas, DP: Dental pulp, UC: Umbilical cord
Figure S3 . Effect of cell‐based therapy on markers of fibrosis in animal models of DKD
Forest plot displays changes in fibrosis markers following cell or cell product administration to animals with diabetes. Data are displayed as standardized mean difference (SMD) and 95% confidence intervals (CI). Abbreviations: MSC: Mesenchymal stem cell, MSC‐EV: MSC‐derived exosomes or extracellular vesicles, AFSC: Amniotic fluid stem cells, HUCB‐SC: Human umbilical cord blood‐derived mononuclear cells, EoBMC: Early outgrowth bone marrow cells, HLSC‐EV: Human‐liver stem‐like cells, MDSC = Myeloid‐derived suppressor cells, MSC‐BM‐EV: Bone marrow‐derived mesenchymal stem cell extracellular vesicles, MSC‐hUCB=Human umbilical cord blood‐derived mesenchymal cells, Panc FPC: Pancreatic progenitor (fetal) cells, Ad: Adipose, BM: Bone Marrow, UC: Umbilical Cord, AF: Amniotic fluid, Liv: Liver, Panc: Pancreas
Figure S4 . Quality assessment
Quality assessment parameters were reviewed for 40 articles (Y‐axis). Each parameter was rated as Yes, Partly, No or N/A (not applicable). For each parameter, the X‐axis shows the distribution (or percentage) of articles within the 4 ratings. Most studies sufficiently reported data to allow for meta‐analysis conduct and potential replication of interventions.
Figure S5 . Risk of bias assessment
Bias assessment parameters were reviewed for 40 articles (Y‐axis). Each parameter was rated as Low, Unclear or High risk of bias. For each parameter, the X‐axis shows the distribution (or percentage) of articles within the 3 bias ratings. Risk of bias was low or unclear for most parameters. A higher risk of bias was detected in the areas of random housing (performance bias).
Figure S6 . Funnel plot of serum creatinine for publication bias analysis
The distribution of weighted mean differences (WMD) is shown for articles examining the effect of cell‐based therapy on serum creatinine. A funnel plot with pseudo 95% confidence limits is shown. Visual examination of the funnel plot revealed no publication bias. Data are shown as WMD in mg/dl and 95% confidence intervals (CI).
ACKNOWLEDGMENTS
The authors thank Patricia J. Erwin, MLS (multi‐database literature search); Shane A. Bobart, MD (literature search), Donna K. Lawson, CCRP, LPN (database maintenance), Cody C. Gowan (cell processing reviews), and Shannon Meier (secretarial support). L.J.H. takes full responsibility for the work. This project was supported by funding from Regenerative Medicine Minnesota RMM 091718CT (L.J.H.), Mayo Clinic Florida Center for Regenerative Medicine (L.J.H.), National Institutes of Health (NIH) grants DK109134 and DK123492 (L.J.H.), NIDDK Diabetes Complications Consortium (RRID:SCR‐001415; DK076169, DK115255); UL1 TR002377 (L.J.H.; Mayo Clinic CCaTS UL1TR002377; REDCap), and the Mayo Clinic Robert D. and Patricia E. Kern Center for the Science of Health Care Delivery (L.J.H.). Additional support was provided by NIH grants DK102325 (LOL), DK07013 (SMC), Burroughs Wellcome Fund (SMC); DK118120 (SMH); DK101405 (nuSURF: Mayo; J.M.M.; G.B.B.). Summer Program for International Research Internship Training (SPIRIT) Alfaisal University, Riyadh, Saudi Arabia (AT). Publication content is solely the responsibility of the authors and does not necessarily represent the official views of Satellite Healthcare, Regenerative Medicine Minnesota, or the NIH.
Hickson LJ, Abedalqader T, Ben‐Bernard G, et al. A systematic review and meta‐analysis of cell‐based interventions in experimental diabetic kidney disease. STEM CELLS Transl Med. 2021;10(9):1304–1319. 10.1002/sctm.19-0419
Funding information Burroughs Wellcome Fund; Mayo Clinic Robert D. and Patricia E. Kern Center for the Science of Health Care Delivery; Mayo Clinic CCaTS, Grant/Award Number: UL1TR002377; NIDDK Diabetes Complications Consortium, Grant/Award Numbers: DK115255, DK076169; National Institutes of Health (NIH), Grant/Award Numbers: DK101405, DK118120, DK07013, DK102325, DK123492, DK109134; Mayo Clinic Florida Center for Regenerative Medicine; Regenerative Medicine Minnesota, Grant/Award Number: RMM 091718CT
DATA AVAILABILITY STATEMENT
Data relevant to the study are included in the article or uploaded as Supporting Information.
REFERENCES
- 1.Saran R, Robinson B, Abbott KC, et al. US renal data system 2017 annual data report: epidemiology of kidney disease in the United States. Am J Kidney Dis. 2018;71(3 suppl 1):A7. [DOI] [PMC free article] [PubMed] [Google Scholar]
- 2.Ezquer F, Ezquer M, Simon V, et al. Endovenous administration of bone‐marrow‐derived multipotent mesenchymal stromal cells prevents renal failure in diabetic mice. Biol Blood Marrow Transplant. 2009;15(11):1354‐1365. [DOI] [PubMed] [Google Scholar]
- 3.Ezquer FE, Ezquer ME, Parrau DB, Carpio D, Yanez AJ, Conget PA. Systemic administration of multipotent mesenchymal stromal cells reverts hyperglycemia and prevents nephropathy in type 1 diabetic mice. Biol Blood Marrow Transplant. 2008;14(6):631‐640. [DOI] [PubMed] [Google Scholar]
- 4.Fang Y, Tian X, Bai S, et al. Autologous transplantation of adipose‐derived mesenchymal stem cells ameliorates streptozotocin‐induced diabetic nephropathy in rats by inhibiting oxidative stress, pro‐inflammatorycytokines and the p38 MAPK signaling pathway. Int J Mol Med. 2012;30(1):85‐92. [DOI] [PubMed] [Google Scholar]
- 5.Pan XH, Yang XY, Yao X, et al. Bone‐marrow mesenchymal stem cell transplantation to treat diabetic nephropathy in tree shrews. Cell Biochem Funct. 2014;32(5):453‐463. [DOI] [PubMed] [Google Scholar]
- 6.Papazova DA, Oosterhuis NR, Gremmels H, van Koppen A, Joles JA, Verhaar MC. Cell‐based therapies for experimental chronic kidney disease: a systematic review and meta‐analysis. Dis Model Mech. 2015;8(3):281‐293. [DOI] [PMC free article] [PubMed] [Google Scholar]
- 7.Park JH, Hwang I, Hwang SH, Han H, Ha H. Human umbilical cord blood‐derived mesenchymal stem cells prevent diabetic renal injury through paracrine action. Diabetes Res Clin Pract. 2012;98(3):465‐473. [DOI] [PubMed] [Google Scholar]
- 8.Weiss ARR, Dahlke MH. Immunomodulation by mesenchymal stem cells (MSCs): mechanisms of action of living, apoptotic, and dead MSCs. Front Immunol. 2019;10:1–10. [DOI] [PMC free article] [PubMed] [Google Scholar]
- 9.Galleu A, Riffo‐Vasquez Y, Trento C, et al. Apoptosis in mesenchymal stromal cells induces in vivo recipient‐mediated immunomodulation. Sci Transl Med. 2017;9(416):eaam7828. [DOI] [PubMed] [Google Scholar]
- 10.Hickson LJ, Herrmann SM, McNicholas BA, Griffin MD. Progress toward the clinical application of mesenchymal stromal cells and other disease‐modulating regenerative therapies. Kidney360. 2021;2(1):542–557. [DOI] [PMC free article] [PubMed] [Google Scholar]
- 11.Hickson LJ, Eirin A, Lerman LO. Challenges and opportunities for stem cell therapy in patients with chronic kidney disease. Kidney Int. 2016;89(4):767‐778. [DOI] [PMC free article] [PubMed] [Google Scholar]
- 12.Sattwika PD, Mustafa R, Paramaiswari A, Herningtyas EH. Stem cells for lupus nephritis: a concise review of current knowledge. Lupus. 2018;27(12):1881‐1897. [DOI] [PubMed] [Google Scholar]
- 13.Ruhle A, Huber PE, Saffrich R, Lopez Perez R, Nicolay NH. The current understanding of mesenchymal stem cells as potential attenuators of chemotherapy‐induced toxicity. Int J Cancer. 2018;143(11):2628‐2639. [DOI] [PubMed] [Google Scholar]
- 14.Hamza AH, Al‐Bishri WM, Damiati LA, Ahmed HH. Mesenchymal stem cells: a future experimental exploration for recession of diabetic nephropathy. Ren Fail. 2017;39(1):67‐76. [DOI] [PMC free article] [PubMed] [Google Scholar]
- 15.Lang H, Dai C. Effects of bone marrow mesenchymal stem cells on plasminogen activator inhibitor‐1 and renal fibrosis in rats with diabetic nephropathy. Arch Med Res. 2016;47(2):71‐77. [DOI] [PubMed] [Google Scholar]
- 16.Tang HJ, Tian ZG, Yang X, Cao Y, Li WG. Cell‐based therapies for experimental diabetic nephropathy: a systematic review and meta‐analysis. J Biol Regul Homeost Agents. 2016;30(4):1047‐1051. [PubMed] [Google Scholar]
- 17.Ezquer F, Giraud‐Billoud M, Carpio D, Cabezas F, Conget P, Ezquer M. Proregenerative microenvironment triggered by donor mesenchymal stem cells preserves renal function and structure in mice with severe diabetes mellitus. Biomed Res Int. 2015;2015:164703. [DOI] [PMC free article] [PubMed] [Google Scholar]
- 18.Lee KW, Kim TM, Kim KS, et al. Renal ischemia‐reperfusion injury in a diabetic monkey model and therapeutic testing of human bone marrow‐derived mesenchymal stem cells. J Diabetes Res. 2018;2018:5182606. [DOI] [PMC free article] [PubMed] [Google Scholar]
- 19.Ni W, Fang Y, Xie L, et al. Adipose‐derived mesenchymal stem cells transplantation alleviates renal injury in streptozotocin‐induced diabetic nephropathy. J Histochem Cytochem. 2015;63(11):842‐853. [DOI] [PMC free article] [PubMed] [Google Scholar]
- 20.Paulini J, Higuti E, Bastos RM, Gomes SA, Rangel EB. Mesenchymal stem cells as therapeutic candidates for halting the progression of diabetic nephropathy. Stem Cells Int. 2016;2016:9521629. [DOI] [PMC free article] [PubMed] [Google Scholar]
- 21.Tang Q, Wu H, Lei J, et al. HIF1α deletion facilitates adipose stem cells to repair renal fibrosis in diabetic mice. In Vitro Cell Dev Biol Anim. 2018;54(4):272‐286. [DOI] [PubMed] [Google Scholar]
- 22.Zhong L, Liao G, Wang X, et al. Mesenchymal stem cells‐microvesicle‐miR‐451a ameliorate early diabetic kidney injury by negative regulation of P15 and P19. Exp Biol Med. 2018;243(15‐16):1233‐1242. [DOI] [PMC free article] [PubMed] [Google Scholar]
- 23.Packham DK, Fraser IR, Kerr PG, Segal KR. Allogeneic mesenchymal precursor cells (MPC) in diabetic nephropathy: a randomized, placebo‐controlled, dose escalation study. EBioMedicine. 2016;12:263‐269. [DOI] [PMC free article] [PubMed] [Google Scholar]
- 24.Griffin TP, Martin WP, Islam N, O'Brien T, Griffin MD. The promise of mesenchymal stem cell therapy for diabetic kidney disease. Curr Diab Rep. 2016;16(5):42. [DOI] [PubMed] [Google Scholar]
- 25.Bai Y, Wang J, He Z, Yang M, Li L, Jiang H. Mesenchymal stem cells reverse diabetic nephropathy disease via lipoxin A4 by targeting transforming growth factor beta (TGF‐beta)/smad pathway and pro‐inflammatory cytokines. Med Sci Monit. 2019;25:3069‐3076. [DOI] [PMC free article] [PubMed] [Google Scholar]
- 26.Lee RH, Seo MJ, Reger RL, et al. Multipotent stromal cells from human marrow home to and promote repair of pancreatic islets and renal glomeruli in diabetic NOD/scid mice. Proc Natl Acad Sci USA. 2006;103(46):17438‐17443. [DOI] [PMC free article] [PubMed] [Google Scholar]
- 27.Li H, Rong P, Ma X, et al. Paracrine effect of mesenchymal stem cell as a novel therapeutic strategy for diabetic nephropathy. Life Sci. 2018;215:113‐118. [DOI] [PubMed] [Google Scholar]
- 28.Lv S, Liu G, Sun A, et al. Mesenchymal stem cells ameliorate diabetic glomerular fibrosis in vivo and in vitro by inhibiting TGF‐beta signalling via secretion of bone morphogenetic protein 7. Diab Vasc Dis Res. 2014;11(4):251‐261. [DOI] [PubMed] [Google Scholar]
- 29.Lv SS, Liu G, Wang JP, et al. Mesenchymal stem cells transplantation ameliorates glomerular injury in streptozotocin‐induced diabetic nephropathy in rats via inhibiting macrophage infiltration. Int Immunopharmacol. 2013;17(2):275‐282. [DOI] [PubMed] [Google Scholar]
- 30.Zhang L, Li K, Liu X, et al. Repeated systemic administration of human adipose‐derived stem cells attenuates overt diabetic nephropathy in rats. Stem Cells Dev. 2013;22(23):3074‐3086. [DOI] [PMC free article] [PubMed] [Google Scholar]
- 31.Castiglione RC, Maron‐Gutierrez T, Barbosa CML, et al. Bone marrow‐derived mononuclear cells promote improvement in glomerular function in rats with early diabetic nephropathy. Cell Physiol Biochem. 2013;32(3):699‐718. [DOI] [PubMed] [Google Scholar]
- 32.Feng J, Lu C, Dai Q, Sheng J, Xu M. SIRT3 facilitates amniotic fluid stem cells to repair diabetic nephropathy through protecting mitochondrial homeostasis by modulation of mitophagy. Cell Physiol Biochem. 2018;46(4):1508‐1524. [DOI] [PubMed] [Google Scholar]
- 33.Guimaraes ET, Cruz Gda S, Almeida TF, et al. Transplantation of stem cells obtained from murine dental pulp improves pancreatic damage, renal function, and painful diabetic neuropathy in diabetic type 1 mouse model. Cell Transplant. 2013;22(12):2345‐2354. [DOI] [PubMed] [Google Scholar]
- 34.Hsieh CC, Lin CL, He JT, et al. Administration of cytokine‐induced myeloid‐derived suppressor cells ameliorates renal fibrosis in diabetic mice. Stem Cell Res Ther. 2018;9(1):183. [DOI] [PMC free article] [PubMed] [Google Scholar]
- 35.Kelley R, Bruce A, Spencer T, et al. A population of selected renal cells augments renal function and extends survival in the ZSF1 model of progressive diabetic nephropathy. Cell Transplant. 2013;22(6):1023‐1039. [DOI] [PubMed] [Google Scholar]
- 36.Maldonado M, Huang TH, Yang L, Xu L, Ma L. Human umbilical cord Wharton jelly cells promote extra‐pancreatic insulin formation and repair of renal damage in STZ‐induced diabetic mice. Cell Commun Signal. 2017;15:43. [DOI] [PMC free article] [PubMed] [Google Scholar]
- 37.Wang S, Li Y, Zhao J, Zhang J, Huang Y. Mesenchymal stem cells ameliorate podocyte injury and proteinuria in a type 1 diabetic nephropathy rat model. Biol Blood Marrow Transplant. 2013;19(4):538‐546. [DOI] [PubMed] [Google Scholar]
- 38.Wang Y, He J, Pei X, Zhao W. Systematic review and meta‐analysis of mesenchymal stem/stromal cells therapy for impaired renal function in small animal models. Nephrology. 2013;18(3):201‐208. [DOI] [PubMed] [Google Scholar]
- 39.Ebrahim N, Ahmed IA, Hussien NI, et al. Mesenchymal stem cell‐derived exosomes ameliorated diabetic nephropathy by autophagy induction through the mTOR signaling pathway. Cell. 2018;7(12):226. [DOI] [PMC free article] [PubMed] [Google Scholar]
- 40.Grange C, Tritta S, Tapparo M, et al. Stem cell‐derived extracellular vesicles inhibit and revert fibrosis progression in a mouse model of diabetic nephropathy. Sci Rep. 2019;9(1):4468. [DOI] [PMC free article] [PubMed] [Google Scholar]
- 41.Jiang ZZ, Liu YM, Niu X, et al. Exosomes secreted by human urine‐derived stem cells could prevent kidney complications from type I diabetes in rats. Stem Cell Res Ther. 2016;7:24. [DOI] [PMC free article] [PubMed] [Google Scholar]
- 42.Nagaishi K, Mizue Y, Chikenji T, et al. Mesenchymal stem cell therapy ameliorates diabetic nephropathy via the paracrine effect of renal trophic factors including exosomes. Sci Rep. 2016;6:34842. [DOI] [PMC free article] [PubMed] [Google Scholar]
- 43.Kornicka K, Houston J, Marycz K. Dysfunction of mesenchymal stem cells isolated from metabolic syndrome and type 2 diabetic patients as result of oxidative stress and autophagy may limit their potential therapeutic use. Stem Cell Rev Rep. 2018;14(3):337‐345. [DOI] [PMC free article] [PubMed] [Google Scholar]
- 44.van de Vyver M. Intrinsic mesenchymal stem cell dysfunction in diabetes mellitus: implications for autologous cell therapy. Stem Cells Dev. 2017;26(14):1042‐1053. [DOI] [PubMed] [Google Scholar]
- 45.Hickson LJ, Eirin A, Conley SM, et al. Diabetic kidney disease alters the transcriptome and function of human adipose‐derived mesenchymal stromal cells but maintains immunomodulatory and paracrine activities important for renal repair. Diabetes. 2021. 10.2337/db19-1268. Epub ahead of print. PMID: 33858824. [DOI] [PMC free article] [PubMed] [Google Scholar]
- 46.Nagaishi K, Mizue Y, Chikenji T, et al. Umbilical cord extracts improve diabetic abnormalities in bone marrow‐derived mesenchymal stem cells and increase their therapeutic effects on diabetic nephropathy. Sci Rep. 2017;7(1):8484. [DOI] [PMC free article] [PubMed] [Google Scholar]
- 47.Rashed LA, Elattar S, Eltablawy N, Ashour H, Mahmoud LM, El‐Esawy Y. Mesenchymal stem cells pretreated with melatonin ameliorate kidney functions in a rat model of diabetic nephropathy. Biochem Cell Biol. 2018;96(5):564‐571. [DOI] [PubMed] [Google Scholar]
- 48.Sun J, Zhao F, Zhang W, Lv J, Yin A. BMSCs and miR‐124a ameliorated diabetic nephropathy via inhibiting notch signalling pathway. J Cell Mol Med. 2018;22(10):4840‐4855. [DOI] [PMC free article] [PubMed] [Google Scholar]
- 49.Zhang Y, Ye C, Wang G, et al. Kidney‐targeted transplantation of mesenchymal stem cells by ultrasound‐targeted microbubble destruction promotes kidney repair in diabetic nephropathy rats. Biomed Res Int. 2013;2013:526367. [DOI] [PMC free article] [PubMed] [Google Scholar]
- 50.Zhang Y, Yuen DA, Advani A, et al. Early‐outgrowth bone marrow cells attenuate renal injury and dysfunction via an antioxidant effect in a mouse model of type 2 diabetes. Diabetes. 2012;61(8):2114‐2125. [DOI] [PMC free article] [PubMed] [Google Scholar]
- 51.Zhou H, Tian HM, Long Y, et al. Mesenchymal stem cells transplantation mildly ameliorates experimental diabetic nephropathy in rats. Chin Med J. 2009;122(21):2573‐2579. [PubMed] [Google Scholar]
- 52.Dominici M, Le Blanc K, Mueller I, et al. Minimal criteria for defining multipotent mesenchymal stromal cells. The International Society for Cellular Therapy position statement. Cytotherapy. 2006;8(4):315‐317. [DOI] [PubMed] [Google Scholar]
- 53.Wever KE, Menting TP, Rovers M, et al. Ischemic preconditioning in the animal kidney, a systematic review and meta‐analysis. PLoS One. 2012;7(2):e32296. [DOI] [PMC free article] [PubMed] [Google Scholar]
- 54.Hooijmans CR, Rovers MM, de Vries RB, Leenaars M, Ritskes‐Hoitinga M, Langendam MW. SYRCLE's risk of bias tool for animal studies. BMC Med Res Methodol. 2014;14:43. [DOI] [PMC free article] [PubMed] [Google Scholar]
- 55.Duval S, Tweedie R. Trim and fill: a simple funnel‐plot‐based method of testing and adjusting for publication bias in meta‐analysis. Biometrics. 2000;56(2):455‐463. [DOI] [PubMed] [Google Scholar]
- 56.Murad MH, Wang Z, Chu H, Lin L. When continuous outcomes are measured using different scales: guide for meta‐analysis and interpretation. BMJ. 2019;364:k4817. [DOI] [PMC free article] [PubMed] [Google Scholar]
- 57.DerSimonian R, Laird N. Meta‐analysis in clinical trials. Control Clin Trials. 1986;7(3):177‐188. [DOI] [PubMed] [Google Scholar]
- 58.Higgins JP, Thompson SG, Deeks JJ, Altman DG. Measuring inconsistency in meta‐analyses. BMJ. 2003;327(7414):557‐560. [DOI] [PMC free article] [PubMed] [Google Scholar]
- 59.Gan J, Wang Y, Zhou X. Stem cell transplantation for the treatment of patients with type 1 diabetes mellitus: a meta‐analysis. Exp Ther Med. 2018;16(6):4479‐4492. [DOI] [PMC free article] [PubMed] [Google Scholar]
- 60.Altman DG, Bland JM. Interaction revisited: the difference between two estimates. BMJ. 2003;326(7382):219. [DOI] [PMC free article] [PubMed] [Google Scholar]
- 61.Abdel Aziz MT, Wassef MA, Ahmed HH, et al. The role of bone marrow derived‐mesenchymal stem cells in attenuation of kidney function in rats with diabetic nephropathy. Diabetol Metab Syndr. 2014;6(1):34. [DOI] [PMC free article] [PubMed] [Google Scholar]
- 62.Jha JC, Gray SP, Barit D, et al. Genetic targeting or pharmacologic inhibition of NADPH oxidase nox4 provides renoprotection in long‐term diabetic nephropathy. J Am Soc Nephrol. 2014;25(6):1237‐1254. [DOI] [PMC free article] [PubMed] [Google Scholar]
- 63.He X, Zhang T, Tolosa M, et al. A new, easily generated mouse model of diabetic kidney fibrosis. Sci Rep. 2019;9(1):12549. [DOI] [PMC free article] [PubMed] [Google Scholar]
- 64.Pagtalunan ME, Miller PL, Jumping‐Eagle S, et al. Podocyte loss and progressive glomerular injury in type II diabetes. J Clin Invest. 1997;99(2):342‐348. [DOI] [PMC free article] [PubMed] [Google Scholar]
- 65.Toyoda M, Najafian B, Kim Y, Caramori ML, Mauer M. Podocyte detachment and reduced glomerular capillary endothelial fenestration in human type 1 diabetic nephropathy. Diabetes. 2007;56(8):2155‐2160. [DOI] [PubMed] [Google Scholar]
- 66.Weil EJ, Lemley KV, Mason CC, et al. Podocyte detachment and reduced glomerular capillary endothelial fenestration promote kidney disease in type 2 diabetic nephropathy. Kidney Int. 2012;82(9):1010‐1017. [DOI] [PMC free article] [PubMed] [Google Scholar]
- 67.Kelly DJ, Zhang Y, Moe G, Naik G, Gilbert RE. Aliskiren, a novel renin inhibitor, is renoprotective in a model of advanced diabetic nephropathy in rats. Diabetologia. 2007;50(11):2398‐2404. [DOI] [PubMed] [Google Scholar]
- 68.Harlan SM, Heinz‐Taheny KM, Sullivan JM, et al. Progressive renal disease established by renin‐coding adeno‐associated virus‐driven hypertension in diverse diabetic models. J Am Soc Nephrol. 2018;29(2):477‐491. [DOI] [PMC free article] [PubMed] [Google Scholar]
- 69.Heuer JG, Harlan SM, Yang DD, et al. Role of TGF‐alpha in the progression of diabetic kidney disease. Am J Physiol Renal Physiol. 2017;312(6):F951‐F962. [DOI] [PubMed] [Google Scholar]
- 70.Ziyadeh FN, Hoffman BB, Han DC, et al. Long‐term prevention of renal insufficiency, excess matrix gene expression, and glomerular mesangial matrix expansion by treatment with monoclonal antitransforming growth factor‐beta antibody in db/db diabetic mice. Proc Natl Acad Sci USA. 2000;97(14):8015‐8020. [DOI] [PMC free article] [PubMed] [Google Scholar]
- 71.Wang B, Koh P, Winbanks C, et al. miR‐200a prevents renal fibrogenesis through repression of TGF‐β2 expression. Diabetes. 2011;60(1):280‐287. [DOI] [PMC free article] [PubMed] [Google Scholar]
- 72.Xavier S, Vasko R, Matsumoto K, et al. Curtailing endothelial TGF‐β signaling is sufficient to reduce endothelial‐mesenchymal transition and fibrosis in CKD. J Am Soc Nephrol. 2015;26(4):817‐829. [DOI] [PMC free article] [PubMed] [Google Scholar]
- 73.Dong R, Yu J, Yu F, Yang S, Qian Q, Zha Y. IGF‐1/IGF‐1R blockade ameliorates diabetic kidney disease through normalizing Snail1 expression in a mouse model. Am J Physiol Endocrinol Metab. 2019;317(4):E686‐E698. [DOI] [PubMed] [Google Scholar]
- 74.Dai HY, Zheng M, Tang RN, et al. Effects of angiotensin receptor blocker on phenotypic alterations of podocytes in early diabetic nephropathy. Am J Med Sci. 2011;341(3):207‐214. [DOI] [PubMed] [Google Scholar]
- 75.Zhang H, Nair V, Saha J, et al. Podocyte‐specific JAK2 overexpression worsens diabetic kidney disease in mice. Kidney Int. 2017;92(4):909‐921. [DOI] [PMC free article] [PubMed] [Google Scholar]
- 76.Yasuda H, Tochigi Y, Katayama K, Suzuki H. Progression of renal fibrosis in congenital CKD model rats with reduced number of nephrons. Exp Toxicol Pathol. 2017;69(5):245‐258. [DOI] [PubMed] [Google Scholar]
- 77.Nath KA. Tubulointerstitial changes as a major determinant in the progression of renal damage. Am J Kidney Dis. 1992;20(1):1‐17. [DOI] [PubMed] [Google Scholar]
- 78.Su Z, Widomski D, Ma J, et al. Longitudinal changes in measured glomerular filtration rate, renal fibrosis and biomarkers in a rat model of type 2 diabetic nephropathy. Am J Nephrol. 2016;44(5):339‐353. [DOI] [PMC free article] [PubMed] [Google Scholar]
- 79.Remuzzi A, Puntorieri S, Mazzoleni A, Remuzzi G. Sex related differences in glomerular ultrafiltration and proteinuria in Munich‐Wistar rats. Kidney Int. 1988;34(4):481‐486. [DOI] [PubMed] [Google Scholar]
- 80.Breyer MD, Bottinger E, Brosius FC 3rd, et al. Mouse models of diabetic nephropathy. J Am Soc Nephrol. 2005;16(1):27‐45. [DOI] [PubMed] [Google Scholar]
- 81.Brosius FC 3rd, Alpers CE, Bottinger EP, et al. Mouse models of diabetic nephropathy. J Am Soc Nephrol. 2009;20(12):2503‐2512. [DOI] [PMC free article] [PubMed] [Google Scholar]
- 82.Path G, Perakakis N, Mantzoros CS, Seufert J. Stem cells in the treatment of diabetes mellitus ‐ focus on mesenchymal stem cells. Metabolism. 2019;90:1‐15. [DOI] [PubMed] [Google Scholar]
- 83.Cossu G, Birchall M, Brown T, et al. Lancet commission: stem cells and regenerative medicine. Lancet. 2018;391(10123):883‐910. [DOI] [PubMed] [Google Scholar]
- 84.El‐Ashmawy NE, Khedr EG, El‐Bahrawy HA, El‐Berashy SA. Effect of human umbilical cord blood‐derived mononuclear cells on diabetic nephropathy in rats. Biomed Pharmacother. 2018;97:1040‐1045. [DOI] [PubMed] [Google Scholar]
- 85.Masoad RE, Ewais MM, Tawfik MK, Abd El‐All HS. Effect of mononuclear cells versus pioglitazone on streptozotocin‐induced diabetic nephropathy in rats. Pharmacol Rep. 2012;64(5):1223‐1233. [DOI] [PubMed] [Google Scholar]
- 86.Nagamura‐Inoue T, He H. Umbilical cord‐derived mesenchymal stem cells: their advantages and potential clinical utility. World J Stem Cells. 2014;6(2):195‐202. [DOI] [PMC free article] [PubMed] [Google Scholar]
- 87.Park JH, Park J, Hwang SH, Han H, Ha H. Delayed treatment with human umbilical cord blood‐derived stem cells attenuates diabetic renal injury. Transplant Proc. 2012;44(4):1123‐1126. [DOI] [PubMed] [Google Scholar]
- 88.Eirin A, Zhu XY, Krier JD, et al. Adipose tissue‐derived mesenchymal stem cells improve revascularization outcomes to restore renal function in swine atherosclerotic renal artery stenosis. Stem Cells. 2012;30(5):1030‐1041. [DOI] [PMC free article] [PubMed] [Google Scholar]
- 89.Sood V, Mittal BR, Bhansali A, et al. Biodistribution of 18F‐FDG‐labeled autologous bone marrow‐derived stem cells in patients with type 2 diabetes mellitus: exploring targeted and intravenous routes of delivery. Clin Nucl Med. 2015;40(9):697‐700. [DOI] [PubMed] [Google Scholar]
- 90.Yang J, Dai C, Liu Y. A novel mechanism by which hepatocyte growth factor blocks tubular epithelial to mesenchymal transition. J Am Soc Nephrol. 2005;16(1):68‐78. [DOI] [PubMed] [Google Scholar]
- 91.Li B, Leung JCK, Chan LYY, et al. Amelioration of endoplasmic reticulum stress by mesenchymal stem cells via hepatocyte growth factor/c‐met signaling in obesity‐associated kidney injury. Stem Cells Translational Medicine. 2019;8(9):898‐910. [DOI] [PMC free article] [PubMed] [Google Scholar]
- 92.Li L, Baroja ML, Majumdar A, et al. Human embryonic stem cells possess immune‐privileged properties. Stem Cells. 2004;22(4):448‐456. [DOI] [PubMed] [Google Scholar]
- 93.Drukker M, Katchman H, Katz G, et al. Human embryonic stem cells and their differentiated derivatives are less susceptible to immune rejection than adult cells. Stem Cells. 2006;24(2):221‐229. [DOI] [PubMed] [Google Scholar]
- 94.Rossignol J, Boyer C, Thinard R, et al. Mesenchymal stem cells induce a weak immune response in the rat striatum after allo or xenotransplantation. J Cell Mol Med. 2009;13(8b):2547‐2558. [DOI] [PMC free article] [PubMed] [Google Scholar]
- 95.Torres Crigna A, Daniele C, Gamez C, et al. Stem/stromal cells for treatment of kidney injuries with focus on preclinical models. Front Med. 2018;5:179. [DOI] [PMC free article] [PubMed] [Google Scholar]
- 96.Azushima K, Gurley SB, Coffman TM. Modelling diabetic nephropathy in mice. Nat Rev Nephrol. 2018;14(1):48‐56. [DOI] [PubMed] [Google Scholar]
Associated Data
This section collects any data citations, data availability statements, or supplementary materials included in this article.
Supplementary Materials
Table S1 Study Characteristics (n = 40)
Table S2. Studies with preconditioning, cell and/or animal manipulations for optimization of cell‐based therapy in DKD
Table S3. Abstracted individual markers of kidney injury and repair measured after cell‐based therapy in animal models of DKD
Table S4. Serum Creatinine: Subgroup Analyses of Animal‐ and Cell‐Related Factor Effect
Table S5. Serum Urea: Subgroup Analyses of Animal‐ and Cell‐Related Factor Effect
Table S6. Urine Protein Excretion: Subgroup Analyses of Animal‐ and Cell‐Related Factor Effect
Table S7. Kidney fibrosis: Subgroup Analyses of Animal‐ and Cell‐Related Factor Effect
Table S8. Pro‐ and Anti‐Inflammatory Markers in Kidney: Subgroup Analyses of Animal‐ and Cell‐Related Factor Effect
Table S9. Pro‐ and Anti‐Inflammatory Markers in Blood: Subgroup Analyses of Animal‐ and Cell‐Related Factor Effect
Table S10. Effect of treatment‐related factors: Cell dose, total
Table S11. Effect of treatment‐related factors: Cell source health
Table S12. Effect of treatment‐related factors: Cell delivery route
Table S13. Effect of animal‐related factors: Animal type
Table S14. Effect of animal‐related factors: Diabetes model
Figure S1. Effect of cell‐based therapy on serum creatinine in animal models of DKD
Figure S2. Effect of cell‐based therapy on urine protein excretion in animal models of DKD
Figure S3. Effect of cell‐based therapy on markers of fibrosis in animal models of DKD
Figure S4. Quality Assessment
Figure S5. Risk of Bias Assessment
Figure S6. Funnel plot of serum creatinine for publication bias analysis
Material S1: Database Queries (Examples)
Material S2: Articles included in meta‐analysis of cell‐based therapy in animal models of DKD
Figure S1 . Effect of cell‐based therapy on serum creatinine in animal models of DKD
Forest plot displays changes in serum creatinine (mg/dl) following cell/cell product administration in animals with diabetes. Data are displayed as weighted mean difference (WMD) and 95% confidence intervals (CI). Weights are from random effects analysis. Abbreviations: DKD: diabetic kidney disease; MSC: Mesenchymal stem cell, MSC‐EV: MSC‐derived exosomes or extracellular vesicles, AFSC: Amniotic fluid stem cells, HUCB‐SC: Human umbilical cord blood‐derived mononuclear cells, HLSC‐EV: Human‐liver stem‐like cells, SRC: selected renal cells, Ad: Adipose, BM: Bone Marrow, UC: Umbilical Cord, AF: Amniotic fluid, Liv: Liver, Kid: Kidney
Figure S2 . Effect of cell‐based therapy on urine protein excretion in animal models of DKD
Forest plot displays changes in urine protein excretion following cell or cell product administration to animals with diabetes. Data are displayed as weighted mean difference (WMD) and 95% confidence intervals (CI). Weights are from random effects analysis. Abbreviations: DKD: diabetic kidney disease; MSC: Mesenchymal stem cell, MSC‐EV: MSC‐derived exosomes or extracellular vesicles, HUCB‐SC: Human umbilical cord blood‐derived mononuclear cells, USC‐EV: Urine‐derived stem cells, HLSC‐EV: Human‐liver stem‐like cells, Panc FPC: Pancreatic progenitor (fetal) cells, DPSC=Dental pulp stem cells, MSC‐hUCB=Human umbilical cord blood‐derived mesenchymal cells, BM: Bone Marrow, UC: Umbilical Cord, Liv: Liver, Panc: Pancreas, DP: Dental pulp, UC: Umbilical cord
Figure S3 . Effect of cell‐based therapy on markers of fibrosis in animal models of DKD
Forest plot displays changes in fibrosis markers following cell or cell product administration to animals with diabetes. Data are displayed as standardized mean difference (SMD) and 95% confidence intervals (CI). Abbreviations: MSC: Mesenchymal stem cell, MSC‐EV: MSC‐derived exosomes or extracellular vesicles, AFSC: Amniotic fluid stem cells, HUCB‐SC: Human umbilical cord blood‐derived mononuclear cells, EoBMC: Early outgrowth bone marrow cells, HLSC‐EV: Human‐liver stem‐like cells, MDSC = Myeloid‐derived suppressor cells, MSC‐BM‐EV: Bone marrow‐derived mesenchymal stem cell extracellular vesicles, MSC‐hUCB=Human umbilical cord blood‐derived mesenchymal cells, Panc FPC: Pancreatic progenitor (fetal) cells, Ad: Adipose, BM: Bone Marrow, UC: Umbilical Cord, AF: Amniotic fluid, Liv: Liver, Panc: Pancreas
Figure S4 . Quality assessment
Quality assessment parameters were reviewed for 40 articles (Y‐axis). Each parameter was rated as Yes, Partly, No or N/A (not applicable). For each parameter, the X‐axis shows the distribution (or percentage) of articles within the 4 ratings. Most studies sufficiently reported data to allow for meta‐analysis conduct and potential replication of interventions.
Figure S5 . Risk of bias assessment
Bias assessment parameters were reviewed for 40 articles (Y‐axis). Each parameter was rated as Low, Unclear or High risk of bias. For each parameter, the X‐axis shows the distribution (or percentage) of articles within the 3 bias ratings. Risk of bias was low or unclear for most parameters. A higher risk of bias was detected in the areas of random housing (performance bias).
Figure S6 . Funnel plot of serum creatinine for publication bias analysis
The distribution of weighted mean differences (WMD) is shown for articles examining the effect of cell‐based therapy on serum creatinine. A funnel plot with pseudo 95% confidence limits is shown. Visual examination of the funnel plot revealed no publication bias. Data are shown as WMD in mg/dl and 95% confidence intervals (CI).
Data Availability Statement
Data relevant to the study are included in the article or uploaded as Supporting Information.