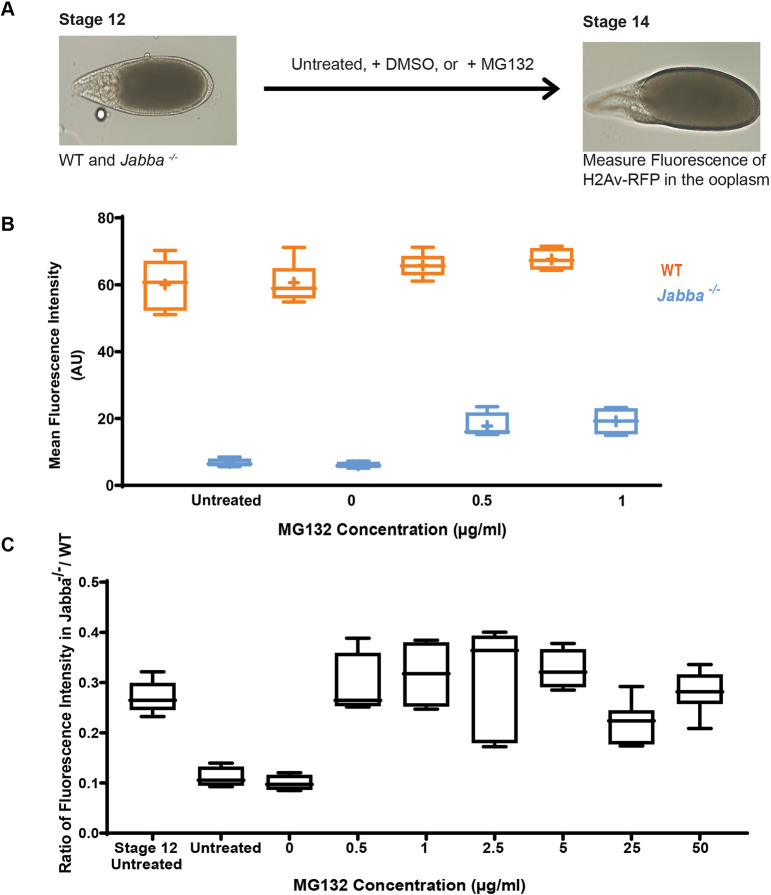
Fig. 5.
H2Av is degraded in the absence of Jabba. (A) Schematic depiction of IVEM. (B) The mean fluorescence intensity (AU) in S14 wild-type (orange) or Jabba−/− (blue) ECs after IVEM. Length of box plot: the 25th and 75th percentile; line indicates median; cross indicates mean (n=4-8). (C) The ratio of the average mean fluorescence intensity (AU) of Jabba−/−:wild type for MG132 concentrations. Stage 12 untreated indicates S12 ECs analyzed immediately after dissection; untreated indicates cultured in IVEM media.

