Fig. 6.
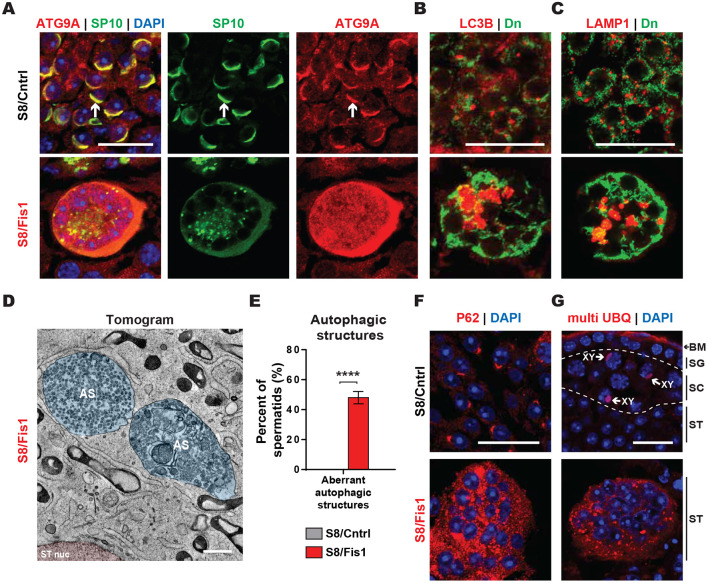
S8/Fis1 spermatid giant cells exhibit aberrant accumulation of autophagic structures. (A) Immunostaining of testis sections with the early autophagic marker ATG9A. Note the localization of ATG9A to the acrosome (white arrows) and the accumulation of ATG9A in mutant spermatids. Scale bar: 20 µm. (B) Immunostaining of testis sections with the autophagy marker LC3B. Scale bar: 20 µm. (C) Immunostaining of testis sections with the lysosome marker LAMP1. Scale bar: 20 µm. (D) Electron tomogram of a P36 Fis1 GC. The following pseudocolors are used: Nucleus, pink; autophagic structures, blue. AS, autophagic structures; ST nuc, spermatid nucleus. Scale bar: 500 nm. (E) Quantification of aberrant autophagic structures from EM micrographs. (F) Immunostaining of testis sections with an antibody against the autophagy marker P62. Note the accumulation and aggregation of P62 in mutant spermatids. Scale bar: 20 µm. (G) Immunostaining of testis sections with an antibody against monoubiquitin and multiubiquitin chains (K29-, K48- and K63-linked). BM, basement membrane; SC, spermatocyte; SG, spermatogonia; ST, spermatid. As expected, control spermatocytes have ubiquitin staining in the XY body, and control spermatids lack ubiquitin signal. Scale bar: 20 µm. All data are from P35 animals, unless otherwise indicated. Data are represented as mean±s.e.m. ****P≤0.0001. For statistical tests used, see the Materials and Methods section.

