Abstract
The ribosome is a ribozyme. At the peptidyl transfer center (PTC) of 180 nt, two loops (the A- and P- loops) bind to tRNAs and position them in close proximity for efficient peptidyl ligation. There is also a 2-fold rotational symmetry in the PTC, which suggests that the precursor of the modern ribosome possibly emerged through dimerization and gene fusion. However, experiments that demonstrate the possible dimerization have not yet been published. In our investigation, we reported single molecule FRET studies of two RNA fragments that generated high FRET values. By labeling the 5’-biotinylated rRNA molecules at the 3’- terminals, or labeling three different types of tRNA-like oligos, we observed that RNA scaffolds can assemble and bring several short tRNA-acceptor-domain analogs, but not full-length tRNAs, to close proximity. Mg2+ and continuous 3-way junction motifs are essential to this process, but amino acid charging to the tRNA analogs is not required. We observed RNA dimers via native gel-shifting experiments. These experiments support the possible existence of a proto-ribosome in the form of an RNA dimer or multimer.
Keywords: peptidyl transferase activity, peptide ligase, LUCA (last universal common ancestor), single molecule FRET, Gel shifting, tRNA-like oligo
Graphical Abstract
Introduction
The ribosome synthesizes proteins by bringing the aminoacylate and peptidyl tRNAs to close proximity for the peptidyl transfer reaction, using mRNA templates to select tRNAs [1]. The peptidyl transfer center of the ribosome is of ~200 nt and is the most ancient and conserved region [2, 3]. In this region, the “A-” and “P-” loops form base-pairs with the tRNA CCA ends, which positions the amino acid for optimum inline attack of the peptidyl chain. The lack of protein at the catalytical center suggests that the proto-ribosome is a ribozyme [4]. Although a protein-free peptidyl ligase remains elusive, short RNA oligo experiments have demonstrated the concept of RNA precursors to catalyze single peptide-like bonds [5–7]. Between the full composition of the modern ribosome and the bottom-up short ribozymes, intermediate-sized ancestral ribosomes were explored. A 314 nt RNA construct was subjected to multiple rounds of in vitro evolution selection. Several of the evolved constructs were generated, but none contained peptidyl activity, although other covalent bonds formed [8]. Meanwhile, combining results of comparative-sequence analysis , tertiary/A-minor interaction, and spherical approximation of high resolution structures, an ancestral 50S was synthesized and tested in vitro and in vivo [9–12]. Though the overall structure of the ribosome is not symmetric, the peptidyl transfer center contains a 2-fold rotational symmetry. This symmetric structure and its high conservation across life domains suggest that the origin of the proto-ribosome arose from dimerization and gene fusion [13, 14]. While experiments to demonstrate this dimerization have not been published, theoretical quantum calculations have supported the favorable energy compensation in pair formation and short substrate binding [15]. In this report, we have observed high values of FRET efficiency between dyes labelled on the rRNA fragments, which have similar sequences as those used in the quantum calculations. The high FRET values indicated short distances between the two rRNA molecules, which suggested dimerization. Furthermore, native gel shifting assays detected dimer formation. In addition, we measured FRET between labelled short tRNA analogues in the presence of these rRNA fragments. They also formed FRET signals of high value, which is consistent with the theoretical prediction of positioning substrates to proximity by dimerization of the proto-ribosome like RNA molecules.
Experimental
All of the DNA and RNA molecules are purchased from IDTDNA with ESI Mass Spec confirmations from the vendor. The 2D structures of these nucleic acids are shown in Figure S1.
The PTC_DNA sequence is “ATGTCGGCTCGTCGCATCC TGGGAA(iUniAmM)GAACCAAGGGTTGGGCTGTTCGCCCA(▲)TTAAAGCGGCACGCGAGCTGGGTTCAGAACGTCGTGAGACAGTTCGGTC”. The strikethrough nucleotides are removed from the original ribosome sequence to make the stem loop shorter, and the underlined residue “A” was modified with an alkyl amino group for labeling reactions. The black triangle indicates the split position of two RNA molecules (RNA1 and RNA2) that have the same sequence of the first and second halves of PTC_DNA. These two RNAs are used to test the essential motifs for substrate binding.
The PTC1a sequence is “5’-biotin-AGACCCCGUGGAGCUUU ACUGCAGCC(GAAGAA)GGCGGGCAGUUUGACUGGGGCGGUC(AA)AAAAGUUACCCCGAGGAUAACAGGCUGAUCUC(GUGA)GGAGGUUUGGCACCUC”, in which the underlined “A” has replaced original “G” to avoid quadruple Gs. The strikethrough nucleotides are removed from the original ribosome sequence to shorten the sequence. The nucleotides in parentheses are inserts to replace long helices in the original sequence as described previously [16].
The PTC1b sequence is “5’-biotin-AUGUCGGCUCGUCGCAUCCU GGGACUGAAGAAGGUCCCAAGGGUUGGGCUGUUCGCCCAUUAAAGCGGCACGCGAGCUGGGUUCAGAACGU CGUGAGACAGUUCGGUC”, in which the underlined “A” has replaced original “G” to avoid quadruple Gs. The minihelix sequence is “GGGUGGAA(iAmMC6T)GACACCCAC CA”, which contains a stem loop of 5 bps and an internal alkyl amino group for labeling.
The CA_DNA sequence is AT(iAmMC6T)CA, which contains tRNA terminal “CA” residues in DNA form and an internal alkyl amino group for labeling.
The Lys-tRNALys_T1 contains CACCACCA-Lys and other small RNA pieces after RNase T1 digestion of charged e coli tRNALys (55% charging efficiency, 1000 pmol/A260). The tRNALys was purchased from Chemical-block.com. RNase T1 is purchased from thermofisher. The longer RNase T1 digested pieces were removed by Monarch RNA cleanup kit from New England Biolabs, and the small pieces were concentrated in the run-through solution via evaporation, and then recovered via 2—3 times of ethanol precipitations.
Nucleic acid labeling.
The PTC1a and PTC 1b are labelled at their 3’-end with kit from Vector@Laboratories (3’ EndTag™ DNA End Labeling System). The minihelix is labelled at the internal alkyl amino group with Cy3- or Cy5- NHS (Lumiprobe). PTC_DNA is biotinylated or Cy3/Cy5 labelled at its internal alkyl amino group with NHS salts, or at terminals with the kits from Vector@Laboratories. The tRNA-like short oligos are labelled at their 5’-end with the kit from Vector@Laboratories (5’ EndTag™ DNA End Labeling System).
Minihelix charging.
The minihelix was charged similarly as normal tRNALys. The charging solution contained 100 mM tris-HCl (7.5), 10 mM MgCl2, 0.5 mM EDTA, 1 mM ATP, 10 A260/ml of minihelix, 7 mM b-mercaptoethanol, 50 μM of lysine, 2 μM of purified lysine-tRNA synthetase (or 10% of total synthetase from cell extract). The mixture was incubated at 37 °C for 15 min, then extracted with equal volume of phenol. The aqueous lay was separated and precipitated. The RNA pellet was dried and resuspended with water. Charging efficiency was approximately 15% based on C14-lysine radioactivity and A260 absorption. Both lysine synthetase and total synthetase charged the minihelix with similar efficiency.
Results and discussion
RNA 2D folding.
The 2Dand 3D structures of the symmetric parts of the peptidyl center are shown in Figure 1. Figure 1a highlights the canonical PTC center of the ribosome, in which the PTC1a (green)/1b (red) includes H74/75/80/89 and H90/91/92/93, respectively [17]. The numbering is based on the e coli system [18]. The PTC1a is embedded among more branches, which were truncated based on the superposition of the PTC1a onto PTC1b (details in the experimental section above). A GNRA tetraloop is present at the PTC1b sequence [19], which is probably the main driving factor for dimerization as shown in Figure 1b (generated from x-ray structure of 4wpo) [20]. The same GNRA sequence was added to the PTC1a sequence to replace the longer native sequence, due to the length limitation of the vendor’s synthesizer. Other interactions include H-bonding between base-base, phosphate-2’ hydroxyl, and base-sugar. These interactions and systematic theory of many other interactions were shown earlier [21, 22]. Arrows in this graph indicate 2’-OH group interactions, which predicated stronger dimerization of RNA than DNA molecules. Other interactions are base pairing interactions, which are similar in both RNA and DNA species.
Figure 1.
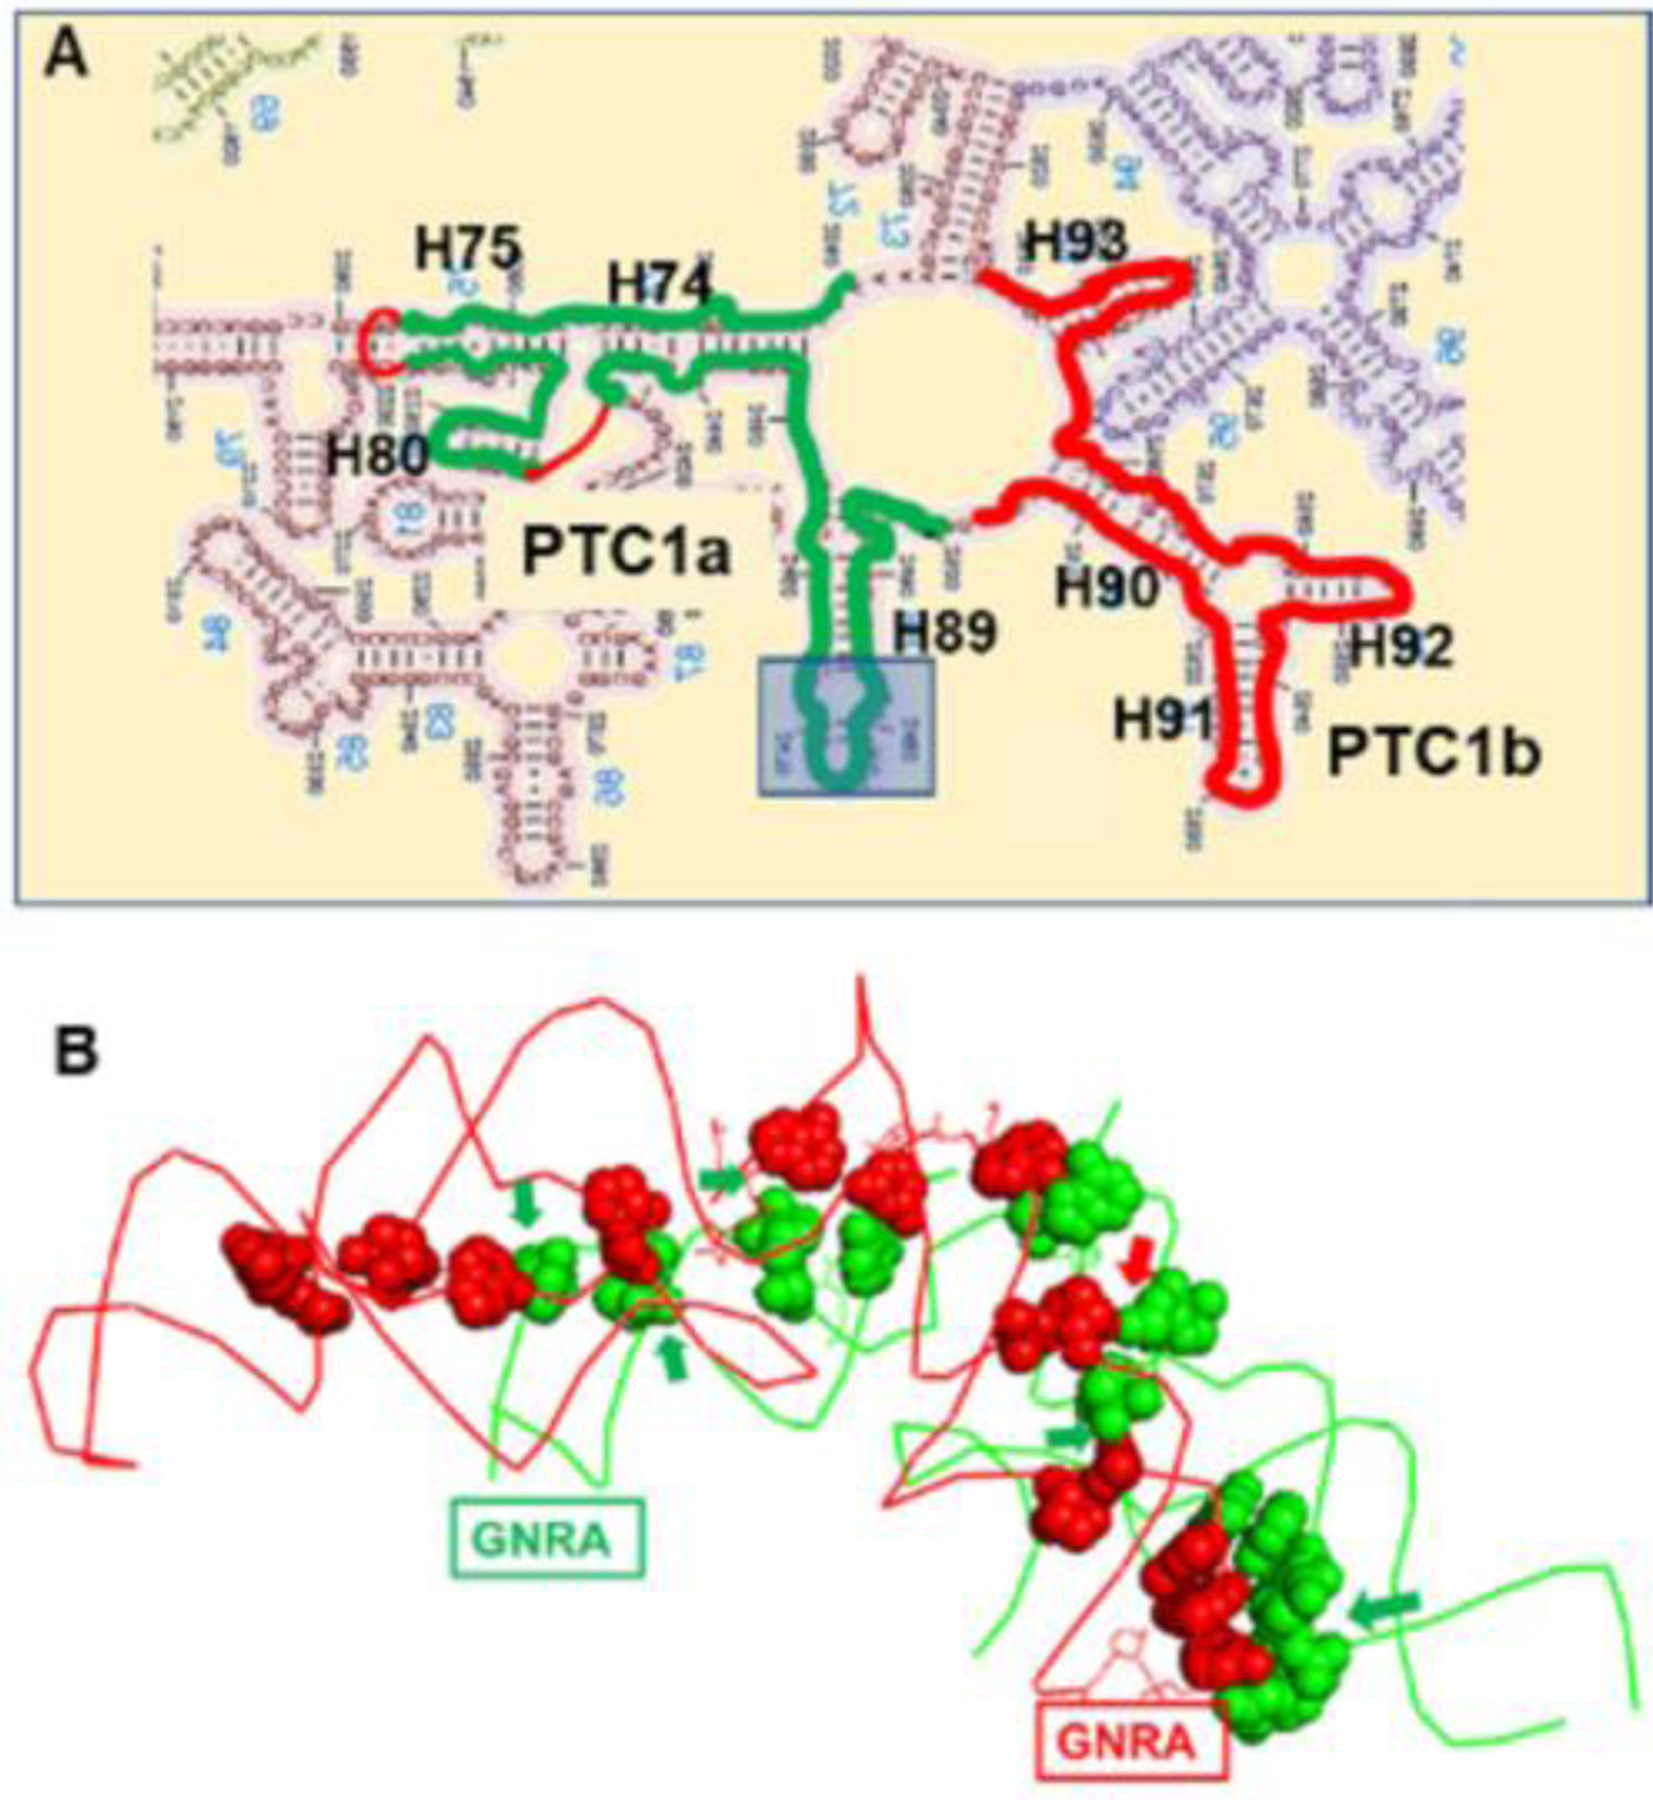
(A) Illustration of the RNA/DNA sequences relative to the canonical ribosomal peptidyl transfer center. The tip of H89 is truncated and replaced with GUGA tetraloop. (B) RNA dimerization interactions between PTC1a (green) and PTC1b (red). The e coli numbers of the bases are labelled in Figure S1.
If the 2D structures of the RNA molecules in our experiments are similar to those in the ribosomal peptidyl center, then they are likely to form similar authentic 3D structures as well, as demonstrated by literature [15]. Therefore, we first examined the 2D folding of PTC1a and PTC1b with the mFold program [23]. Figure S1A shows that the PTC1a and PTC1b RNA molecules folded into the ribosome-like forms directly. Similar 2D structures were obtained with another folding software, RNAstructure [24].
Single molecule FRET experiments.
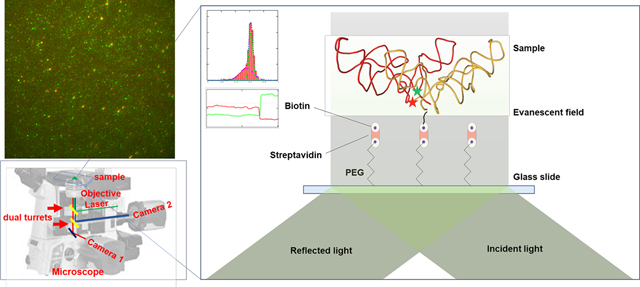
The proper 2D folding prompted us to study whether the ribosome-like 2D structures would promote tertiary dimerization. As shown in Figure 2, the total internal reflection fluorescence (TIRF) spectroscopy was based on a Nikon Eclipse Ti2-E inverted microscope with two CMOS cameras as described before [25]. The sample holder was also described previously [26]. A top turret reflects laser illumination via the TIRF objective to the glass coverslip surface, generating an evanescent wave. The Cy3/Cy5-labelled RNAs are tethered to the pegylated surface via biotin-streptavidin-biotin interactions. The fluorescence emissions from direct excitation of Cy3 and FRET excitation of Cy5 are collected by the same objective, pass through the first turret, and are split by the second turret. Proper bandpass filters further clean up the signals in front of the 2 cameras. In Figure 2‘s setup, cameras 1 and 2 collect the Cy5 (acceptor) and Cy3 (donor) fluorescence emissions, respectively. One representative image is shown. In this image, fluorescence emissions from the same RNA dimer overlap in the two images (color coded and shifted slightly for displaying). The intensities of colocalized dots were retrieved from NIS-elements software (Nikon). Representative traces for each FRET histogram are displayed in Figure S3. FRET efficiencies were calculated by the equation: FRET = (Iacceptor)/(Iacceptor + Idonor). For all measurements, sample concentrations are in the range of 10–100 nM. An oxygen scavenger cocktail (3 mg/mL glucose, 100 mg/mL glucose oxidase, 48 mg/mL catalase, and 2 mM trolox) was added to the channel before imaging to prevent photo bleaching.
Figure 2.
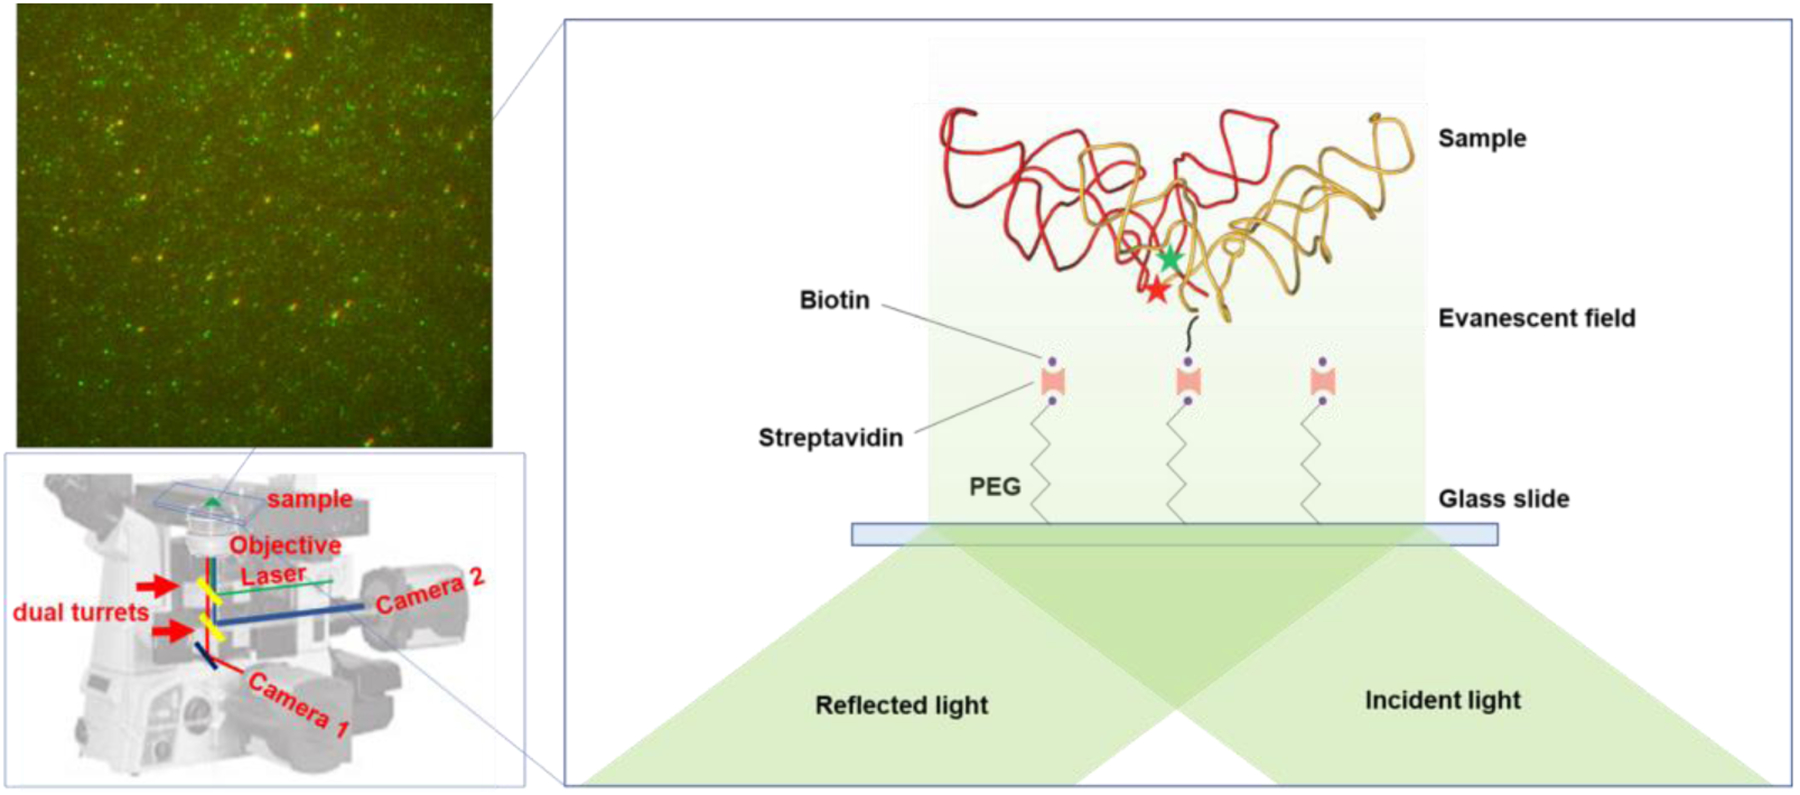
Illustration of the smFRET setup and a representative FRET image. The fluorescence emissions from Cy3 and Cy5 were collected by cameras 2 and 1, respectively, and overlaid with colors.
smFRET of DNA dimerization.
We started the experiments with a PTC1b-like DNA analog that we named PTC_DNA, taking advantage of the greater stability and availability of DNAs compared to RNAs. Similarly, we first examined the 2D folding. Figure S1B depicts the folding of PTC_DNA, which is 4 bp shorter at helix 3 of the 3-way junction motif (shaded in red on the graph). The folding condition is 37 °C, with varied concentrations of Mg2+. Above 60 mM of Mg2+, the sequence folded similarly as in the ribosome, with one stem loop and one 3-way junction. Mg2+ is known to play a major role in DNA structures and stabilities [27]. Therefore, Mg2+ concentrations were varied in these DNA experiments (Figure 3). We studied the smFRET between Cy3/Cy5 that were labelled both on the “AAGAA” loop (X-ray structural distance 107.5 Å, from PDB:4wpo)[20]; one on the “AAGAA” loop and one on the 3’-terminal (68 Å); and both on the 3’-termini (23.1 Å). Concentrations of 5 mM and 15 mM Mg2+ were studied. The first column conveys the dyes’ positions in a hypothetical 3D structure regenerated from 4wpo of the protein data bank. The second and third columns depict experiments with 5 and 15 mM Mg2+, respectively. Two observations were made: First, shorter distances between the dye-labeling positions correlated with higher FRET efficiencies. Comparing vertically in the figure, the FRET efficiencies changed from 0.15 to 0.6 when the dyes were moved from the periphery to the center, suggesting that these FRET signals reported the distance between dimers. For example, FRET efficiencies of 0.2, 0.4 and 0.6 appear sequentially in the first three rows of Figure 3. In most of the graphs in the figure, there is more than one FRET species, indicating that dimerization and folding were likely not homogeneous.
Figure 3.
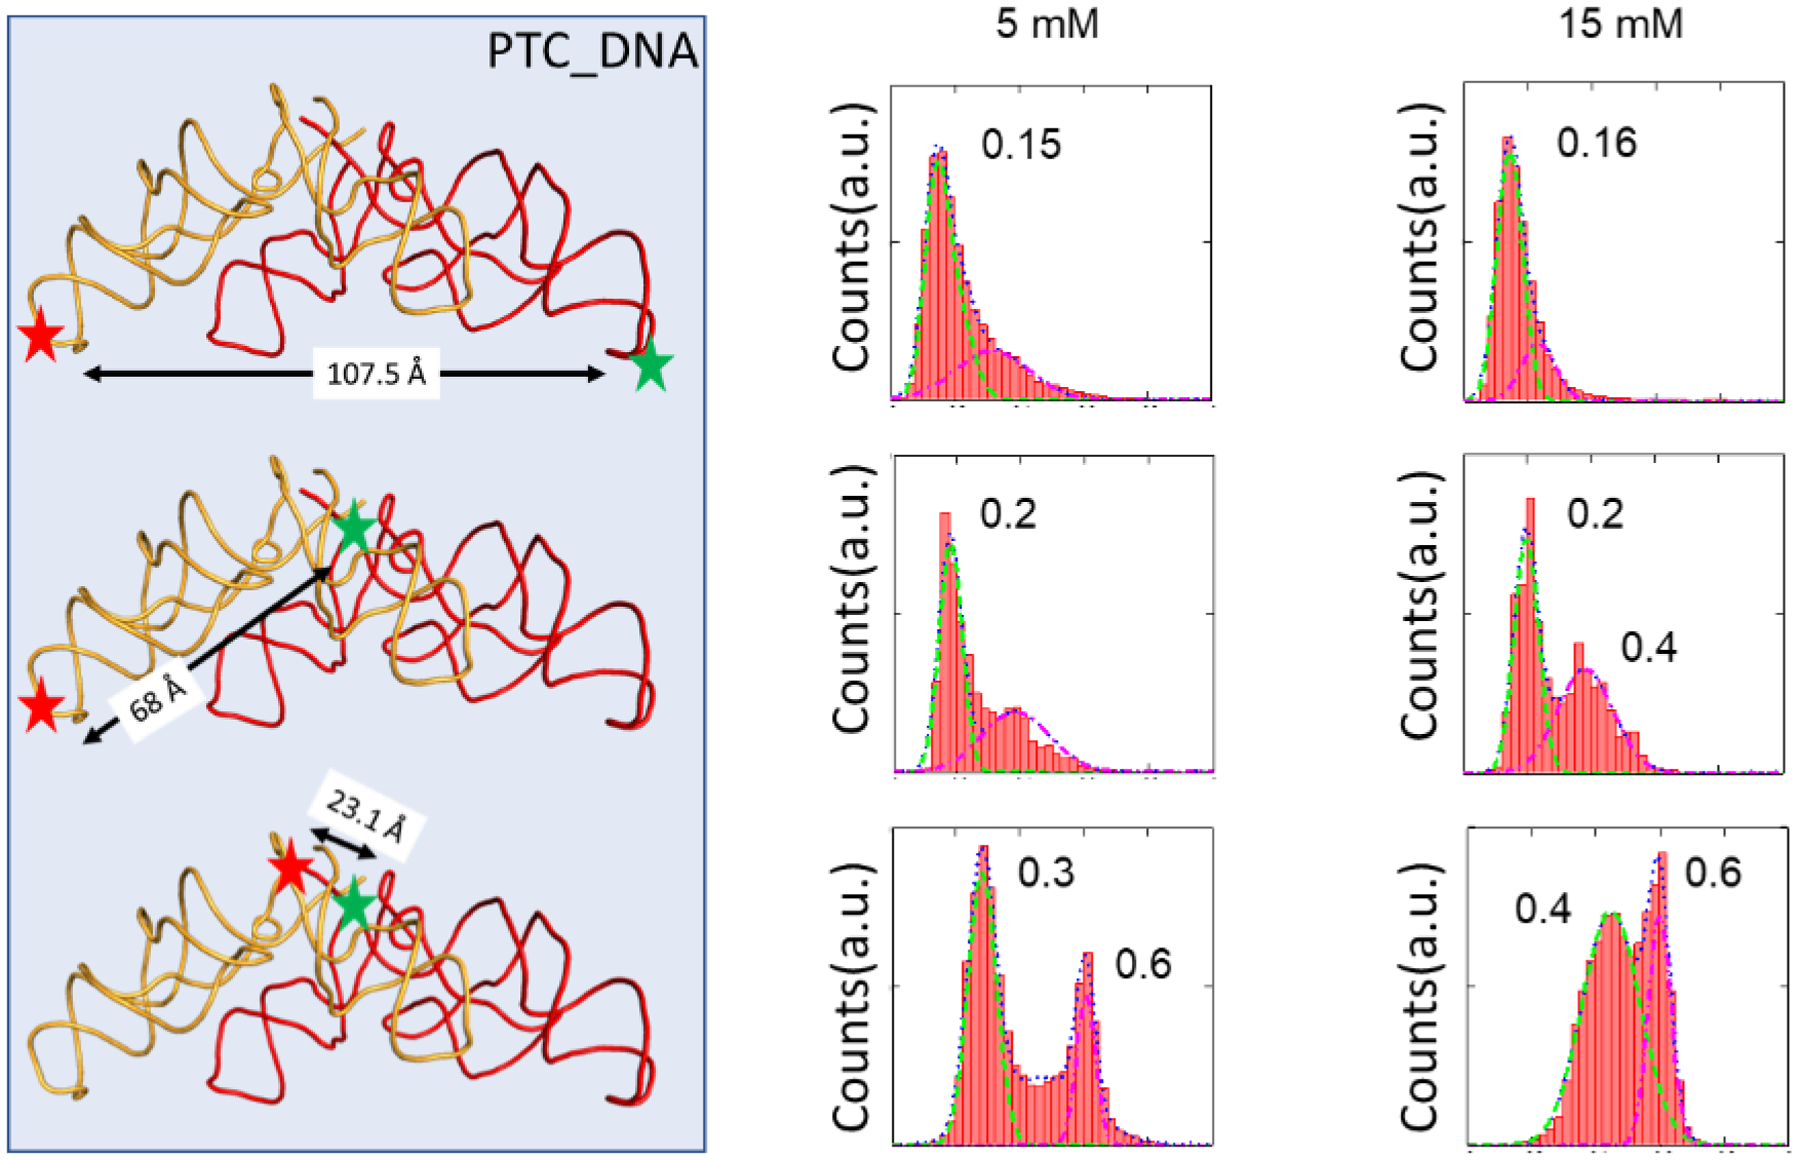
FRET efficiency histograms between the PTC_DNA. The green and red stars showed the Cy3/Cy5 labeling positions. The second and third columns showed the experimental data with 5 and 15 mM Mg2+, respectively. The FRET efficiency peaks were labelled in the plots.
Second, Mg2+ concentration affected dimerization. The FRET efficiencies did not change much in the first row of Figure 3 because the very large distance between the dyes made them less sensitive to conformational changes (the R0 value and optimal distance range for a Cy3-Cy5 pair is approximately 50 Å and 25–75 Å, respectively) [28]. Based on the FRET efficiency equation, a distance of 107 Å should generate a FRET efficiency of 0.01. However, the experimental measured FRET efficiency was 0.15 (corresponding to ~ 67 Å), indicating that the linkers of dyes and the exact dimerization conformation contributed to the deviations from the structure-based estimations. In the second row of Figure 3, a new FRET species around 0.4 emerged (calculated distance of 64 Å). This peak was larger in 15 mM Mg2+ than in 5 mM Mg2+, which was consistent with the 2D folding trend in Figure S1, though the required amount of Mg2+ was much higher in computation than in the actual experiments. In addition, a low FRET species at 0.2 was present. This was likely a second, less compact dimerization species. In the third row of Figure 3, the Cy3/Cy5 were closest and generated the highest FRET signals. The FRET efficiency of 0.6 reflected a distance of 47 Å, which was larger than the structural data of 23 Å. These results suggested that dimer structures were probably similar but not identical to those in the ribosome due to the simpler components and increased water exposure of the surfaces. Additionally, in the third row, there is another FRET species around 0.3–0.4. At 15 mM Mg2+, the percentage of the 0.6 FRET state increases, indicating better packing with the help of Mg2+. In all experiments, FRET signals disappeared if Mg2+ was not present, as previously shown [16]. Although DNA species are not directly relevant to the proto-ribosome, they contain bases with dimerization potentials as shown in Figure 1. In summary, these results validated the physical meaning of the FRET efficiencies and optimized the data acquisition conditions.
CA_DNA binding to the DNA scaffolds.
After we confirmed that smFRET can detect dimerization, we then confirmed the substrate-proximity catalytical function of the dimer. At the tRNA’s CCA end, residue C75 of A- and P-site tRNAs H-bonds with G2553 (H92) and G2252/G2253 (H80) of the A- and P-loop at the peptidyl transfer center, respectively (pointed out in Figure S1A) [29, 30]. These residues are highly conserved and are essential to position the tRNAs. Therefore, we tested if the DNA dimer can bring the CCA analogue CA_DNA to proximity. Because the A- and P-loops’ interactions with the tRNAs are single base-pairing interactions, DNA experiments are reasonable to mimic these RNA interactions. The CA_DNA species were labelled at their 5’-ends with Cy3 or Cy5. Then they were incubated with the DNA dimer. Figure S4 shows that high FRET efficiency (indicating substrate proximity) was observed. From 5–25 mM of Mg2+, the FRET species of 0.6 value increased and became more uniform. But higher concentrations of 50–100 mM Mg2+ induced more diverse subpopulations, probably due to more non-specific interactions induced by excess Mg2+-DNA free energy. Therefore, the optimal Mg2+ concentration lies within a limited range of 10–25 mM in this case.
RNA dimerization.
The dimerization of PTC_1a and PTC_1b in the presence of 20 mM Mg2+ was studied with 3% agarose native gel (75V/1 hr). 20 mM instead of 10 mM Mg2+ was used in sample preparation because during gel migration, some Mg2+ may dissociate. As shown in Figure 4A, PTC_1b monomers in lanes 2–3 migrated between 80 nt and 150 nt ssRNA markers (NEB). The similar band in lane 4 is PTC_1a monomer. Lane 5 was loaded with a mixture of both PTC_1a and PTC_1b. The dimer bands appear between the 150 nt and 300 nt ssRNA markers in all lanes. Based on ImageJ gel analysis, approximately 35% and 65% are dimers and monomers in all lanes, respectively. There are two dimer bands in lane5, likely because both homo- and hetero-dimers were formed. There are some faint bands around and above 300 nt marker position, indicating higher number aggregates are possible, but dimers and monomers are predominant.
Figure 4.
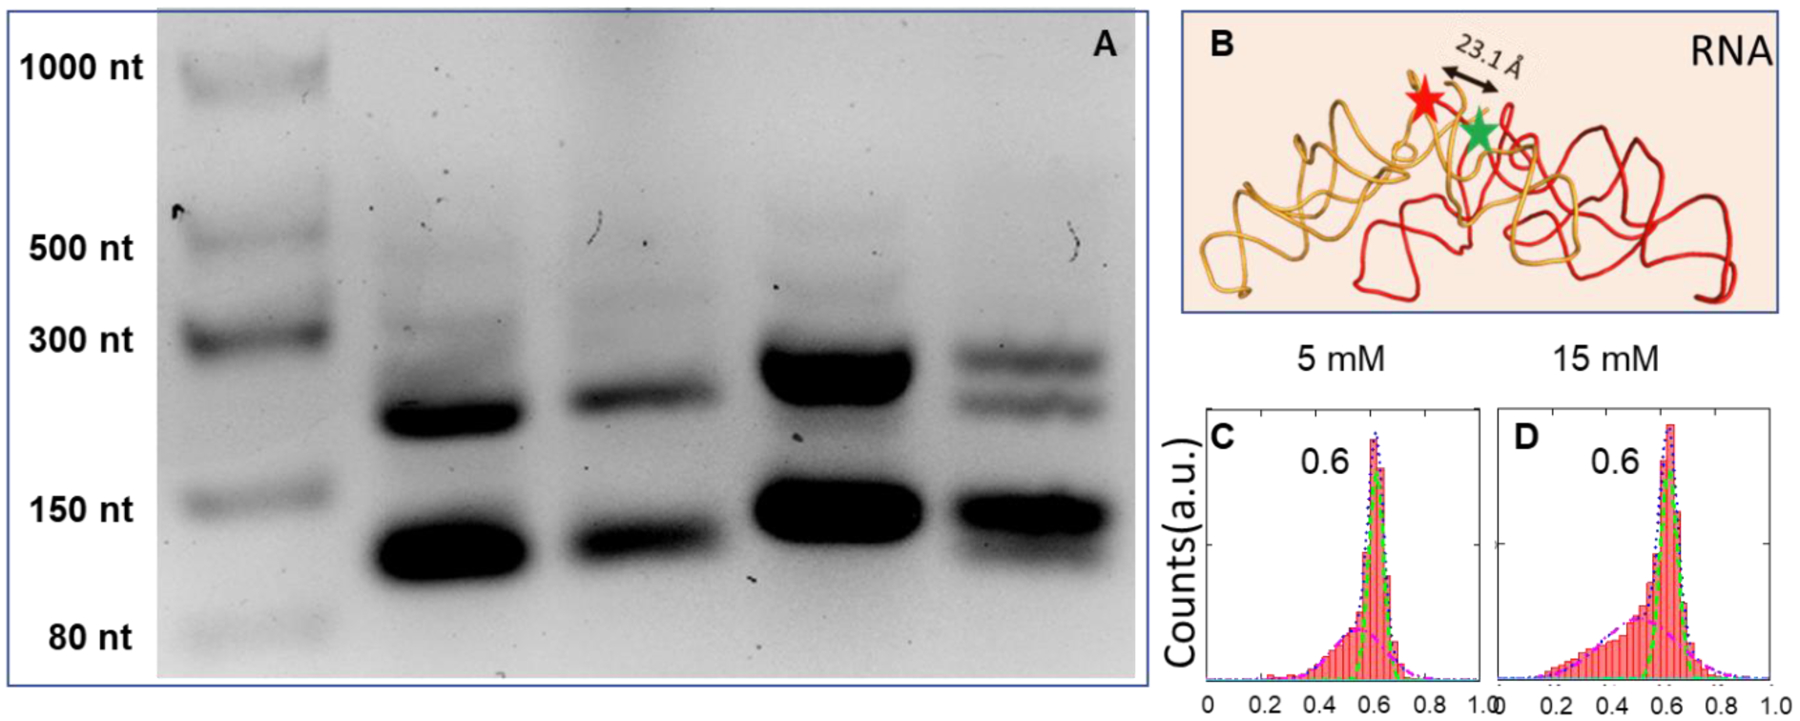
Agarose native gel (stained with SYBR™Gold) and FRET measurement of RNA dimers. (A) Lane 1: single strand RNA ladder; Lane 2 and 3: PTC1b (100 and 200 ng); Lane 4: PTC1a (200 ng); Lane 5: PTC1a/b (100ng/100ng). (B) FRET efficiency histograms between the RNA molecules. The green and red starts showed the Cy3 and Cy5 labeling positions, respectively. (C) and (D) Similar FRET efficiency histograms were observed with 5 and 15 mM Mg2+.
Figure 4B shows the dye labeling positions and Figures 4C–D shows the smFRET data of hetero dimer formation. RNA dimerization was almost uniform with one high FRET species at both 5 mM and 15 mM Mg2+. In addition, homo- and hetero-dimers were equally efficient in dimerization (Figure 5). Figure 5 also indicates that the RNA dimerization was not sensitive to variations in concentration of Mg2+ above 5 mM. The FRET efficiency histograms in the presence of 5, 15 and 25 mM Mg2+ were almost the same. These results implied that RNA dimerization was more robust than DNA dimerization regarding Mg2+ dependence. Although a full interpretation of the Mg2+ effect is theoretically difficult [27, 31, 32], at least one reason could be due to the extensive involvement of 2’-OH interactions, as shown in Figure 1B. On the other hand, only 5 mM Mg2+ is sufficient to promote RNA dimerization, which is much less than the concentration needed for CA_DNA binding (10–25 mM). One reason can be the number of interactions. The binding of DNA/RNA fragments is driven by the GNRA tetra loop and other base interactions, as shown in Figures 1 and S2. However, the binding of tRNA-like molecules to the dimer depends only on one base pairing interaction to my best knowledge, which is much weaker. Therefore, the Mg2+ concentration needed to be higher for the tRNA-like molecules, to bolster the interaction.
Figure 5.
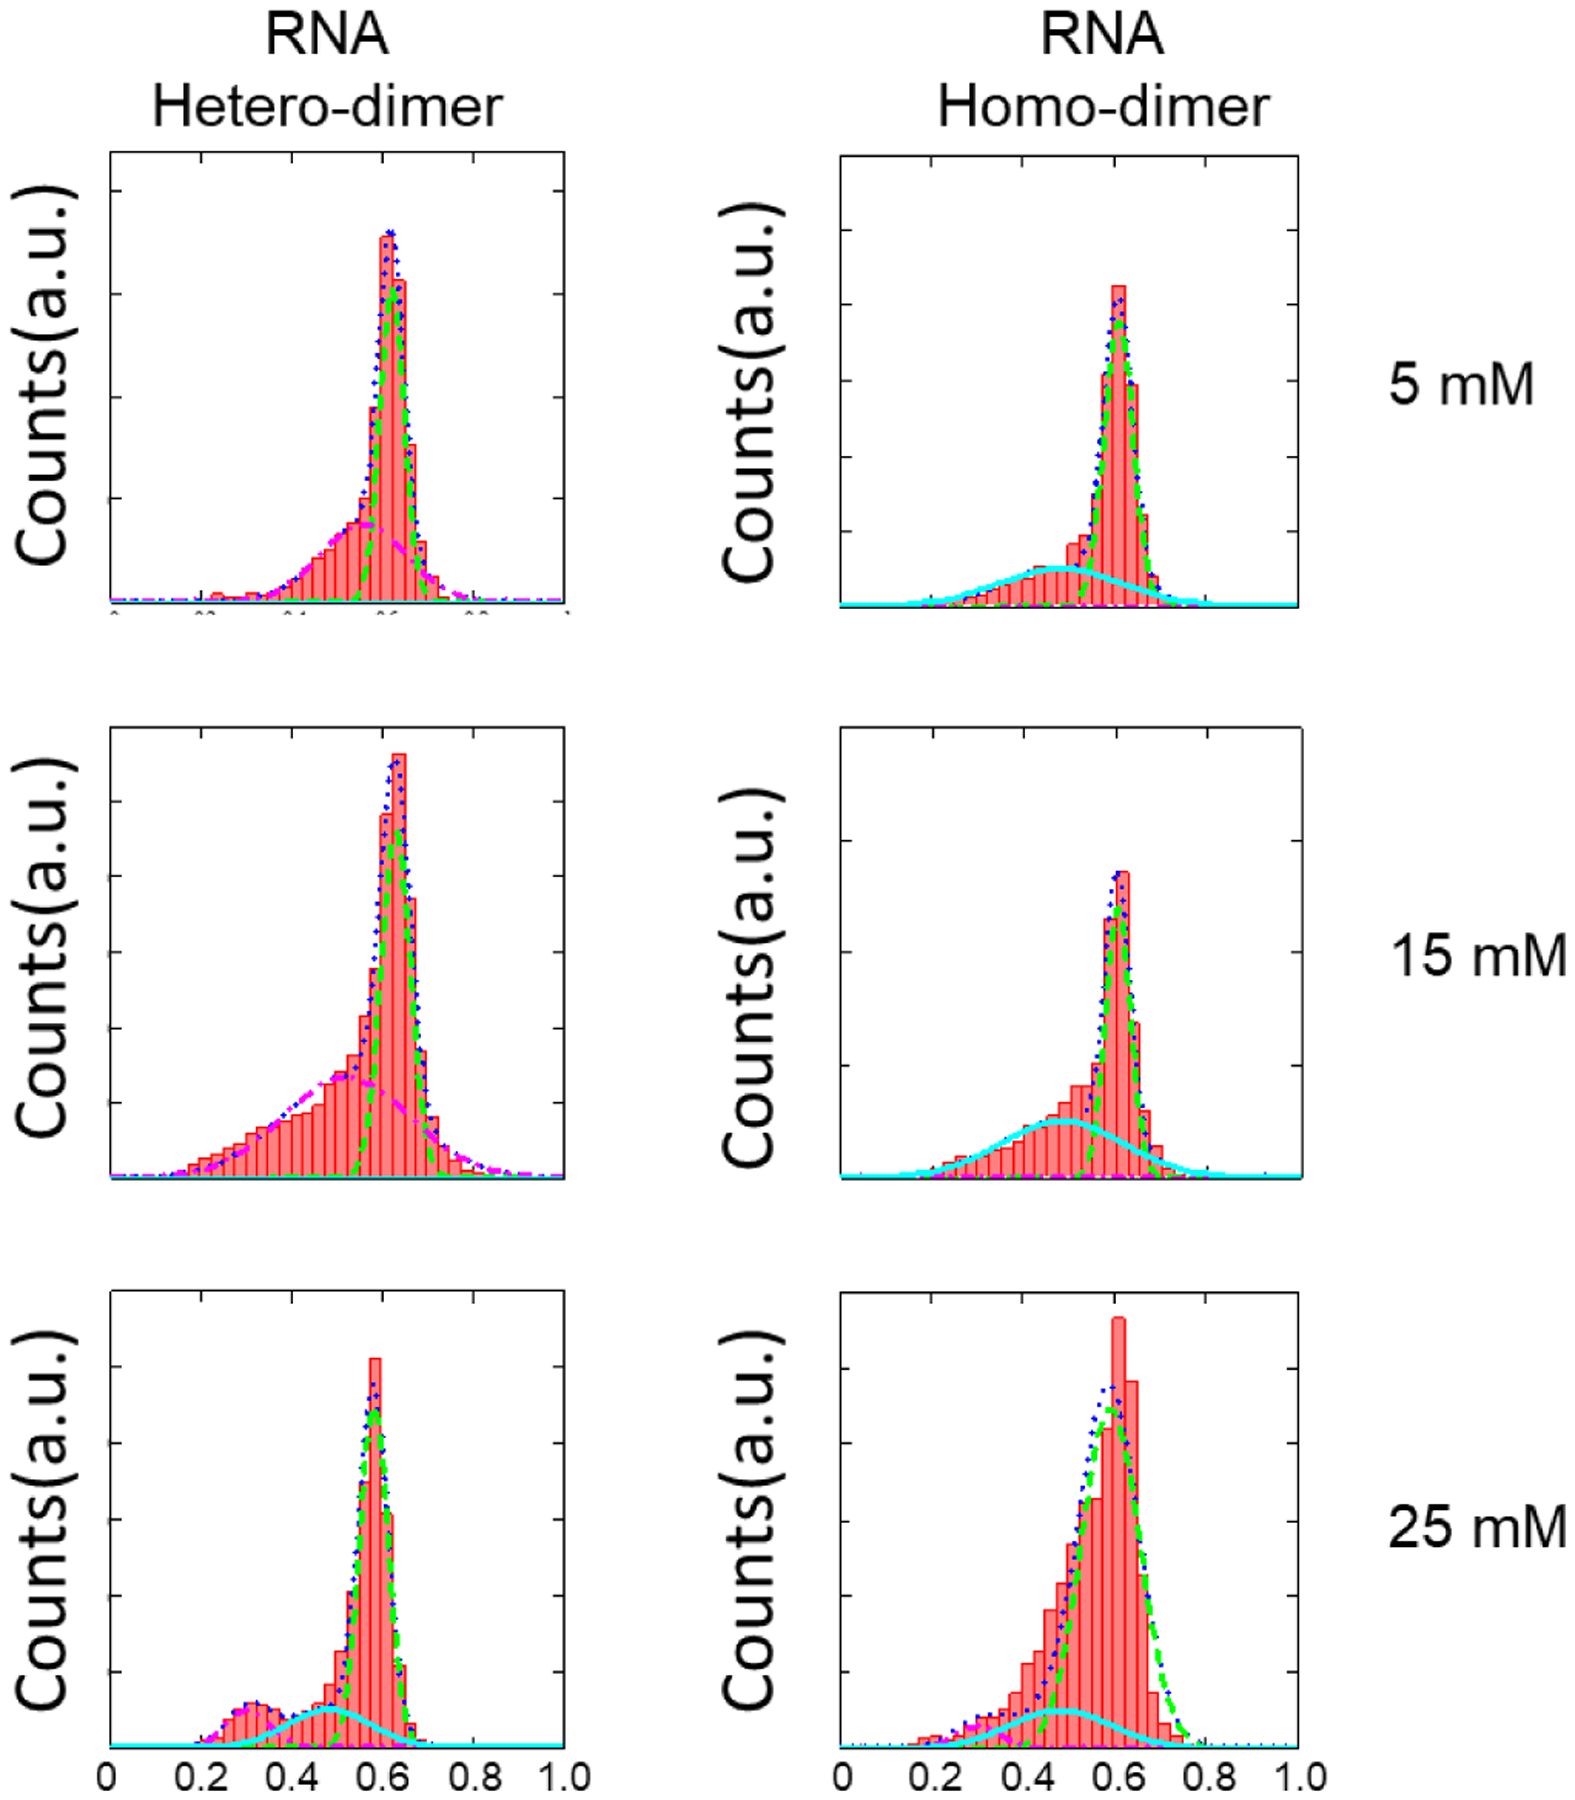
FRET efficiency histograms between the RNA-RNA scaffolds. The first column showed the FRET between PTC1a/1b. The second column showed the FRET between PTC 1b/1b. Three Mg2+ concentrations were studied.
Substrate proximity by binding to the RNA scaffold.
The ability of PTC_1a/b to bring tRNA-like RNA oligos to close proximity was demonstrated. Figure 6A depicts the dye labeling positions. Figure 6B assesses the quality of the oligos with a 30% denaturing PAGE gel (20 cm × 20 cm × 4 mm, 300v/6hr). Lanes 1 and 2 showed homogenous quality of commercially prepared CA_DNA (5 nt) and RNA (ACCCACCA, 8 nt), respectively. These oligos were labelled at the 3’-ends with Cy5 dye, and the gel was imaged with a storm 860 molecular imager (Amersham). Lane 3 showed intrinsic inhomogeneity of RNase T1 digestion of Lys-tRNALys. As mentioned in the experimental section, the long pieces (>20 nt) of the digestion were removed by the RNA binding column. The shorter pieces were recovered via ethanol precipitation of the run-through solution. Consequently, the fragments of 8 nt or shorter are the major components in the digestion mixture, based on their PAGE migrations.
Figure 6.
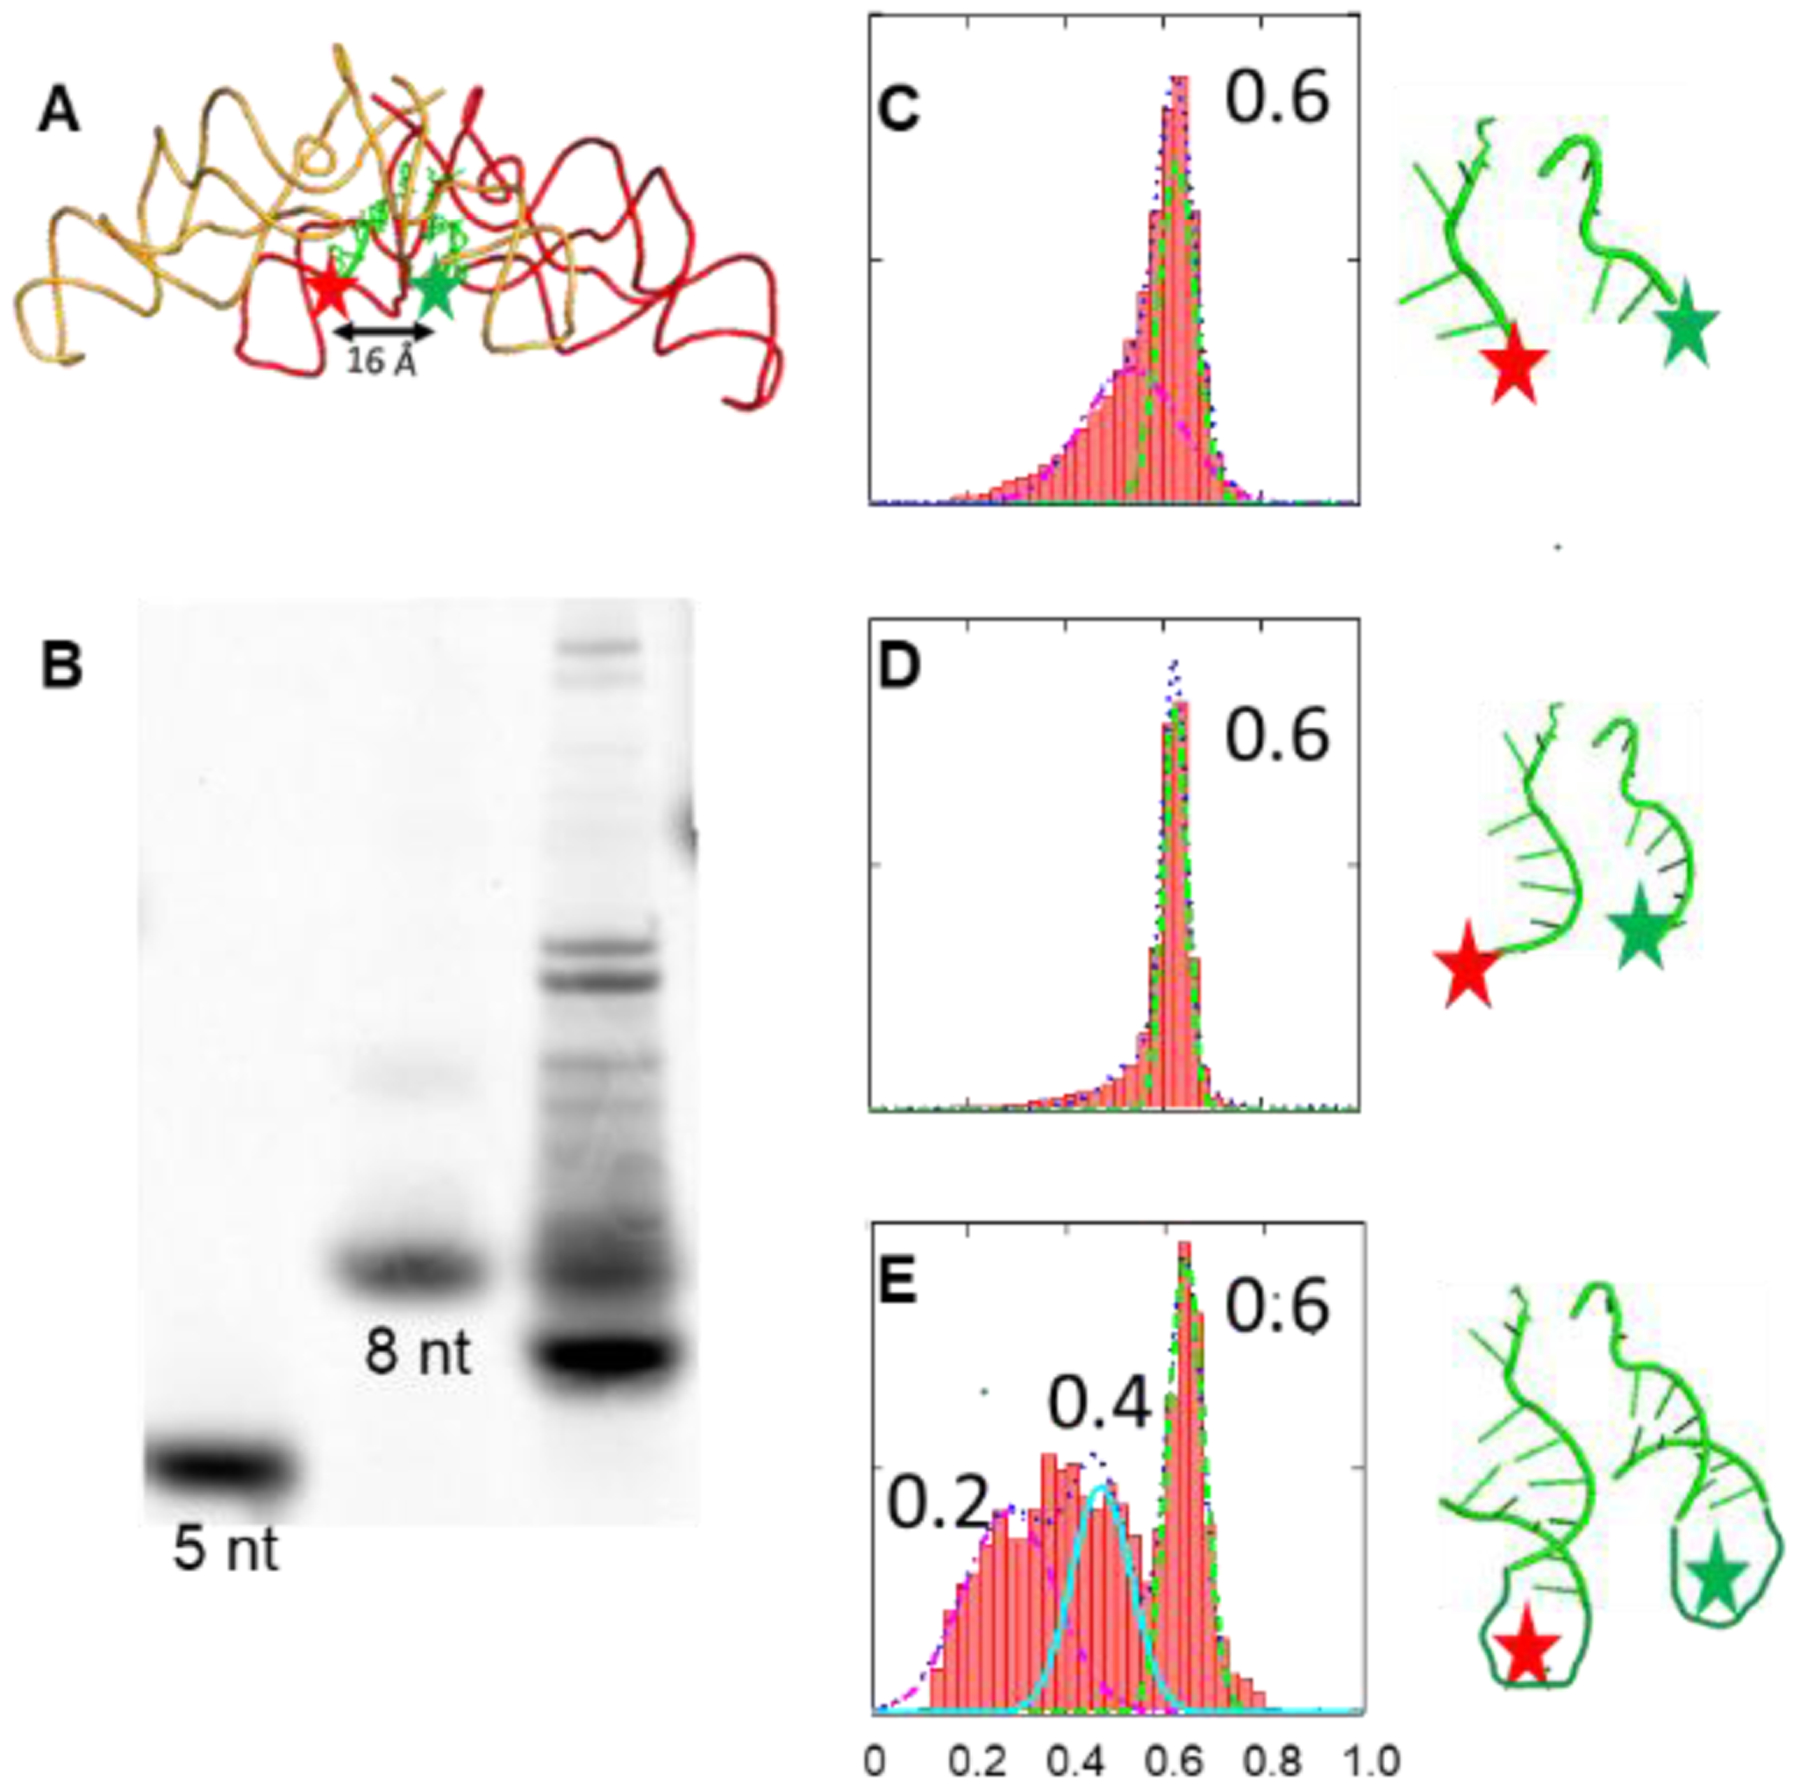
FRET efficiency histograms between tRNA-like oligos at 10 mM of Mg2+. (A) Relative position of Cy3 (green star)/Cy5 (red star) labelled oligos. (B) 30% denaturing PAGE Gel assay of Cy5 labelled oligos. Lane 1: CA_DNA; Lane 2: ACCCACCA; Lane 3: Lys-tRNALys_T1. (C-E) FRET of uncharged CA_DNA ; charged Lys-tRNALys_T1; charged Lysine-minihelix.
In the smFRET experiments, we used PTC1b homo dimers as the RNA scaffold at 10 mM Mg2+. Three types of tRNA-mimics were used: uncharged CA_DNA (Figure 6C); Lys-tRNALys_T1 (Figure 6D); and Lysine-charged minihelix (Figure 6E, Mass Spec is shown in Figure S5). For all three substrates, high FRET species with a 0.6 value were formed, indicating close proximity of the tRNA-like molecules. Comparing the binding efficiencies of different oligos, the formation of the high FRET species was more uniform for the shorter substrates (Figures 6C and 6D), but less uniform for the minihelix (Figure 6E). Although Lys-tRNALys_T1 is not homogeneous, it is reasonable to assume that mainly small pieces of 8 nt or shorter contribute to the signal, because longer pieces were lesser in amount and bound less efficiently as suggested by Figure 6E. These results indicated that the optimal substrates for the RNA dimers were the shorter ones. In fact, when full length tRNA was used, no FRET signal was detected. These results implied that although the dimers could bind short tRNA-like oligos, they could not accommodate the full length tRNAs. This result was consistent with the coevolution theory that the tRNA precursor was probably much shorter than its current version [33, 34].
Mixing the tRNA-like molecules in the absence of the RNA scaffolds did not generate FRET signals, indicating that they are essential. FRET signals were not detected at 0 mM Mg2+ either. The 3-way junction motif was also necessary. As shown in Figure S6, two RNA molecules were generated via interrupting the bond between 51–52 residues of PTC_DNA’s sequence. In RNA1, the 3-way junction structure was still formed, but helix 3 was detached from helices 1 and 2. In RNA2, the hairpin structure was maintained. When these two RNAs were mixed at equal stoichiometry to repeat the experiments in Figure 6C, no FRET signal was detected. This experiment indicated that a 3-way junction with no interruption was essential to position the A-loop for substrate binding and eventually bring two substrates close [17].
In addition to the substrate pairs in Figure 6, we detected high FRET signals between Lys-tRNALys_T1 and uncharged minihelix (Figure S7), suggesting that the substrate selection was adaptable due to the absence of an mRNA template and loose dimerization structures. In addition, whether the substrate was charged did not affect the FRET signal, suggesting that the oligo binding did not involve amino acids. On the other hand, only correctly charged tRNAs were accommodated into the peptidyl transfer center of the ribosome, implying that the modern ribosome has drastically evolved to execute more sophisticated protein synthesis processes.
Conclusions
We have demonstrated, via multiple FRET labeling strategies, that RNA fragments of ~ 100nt derived from the ribosomal peptidyl transfer center can bind to short oligos in monomers and then bring these substrates to close proximity. This process likely involves dimerization, based on gel shift assay and literature, although traces of multimers cannot be ruled out [13, 15, 35]. Previously, we have shown that chloramphenicol, which is an antibiotic that binds to the peptidyl transfer center, can interfere with a short oligo binding to these RNA fragments but affects the dimerization to a lesser extent [16]. All of this evidence suggests that these RNA fragments applied the “proximity” catalytical mechanism like the ribosome, which is different than the mechanisms reported for other ribozymes with a low molecular weight [6, 8, 36]. Thus, the RNA scaffolds in this report could possibly be the candidate as an ancestor of the modern ribosome. Mg2+ and a 3-way junction motif were essential to carry this “proximity” mechanism. Although close proximity itself was not sufficient for the peptide ligation reaction, we demonstrated ribozyme activity via high resolution Mass Spec. A 9-mer poly-lysine was formed in one pot [16]. Instead of one peptide bond, 8 bonds were formed. Although the exact connection of these bonds is not clear, the tandem mass spectra strongly indicated that these are covalent bonds between lysines. Given the very simple components in one pot, they are highly likely to be peptide bonds. In addition, we have shown that a minihelix that is much larger than the “CCA” molecules can bind to the RNA scaffolds, though with less efficiency. Therefore, it seems that these very simple rRNA scaffolds, without joining into one piece, are stronger ribozymes than initially thought.
Supplementary Material
Highlight.
rRNA of ~100 nt dimerizes that suggests proto-ribosome formation
short t-RNA like oligos are brought to close proximity by the rRNA
smFRET and Gel shifting experiments indicate mainly dimer not multimer formation.
Acknowledgements
This work was supported by the National Institutes of Health [GM111452 to Y.W.]; and the Welch Foundation [E-1721 to Y.W.]. Funding for open access charge: National Institutes of Health.
Footnotes
Publisher's Disclaimer: This is a PDF file of an unedited manuscript that has been accepted for publication. As a service to our customers we are providing this early version of the manuscript. The manuscript will undergo copyediting, typesetting, and review of the resulting proof before it is published in its final form. Please note that during the production process errors may be discovered which could affect the content, and all legal disclaimers that apply to the journal pertain.
Conflicts of interest
There are no conflicts to declare.
References
- [1].Noller HF, Lancaster L, Mohan S, Zhou J, Ribosome structural dynamics in translocation: yet another functional role for ribosomal RNA, Q. Rev. Biophys, 50 (2017) e12. [DOI] [PubMed] [Google Scholar]
- [2].Davidovich C, Belousoff M, Wekselman I, Shapira T, Krupkin M, Zimmerman E, Bashan A, Yonath A, The Proto-Ribosome: an ancient nano-machine for peptide bond formation, Isr J Chem, 50 (2010) 29–35. [DOI] [PMC free article] [PubMed] [Google Scholar]
- [3].Agmon I, Bashan A, Zarivach R, Yonath A, Symmetry at the active site of the ribosome: structural and functional implications, Biol Chem, 386 (2005) 833–844. [DOI] [PubMed] [Google Scholar]
- [4].Nissen P, Hansen J, Ban N, Moore PB, Steitz TA, The structural basis of ribosome activity in peptide bond synthesis, Science, 289 (2000) 920–930. [DOI] [PubMed] [Google Scholar]
- [5].Zhang B, Cech TR, Peptidyl-transferase ribozymes: trans reactions, structural characterization and ribosomal RNA-like features, Chem Biol, 5 (1998) 539–553. [DOI] [PubMed] [Google Scholar]
- [6].Lohse PA, Szostak JW, Ribozyme-catalysed amino-acid transfer reactions, Nature, 381 (1996) 442–444. [DOI] [PubMed] [Google Scholar]
- [7].Illangasekare M, Sanchez G, Nickles T, Yarus M, Aminoacyl-RNA synthesis catalyzed by an RNA, Science, 267 (1995) 643–647. [DOI] [PubMed] [Google Scholar]
- [8].Anderson RM, Kwon M, Strobel SA, Toward ribosomal RNA catalytic activity in the absence of protein, J Mol Evol, 64 (2007) 472–483. [DOI] [PubMed] [Google Scholar]
- [9].Hsiao C, Mohan S, Kalahar BK, Williams LD, Peeling the onion: ribosomes are ancient molecular fossils, Mol. Biol. Evol, 26 (2009) 2415–2425. [DOI] [PubMed] [Google Scholar]
- [10].Bokov K, Steinberg SV, A hierarchical model for evolution of 23S ribosomal RNA, Nature, 457 (2009) 977–980. [DOI] [PubMed] [Google Scholar]
- [11].Hury J, Nagaswamy U, Larios-Sanz M, Fox GE, Ribosome origins: the relative age of 23S rRNA Domains, Orig Life Evol Biosph, 36 (2006) 421–429. [DOI] [PubMed] [Google Scholar]
- [12].Mears JA, Cannone JJ, Stagg SM, Gutell RR, Agrawal RK, Harvey SC, Modeling a minimal ribosome based on comparative sequence analysis, J Mol Biol, 321 (2002) 215–234. [DOI] [PubMed] [Google Scholar]
- [13].Bashan A, Agmon I, Zarivach R, Schluenzen F, Harms J, Berisio R, Bartels H, Franceschi F, Auerbach T, Hansen HA, Kossoy E, Kessler M, Yonath A, Structural basis of the ribosomal machinery for peptide bond formation, translocation, and nascent chain progression, Mol Cell, 11 (2003) 91–102. [DOI] [PubMed] [Google Scholar]
- [14].Agmon I, Auerbach T, Baram D, Bartels H, Bashan A, Berisio R, Fucini P, Hansen HA, Harms J, Kessler M, Peretz M, Schluenzen F, Yonath A, Zarivach R, On peptide bond formation, translocation, nascent protein progression and the regulatory properties of ribosomes. Derived on 20 October 2002 at the 28th FEBS Meeting in Istanbul, Eur J Biochem, 270 (2003) 2543–2556. [DOI] [PubMed] [Google Scholar]
- [15].Huang L, Krupkin M, Bashan A, Yonath A, Massa L, Protoribosome by quantum kernel energy method, Proc Natl Acad Sci U S A, 110 (2013) 14900–14905. [DOI] [PMC free article] [PubMed] [Google Scholar]
- [16].Xu D, Wang Y, Protein-free ribosomal RNA scaffolds can assemble poly-lysine oligos from charged tRNA fragments, Biochem. Biophys. Res. Commun, 544 (2021) 81–85. [DOI] [PMC free article] [PubMed] [Google Scholar]
- [17].Lescoute A, Westhof E, Topology of three-way junctions in folded RNAs, RNA, 12 (2006) 83–93. [DOI] [PMC free article] [PubMed] [Google Scholar]
- [18].Noller HF, Kop J, Wheaton V, Brosius J, Gutell RR, Kopylov AM, Dohme F, Herr W, Stahl DA, Gupta R, Waese CR, Secondary structure model for 23S ribosomal RNA, Nucleic Acids Res, 9 (1981) 6167–6189. [DOI] [PMC free article] [PubMed] [Google Scholar]
- [19].Hermann T, Westhof E, Non-Watson-Crick base pairs in RNA-protein recognition, Chem Biol, 6 (1999) R335–343. [DOI] [PubMed] [Google Scholar]
- [20].Lin J, Gagnon MG, Bulkley D, Steitz TA, Conformational changes of elongation factor G on the ribosome during tRNA translocation, Cell, 160 (2015) 219–227. [DOI] [PMC free article] [PubMed] [Google Scholar]
- [21].Lescoute A, Westhof E, The interaction networks of structured RNAs, Nucleic Acids Res, 34 (2006) 6587–6604. [DOI] [PMC free article] [PubMed] [Google Scholar]
- [22].Westhof E, Westhof’s rule, Nature, 358 (1992) 459–460. [DOI] [PubMed] [Google Scholar]
- [23].Zuker M, Mfold web server for nucleic acid folding and hybridization prediction, Nucleic Acids Res, 31 (2003) 3406–3415. [DOI] [PMC free article] [PubMed] [Google Scholar]
- [24].Reuter JS, Mathews DH, RNAstructure: software for RNA secondary structure prediction and analysis, BMC Bioinformatics, 11 (2010) 129. [DOI] [PMC free article] [PubMed] [Google Scholar]
- [25].Altuntop ME, Ly CT, Wang Y, Single-molecule study of ribosome hierarchic dynamics at the peptidyl transferase center, Biophys J, 99 (2010) 3002–3009. [DOI] [PMC free article] [PubMed] [Google Scholar]
- [26].Lin R, Wang Y, Automated smFRET microscope for the quantification of label-free DNA oligos, Biomed Opt Express, 10 (2019) 682–693. [DOI] [PMC free article] [PubMed] [Google Scholar]
- [27].Lipfert J, Doniach S, Das R, Herschlag D, Understanding nucleic acid-ion interactions, Annu Rev Biochem, 83 (2014) 813–841. [DOI] [PMC free article] [PubMed] [Google Scholar]
- [28].Ha T, Rasnik I, Cheng W, Babcock HP, Gauss GH, Lohman TM, Chu S, Initiation and re-initiation of DNA unwinding by the Escherichia coli Rep helicase, Nature, 419 (2002) 638–641. [DOI] [PubMed] [Google Scholar]
- [29].Kim DF, Green R, Base-pairing between 23S rRNA and tRNA in the ribosomal A site, Mol Cell, 4 (1999) 859–864. [DOI] [PubMed] [Google Scholar]
- [30].Samaha RR, Green R, Noller HF, A base pair between tRNA and 23S rRNA in the peptidyl transferase centre of the ribosome, Nature, 377 (1995) 309–314. [DOI] [PubMed] [Google Scholar]
- [31].Rivas M, Fox GE, Further Characterization of the Pseudo-Symmetrical Ribosomal Region, Life (Basel), 10 (2020). [DOI] [PMC free article] [PubMed] [Google Scholar]
- [32].Hsiao C, Williams LD, A recurrent magnesium-binding motif provides a framework for the ribosomal peptidyl transferase center, Nucleic Acids Res, 37 (2009) 3134–3142. [DOI] [PMC free article] [PubMed] [Google Scholar]
- [33].Di Giulio M, Was it an ancient gene codifying for a hairpin RNA that, by means of direct duplication, gave rise to the primitive tRNA molecule?, J. Theor. Biol, 177 (1995) 95–101. [DOI] [PubMed] [Google Scholar]
- [34].Nagaswamy U, Fox GE, RNA ligation and the origin of tRNA, Orig Life Evol Biosph, 33 (2003) 199–209. [DOI] [PubMed] [Google Scholar]
- [35].Bou-Nader C, Zhang J, Structural Insights into RNA Dimerization: Motifs, Interfaces and Functions, Molecules, 25 (2020). [DOI] [PMC free article] [PubMed] [Google Scholar]
- [36].Zhang B, Cech TR, Peptide bond formation by in vitro selected ribozymes, Nature, 390 (1997) 96–100. [DOI] [PubMed] [Google Scholar]
Associated Data
This section collects any data citations, data availability statements, or supplementary materials included in this article.


