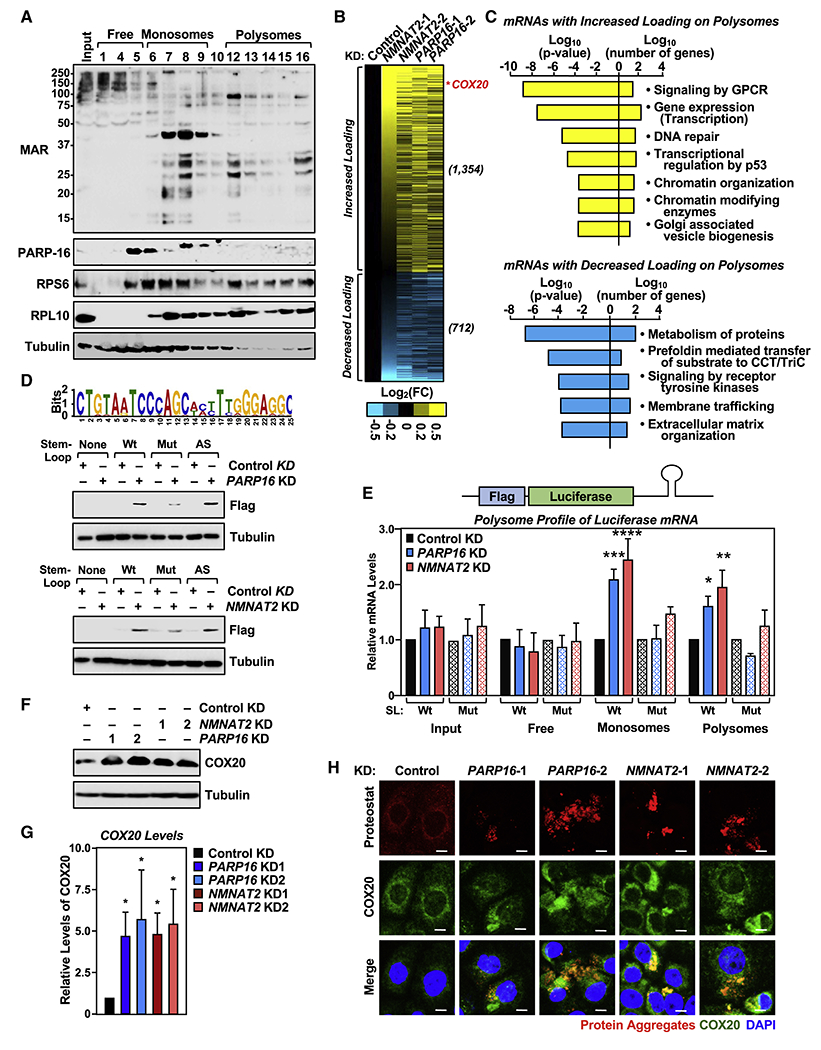
Figure 5. Ribosomal protein MARylation regulates polysome function through 3’ UTR stem-loop structures in mRNAs.

(A) Ribosomal protein MARylation is enriched in the monosome and polysome fractions of OVCAR3 cells. Western blot analysis for MAR and PARP-16 of the sucrose density gradient fractions prepared from OVCAR3 cells. RPS6 and RPL10 were used as markers for the small and large ribosomal subunits, respectively.
(B and C) Depletion of NMNAT-2 or PARP-16 alters mRNA loading on polysomes. RNA-sequencing assay of mRNAs associated with polysomes isolated from OVCAR3 cells subjected to NMNAT2 or PARP16 knockdown. (B) Heatmap representation of mRNAs that exhibited altered loading on the polysomes when NMNAT-2 or PARP-16 were depleted. (C) Gene GO analysis of these mRNAs.
(D) Identification of a transferable stem-loop motif in the 3’UTRs of mRNAs enriched on polysomes after NMNAT2 or PARP16 knockdown. (Top panel) Sequence of the motif with the highest score. (Bottom panels) The stem-loop motif in the 3’UTR of Flag-luciferase mRNA is required for translational regulation by PARP-16 and NMNAT-2. Western blot analysis for Flag-luciferase of lysates from PARP16 or NMNAT2 knockdown OVCAR3 cells that were transfected with the indicated Flag-luciferase constructs.
(E) Addition of the stem-loop motif to the 3’UTR regulates polysome loading of Flag-luciferase mRNA. RT-qPCR analysis of Flag-luciferase mRNA isolated from the density gradient fractions corresponding to free ribosomal subunits, monosomes, and polysomes from PARP-16 or NMNAT-2 depleted OVCAR3 cells. Each bar in the graph represents the mean ± SEM of the relative Flag-luciferase mRNA levels (n = 3, two-way ANOVA, * p < 0.05, ** p < 0.01, *** p < 0.001, ****p < 0.0001).
(F and G) Depletion of PARP-16 or NMNAT-2 enhances COX20 protein levels. (F) Western blot analysis for COX20 in OVCAR3 cells subjected to PARP16 or NMNAT2 knockdown. Each bar in the graph in (G) represents the mean ± SEM of the ratio of the levels of COX20 to tubulin (n = 3, two-way ANOVA, * p < 0.05).
(H) Depletion of PARP-16 or NMNAT-2 promotes the accumulation of COX20 protein aggregates in OVCAR3 cells. Co-staining of protein aggregates using Proteostat aggresome detection reagent and COX20 in OVCAR3 cells subjected to PARP16 or NMNAT2 knockdown. Scale bar = 25 μm.
See also Figure S6.
