

SUMMARY
The emerging ‘epitranscriptomics’ field is providing insights into the biological and pathological roles of different RNA modifications. The RNA methyltransferase METTL1 catalyzes N7-methylguanosine (m7G) modification of tRNAs. Here we find METTL1 is frequently amplified/overexpressed in cancers and associates with poor patient survival. METTL1 depletion causes decreased abundance of m7G-modified tRNAs, altered cell cycle, and inhibits oncogenicity. Conversely, METTL1 overexpression induces oncogenic cell transformation and cancer. Mechanistically, we find increased abundance of m7G-modified tRNAs, in particular Arg-TCT-4-1, and increased translation of mRNAs including cell cycle regulators that are enriched in the corresponding AGA codon. Accordingly, Arg-TCT expression is elevated in many tumor types, associates with patient survival, and strikingly, overexpression of this individual tRNA induces oncogenic transformation. Thus, METTL1-mediated tRNA modification drives oncogenic transformation via a remodeling of the mRNA ‘translatome’ to increase expression of growth-promoting proteins and represents a promising anti-cancer target.
Keywords: N7-methylguanosine, m7G, METTL1, tRNA, translation, oncogene, cancer, Arg-TCT
GraphicalAbstract
eTOC Blurb
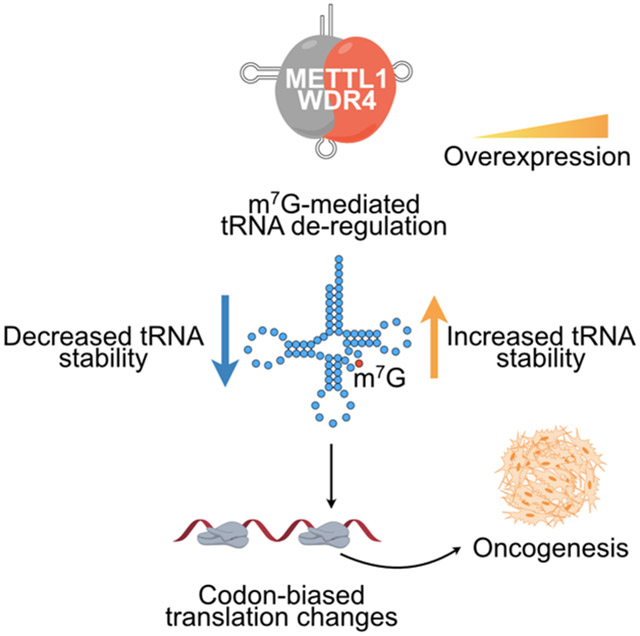
Orellana et. al demonstrate that overexpression of the m7G RNA methyltransferase METTL1 induces oncogenic cell transformation and cancer. Moreover, the increased abundance of m7G-modified tRNAs, in particular Arg-TCT-4-1, leads to increased translation of mRNAs involved in cell growth that are enriched in the corresponding AGA codon.
INTRODUCTION
Recent studies of the ‘epitranscriptome’ reveal important roles of different RNA modifications in cancer (Saletore et al., 2012; Torres et al., 2014). For example, METTL3, a N6-methyladenosine (m6A) writer that modifies a large subset of mRNAs is oncogenic when overexpressed (Barbieri et al., 2017; Chen et al., 2017; Choe et al., 2018; Lin et al., 2016; Vu et al., 2017). tRNAs are subject to numerous modifications including methylation, which controls tRNA folding, stability, and function (Alexandrov et al., 2002; Chou et al., 2017; de Crecy-Lagard et al., 2019), and dysregulation is linked to developmental disorders and cancers (Delaunay and Frye, 2019; Kirchner and Ignatova, 2015; Torres et al., 2014). For example, deposition of N5-methylcytosine (m5C) by NSUN2 (Blanco et al., 2016; Frye and Watt, 2006), and mcm5s2U modification at tRNA nucleotide position 34 play important roles in cancer (Delaunay and Frye, 2019), including resistance to therapy (Rapino et al., 2018). m5C and N7-methylguanosine (m7G) tRNA modification by NSUN2 and METTL1, respectively, has been implicated in 5-fluorouracil (5-FU) sensitivity in HeLa cells (Okamoto et al., 2014). Together, these studies reveal that aberrant RNA modifications can influence tumor initiation and growth. There is also evidence linking dysregulation of individual tRNAs with disease. Overexpression of tRNAi-Met leads to increased metabolic and cell growth rates in immortalized human breast cells (Pavon-Eternod et al., 2009), promotes melanoma metastasis (Birch et al., 2016), and increases tumor growth and vascularization in mice (Clarke et al., 2016). Overexpression of tRNA-Glu(UCC) or tRNA-Arg(CCG) promotes a pro-metastatic state in breast cancer (Goodarzi et al., 2016). Furthermore, deficiency of the Arg-TCT-4-1 isodecoder that is highly expressed in the central nervous system (CNS) causes neurodegeneration and death in mice (Ishimura et al., 2014).
m7G at tRNA nucleotide position 46 (m7G46) is one of the most prevalent tRNA modifications (Alexandrov et al., 2005; Alexandrov et al., 2002). m7G46 is found in the variable loop region of a subset of tRNAs, and the tRNA-Phe structure shows a C13–G22-m7G46 base triple interaction that helps stabilize the tertiary structure (Jovine et al., 2000). Mutation of the yeast m7G methyltransferase causes rapid tRNA decay (RTD) of hypomodified tRNAs and growth defects under heat stress (Alexandrov et al., 2006). m7G tRNA modification is catalyzed by a heterodimeric protein complex (Leulliot et al., 2008) that in mammals comprises the Methyltransferase like-1 protein (METTL1) and the WD Repeat Domain 4 (WDR4), and is required for mouse embryonic stem cell self-renewal and differentiation (Lin et al., 2018). METTL1 may also deposit internal m7G marks in mRNAs (Chu et al., 2018; Zhang et al., 2019) and miRNA precursors (Pandolfini et al., 2019). METTL1 has not yet been functionally implicated in oncogenesis, but is recurrently overexpressed and amplified and was recently found to be upregulated in hepatocellular carcinoma (HCC) and associates with poor outcomes (Tian et al., 2019). Conversely, METTL1 was suggested as a potential tumor suppressor in colon cancer (Liu et al., 2020b), whilst the overall relevance of METTL1 in cancer remains largely unknown.
Herein, we show that the methyltransferase complex METTL1/WDR4 is oncogenic. METTL1 deficiency leads to reduced m7G tRNA methylation and expression, global translation and cell cycle defects, and suppression of tumor growth in various xenograft models including GBM, LPS, melanoma, and acute myeloid leukemia (AML). Overexpression of METTL1/WDR4 leads to malignant transformation and tumorigenesis. Mechanistically, we find that elevated m7G tRNA modification upon METTL1 gain-of-function leads to increased abundance of a tRNA subset including Arg-TCT-4-1, one of five isodecoder tRNAs (six in human) responsible for decoding AGA codons, and the corresponding increased translation of mRNAs that are enriched in AGA codons including those related to the cell cycle. Reporter assays show that overexpression of METTL1 or Arg-TCT-4-1 promotes optimal expression of transcripts enriched with AGA codons. We show that tRNA-Arg-TCT-4-1 upregulation phenocopies the METTL1/WDR4 overexpression phenotype and causes malignant transformation and oncogenesis. Accordingly, we identify specific alterations in the proteome upon METTL1 or tRNA-Arg-TCT-4-1 overexpression. This study reveals the functional role and underlying molecular and cellular mechanism of METTL1/WDR4 and m7G RNA modification in malignant transformation and highlights its potential as a therapeutic target.
RESULTS
METTL1 is amplified and overexpressed in human cancers and associates with poor patient survival.
METTL1 is located on a region of chromosome 12 (12 q13-14) that is frequently amplified in cancers (Bahr et al., 1999; Wikman et al., 2005). Examination of The Cancer Genome Atlas (TCGA) revealed that METTL1 is amplified in ~13% of GBM and ~17% of SARC patients, and commonly amplified in other tumor types (Fig. S1A). Within the SARC group, METTL1 amplification is especially common in (~70%) LPS. There is a positive correlation between METTL1 mRNA expression and amplification of the locus (Fig. S1B), and high levels of METTL1 mRNA expression are associated with poor patient survival (Fig. S1C, D). Immunohistochemical staining revealed increased METTL1 and WDR4 protein expression in GBM tumors compared with normal cerebral tissue (Fig. S1E). Furthermore, even in cancers without frequent amplification of the locus, METTL1 expression is significantly elevated in most types of cancer compared to normal cells/tissues including AML (Fig. S1F-H, and S2A). Western blot confirmed increased METTL1 protein expression in patient-derived AML samples compared to normal human CD34+ cord blood cells (Fig. S1G), and METTL1 is highly expressed in primary murine AML cells compared to their isogenic normal or non-leukemic hematopoietic stem and progenitor cells (HSPCs) (Fig. S1H). METTL1 mRNA expression is also positively correlated with elevated expression of WDR4 mRNA (Fig. S2B), and METTL1 mRNA and protein levels are positively correlated in various cancer types (Fig. S2C). Considering this we explored METTL1 amplification in human GBM cell lines using copy number data from the Cancer Cell Line Encyclopedia (CCLE) (Fig. S2D) and identified and validated LNZ308 (Fig. S2E) as a GBM cell line with METTL1 amplification. We also performed the same analysis on a panel of human LPS cell lines and identified LP6, LPS853, and 93T449 with METTL1 amplification (Fig. S2F). Western blots show that the level of METTL1 and WDR4 are elevated in these LPS cell lines compared to normal human pre-adipocytes (Fig. S2G). Taken together, the cancer genetics data and expression analyses implicate METTL1 in various cancers.
METTL1 is required for cancer cell growth and tumorigenicity.
We explored the function of METTL1 in the regulation of cancer cell survival using CRISPR/Cas9-mediated METTL1 and WDR4 knockout (KO). Using a large panel of human cancer cell lines (Fig. 1A, S3A) we found that loss of METTL1 or WDR4 is detrimental for overall cancer cell growth. METTL1 deletion also resulted in strong inhibition of cell growth in primary murine AML cells but not in their isogenic non-leukemic HSPCs (Fig. S3B-C), and significantly suppressed colony formation of leukemic stem cells but had negligible effect on the clonogenic potential of normal murine HSPCs (Fig. S3D). In line with this observation, normal human CD34+ cord blood cells did not show decreased colony formation efficiency upon METTL1 knockdown (KD) (Fig. S3E). To evaluate the effect of Mettl1 KO in normal hematopoiesis we performed competitive transplantation experiments, observing no significant difference in the chimerism and the haemopoietic reconstitution between normal HSPCs harboring an empty or a Mettl1 gRNA, while Mettl1 KO was importantly confirmed 8 weeks post-transplantation (Fig S3F). Our results indicate that Mettl1 KO has limited or no effect in normal mouse hematopoiesis. We next tested the role of METTL1 in AML progression in vivo by performing mouse xenograft experiments using human MOLM-13-Cas9 AML cells stably expressing a luciferase reporter. METTL1 KO and control cells (Fig. S4A) were transplanted into immunocompromised Rail (Rag2−/− IL2RG−/−) mice and in vivo AML expansion was monitored by whole-body measurement of bioluminescence. METTL1 knockout results in ablation of cancer progression in vivo and increase of overall mouse survival (Fig. 1B). We next tested whether altered cell cycle could explain these cell growth phenotypes in cell culture (Fig. S4B) and in vivo (Fig. 1C). Cell cycle analysis revealed that METTL1-KO human AML MOLM-13 and OCI-AML-3 cells have an increased percentage of cells in the G1-phase and decreased percentage of cells in S-phase suggesting that deletion of METTL1 results in impaired G1/S transition (Fig. 1C, S4B). Similar results were obtained in a mouse melanoma model using B16F10 cells with a doxycycline (Dox) inducible shRNA against METTL1 (Fig. S4C-F). We further generated shRNA-mediated stable METTL1 knockdown (KD) in the LNZ308 human GBM cell line (Fig. S5A). METTL1 knockdown led to decreased cell proliferation (Fig. S5B), a phenotype that could be rescued by reintroduction of the WT METTL1 cDNA but not of a catalytically inactive mutant METTL1 (Fig. 1D-F), supporting that rapid cancer cell proliferation is dependent on m7G RNA modification. Biochemical reconstitution and m7G activity assays with WT or L160A,D163A version of the METTL1/WDR4 complex confirmed that the activity of the mutant is severely compromised (Fig. S5C). Cell cycle analysis revealed that METTL1-deficient LNZ308 cells have an increased percentage of cells in the G1 phase (Fig. 1F) without an obvious effect on apoptosis (Fig. S5D). METTL1 depletion also resulted in decreased anchorage independent growth of LNZ308 cells (Fig. S5E). We next tested the requirement of METTL1 for tumor formation in vivo by performing mouse xenograft experiments and measuring tumor formation after subcutaneous transplantation into nude mice. Strikingly, we found that METTL1 knockdown completely suppressed tumorigenesis in vivo (Fig. 1G, S5F). Similar results were also obtained for the T98G human GBM cell line (Fig. S5G-H) and a panel of human LPS cell lines (Fig. S6A-E). Overall, our data support an important role of METTL1 in controlling cancer cell growth, cell cycle, and oncogenicity.
Figure 1. METTL1 is necessary for cancer cell growth and oncogenicity.

(A) Competitive co-culture of lentiviral METTL1 or WDR4 or Empty gRNA-transfected (BFP positive) vs untransfected panel of human AML cell lines normalized to %BFP on day 4 (mean ± s.d., n = 2). (B) Bioluminescence imaging of mice transplanted with luciferase-expressing MOLM-13 cells, at the indicated timepoints, upon transduction with METTL1 or control gRNAs. Quantification of bioluminescence and Kaplan–Meier plot showing the mouse survival. A log-rank test was performed. (n = 5 animals per group). **P < 0.01. (C) BrdU staining and in vivo cell cycle analysis in gRNA transduced MOLM-13 cells at day 10 post-transplantation. (D) Western blot showing METTL1 ectopic expression in stable METTL1 knockdown (KD) human GBM cells (LNZ308). (E) Cell proliferation analysis of KD cells expressing wild type or mutant METTL1. Error bars: means ± s.d. Each experiment corresponds to n=3, Each experiment was repeated 3 times. ****P < 0.0001, ns, not significant. Two-way analysis of variance (ANOVA) and Bonferroni correction. (F) Cell cycle analysis of LNZ308 cells comparing sh-METTL1 versus shGFP control. (G) In vivo tumor formation of LNZ308 cells (n = 5; error bars: means ± SEM). ****P < 0.0001. Two-way analysis of variance (ANOVA) and Bonferroni correction.
METTL1 depletion leads to decreased levels of m7G-modified tRNAs and global translation defects.
In order to understand the molecular mechanism behind the cell growth defects seen in METTL1 knockdown cells we deployed our recently developed sequencing tool, TRAC-seq (Lin et al., 2019; Lin et al., 2018), to explore the m7G methylome. We identified a subset of 25 tRNAs that are m7G-modified in LNZ308 cells (Fig. 2A, and S7A) and share the RAGGU motif (Fig. S7B). We validated several of these m7G tRNAs using NaBH4/Aniline cleavage (Fig. S7C) and m7G methylated RNA immunoprecipitation (meRIP) (Fig. S7D) followed by Northern blot analyses. We observed a decrease in the abundance of the m7G-modified tRNA subset in the METTL1 KD compared to the control cells (Fig. 2B, Table S1) further confirmed by Northern blot (Fig. 2C). We next measured m7G levels in METTL1 KD RNA samples compared to shGFP control samples using high performance liquid chromatography with tandem mass spectrometry (HPLC-MS/MS) and observed a decrease in the overall levels of m7G/G (Fig. 2D). In line with this observation, there is an overall decrease in the TRAC-Seq cleavage scores in shMETTL1 samples compared to the shGFP control that is correlated with the decrease in tRNA abundance in METTL1 KD cells (Fig. S7E). Interestingly, we observed a strong decrease in the levels of tRNAi-Met (m7G-modified) suggesting the possibility that there could be a global defect in translation initiation. Metabolic labeling using [35S] Methionine further supported compromised protein synthesis in METTL1 KD cells (Fig. 2E, S7F). Indeed, SILAC proteomics also revealed a widespread decrease in protein synthesis (1,177 significantly downregulated proteins out of 3,047 proteins detected) in METTL1 KD cells compared to shGFP control cells (Fig. 2F, Table S2). Taken together, these data indicate that METTL1 deficiency causes loss of m7G tRNA modification, decreased stability of hypomodified tRNAs, and global translation defects.
Figure 2. METTL1 depletion leads to decreased levels of m7G-modified tRNAs and global translation defects.

(A) Subset of m7G modified tRNAs identified in human GBM cells LNZ308. (B) Changes in tRNA abundance upon METTL1 knockdown. (C) tRNA levels measured via Northern blot. (D) HPLC-MS/MS analysis of total RNA comparing sh-METTL1 samples versus shGFP control samples. Error bars: means ± s.d. Each experiment corresponds to n=3. P-value from Paired Student’s t-test. (E) [35S] Methionine incorporation measured via liquid scintillation. CPM: counts per minute. N = 3, Paired Student’s t-test. (F) Changes in protein abundance between METTL1/WDR4 (heavy) overexpressing cells and empty vector (light) control cells measured by SILAC-based proteomics n=3, moderated t-test.
METTL1/WDR4 overexpression drives oncogenic transformation and tumorigenesis.
To explore whether METTL1 can act as an oncogene we next performed gain-of-function experiments in different cellular contexts. We found that overexpression of METTL1-WT but not the catalytic mutant version (L160A,D163A: Mut) results in increased proliferation of human AML cell lines (Fig. 3A,S8A). Moreover, CRISPR activation of endogenous METTL1 also results in increased AML cell proliferation (Fig. 3B, S8B). Ectopic expression of METTL1 (but not the catalytic mutant) is also highly oncogenic in primary murine non-leukemic HSPCs (Fig. 3C). Next, we expressed METTL1 in non-transformed mouse embryonic fibroblasts (MEF-WT cell line with SV40 T antigen). For that purpose, we generated stable clones that overexpress METTL1 and WDR4 (Fig. S8C). We observed increased cell proliferation and ability to form colonies in soft agar in cells overexpressing the wild type but not the catalytic mutant METTL1 complex (Fig. 3-F). Cell cycle analyses of METTL1/WDR4 overexpressing cells revealed that over time S-phase BrdU-labeled cells (0 hours) transitioned from 2N DNA to 4N DNA (G2) content and after undergoing mitosis transitioned to 2N DNA (G1) faster than empty-vector control cells suggesting that METTL1/WDR4 overexpression accelerates cell cycle progression (Fig. 3G-H, S8D). We also found that METTL1-Wt cells are able to form large tumors in vivo within 18 days after transplantation into nude mice (Fig. 3I, S8E). Taken together, these data provide evidence that METTL1 is an oncogene.
Figure 3. METTL1 overexpression is highly oncogenic.

(A) Proliferation assay using MOLM-13 and THP-1 cells after overexpression of METTL1 (WT and catalytic-dead) and compared to empty control (mean ± s.d., n = 3). *P < 0.05. (B) Competitive co-culture of human AML MOLM-13-dCas9 cells post-transduction with either METTL1 or Empty gRNA (BFP positive) vs untransfected panel, normalized to %BFP on day 4 (mean ± s.d., n = 2). (C) Colony formation assay of primary non-leukemic NrasG12D/+ lineage negative HSPCs, upon ectopic expression of WT and catalytic-mutant METTL1 compared to empty control. CFU, colony forming units; n.s., not significant; *p < 0.01 (t-test). (D) Representative cell proliferation analysis of METTL1-Wt/WDR4 overexpressing cells compared to METTL1-Mut/WDR4 and empty vector cells negative control cells. Error bars: means ± s.d. Each experiment corresponds to n=3, Each experiment was repeated 3 times. ****P < 0.0001, ns, not significant. Two-way analysis of variance (ANOVA) and Bonferroni correction. (E) Colony formation in soft agar: representative pictures. (F) Quantification of colony formation in soft agar. Error bars: means ± s.d. Each experiment corresponds to n=3, Each experiment was repeated 3 times. ****P < 0.0001, ns, not significant. One-way analysis of variance (ANOVA) and Bonferroni correction. (G) Cell cycle analysis of METTL1/WDR4 overexpressing cells versus empty control. DNA content (2N, >2N or 4N) was analyzed at different time points after BrdU labeling. Bars indicate the percentage of BrdU+ cells (0 hours) that transitioned from 2N DNA content to 4N DNA (G2) and after undergoing mitosis transitioned to 2N DNA. (H) DNA content analysis of BrdU+ cells of METTL1/WDR4 overexpressing cells versus empty vector control at 0 and 6 hours post labeling. (I) In vivo tumor formation (n = 5; error bars: means ± SEM). Error bars: means ± s.d. *P < 0.05, ns, not significant. One-way analysis of variance (ANOVA) and Bonferroni correction.
METTL1/WDR4 overexpression leads to increased abundance of m7G-modified tRNAs.
We used TRAC-Seq to gain a better understanding of the molecular mechanism that drives the malignant transformation seen in METTL1/WDR4 overexpressing cells. This approach identified a subset of 27 m7G-modified tRNAs in MEF-WT cells (Fig. 4A, and S9A). The same tRNA subset was found to be m7G-modified in negative control (empty vector), METTL1-Wt, and METTL1-Mut (Fig. 4B), and the same RAGGU motif was also enriched amongst samples (Fig. S9B). We validated several of these m7G tRNAs using NaBH4/Aniline cleavage (Fig. S9C) and m7G meRIP (Fig. S9D) followed by Northern blot. We observed increased levels of a subset of m7G modified tRNAs in the METTL1-Wt overexpressing samples compared to control including: Arg(TCT), Lys(CTT), Lys(TTT), Pro(TGG), Ala(AGC), and Met(CAT) (Fig. 4C, Table S3). We next measured m7G levels in METTL1-Wt/WDR4 overexpressing cells compared to empty vector control samples and observed an increase in the relative m7G/G levels (Fig. 4D). Taken together our results show that ectopic METTL1 expression leads to increased total levels of m7G modification but according to the TRAC-Seq this did not occur at new positions within modified tRNAs or extend to additional tRNAs that are not normally modified. Instead we find evidence that for particular tRNAs, the proportion that is m7G-modified is increased upon METTL1 overexpression. This is evidenced by increased NaBH4/Aniline cleavage seen by Northern blots (Fig. S9C,G), that also manifests as increased stability of tRNAs within the same set (Fig. 4C). Furthermore, for certain tRNAs including Arg-TCT-4-1 and Met-CAT the increased tRNA abundance is positively correlated with increased methylation (as measured by a change in the NaBH4/Aniline cleavage) in the METTL1-expressing cells (Fig. 4E). To validate this observation, we first measured m7G levels in isolated Arg-TCT tRNAs (Fig. S9E) from METTL1-Wt/WDR4 overexpressing cells compared to empty vector control samples via HPLC-MS/MS and observed an increase in the relative m7G/G levels (Fig. 4F). We also measured m7G levels in Arg-TCT using NaBH4/Aniline cleavage in a time-dependent manner to reach saturating conditions and observed that METTL1/WDR4 overexpression leads to increased tRNA cleavage (Fig. 4G,S9F) and elevated 3' fragment/full length ratio (EV=~56%; METTL1/WDR4=~72%) compared to control. To test whether METTL1 is the enzyme responsible for Arg-TCT m7G methylation using an antibody-independent method, we used the meCLICK approach followed by RT-qPCR in METTL1-WT or -KD MOLM-13 cells and observed that the level of Arg-TCT was restored in cells with METTL1 downregulation, suggesting that the methylation signal of the relevant tRNA was mediated mainly by the catalytic activity of METTL1 (Fig. S9G). This effect was not observed when meCLICK was applied to the non-m7G-modified tRNA His-GTG. Taken together, these data indicate that METTL1/WDR4 overexpression leads to increased m7G methylation of a subset of tRNA substrates, particularly Arg-TCT.
Figure 4. METTL1 overexpression accumulates a subset m7G-modified tRNAs.

(A) Subset of m7G modified tRNAs identified in mouse MEF-WT cells. (B) Overlap of m7G tRNAs among different conditions. (C) Changes in tRNA abundance upon overexpression of METTL1-WtWDR4. On the right, Arg-TCT-4 levels measured via Northern blot. (D) HPLC-MS/MS analysis of total RNA comparing METTL1/WDR4 overexpressing samples versus empty vector control samples. Error bars: means ± s.d. Each experiment corresponds to n=3. P-value from Paired Student’s t-test. (E) Correlation between tRNA abundance change and change in m7G methylation status measured as a change in NaBH4/Aniline cleaved tRNA fragments in METTL1-Wt/WDR4 vs Empty vector. Pearson correlation. (F) HPLC-MS/MS analysis of isolated Arg-TCT tRNA comparing METTL1/WDR4 overexpressing samples versus empty vector control samples. Oligo 1: Arg-TCT-1,2,3,5; Oligo 2: Arg-TCT-4. Error bars: means ± s.d. Each experiment corresponds to n=2. P-value from Paired Student’s t-test. (G) Quantification of m7G levels in Arg-TCT-4-1 using time-dependent NaBH4/Aniline cleavage followed by Northern blot in empty vector and METTL1/WDR4 OE samples (ratio between 3'fragment/full length).
METTL1/WDR4 overexpression leads to altered mRNA translation.
Considering the changes in tRNA abundance upon METTL1/WDR4 overexpression we reasoned that this could impact mRNA translation. Since metabolic labeling revealed no significant global change in translation between samples (Fig. S10A-B) we next used ribosome footprinting (Ribo-Seq) to evaluate codon usage and relative translation efficiencies (TE) in cells overexpressing METTL1/WDR4 and control cells. This revealed >2-fold changes in the TE of 864 mRNAs, with similar numbers of mRNAs with increased or decreased TE (Fig. 5A, Table S4). Next, we asked if there are differences in the overall codon usage between METTL1/WDR4-expressing and control cells using the CONCUR pipeline (Frye and Bornelov, 2020). Increased tRNA abundance and function is expected to lead to reduced ribosome dwell time at the cognate codon (Nedialkova and Leidel, 2015; Wu et al., 2019; Zinshteyn and Gilbert, 2013). Comparison of codon occupancy revealed that METTL1/WDR4 overexpression results in decreased ribosome interaction at m7G-tRNA-dependent codons in the charged tRNA binding site (A-site) including: AGA, ACT, TGC, as well as other m7G-modified tRNAs, and as a control there is little change in the A+1 site (Fig. 5B). This effect was more pronounced in the codon subset that is recognized by tRNAs with increased abundance upon METTL1 overexpression (Fig. 4C). Increased tRNA abundance is significantly associated with decreased A site occupancy (Fig. 5C-D). Ribo-seq data can also be interpreted as a proxy for overall translation efficiency (TE) for any particular gene when the ribosome-protected fragment (RPF) coverage across the entire mRNA coding sequence (CDS) (open reading frame) relative to the mRNA expression is analyzed. Considering this we compared the codon usage in the CDS (number of observed codons/number of expected codons [genome average] – normalized by length) between genes with increased TE and both genes with decreased TE and the global average (entire dataset) and found that several m7G decoded codons are enriched in TE-Up compared to both TE-down and the global average (Fig. 5E). This analysis revealed a significant enrichment of AGA, ACT, and AAA codons in the mRNAs with increased TE due to METTL1/WDR4 expression (Fig. 3G). These codons also show decreased A site occupancy (Fig. 5E), from which AGA shows the most pronounced decrease. Since AGA codons showed decreased ribosome occupancy and genes enriched with AGA codons have higher TE in METTL1 overexpressing cells compared to control, we next tested if AGA codons could lead to ribosome pausing. To test this, we measured the ribosome pauses (RPFs density at a particular codon relative to background density) at AGA codons and found that control cells have more pauses (170 vs. 99) and significantly higher AGA pause scores compared to METTL1-expressing cells (Fig. 5F). This result supports our hypothesis that changes in TE are related to an enrichment of AGA m7G tRNA decoded codons in mRNAs that are decoded with more efficiency in METTL1 overexpressing cells. Gene ontology analysis revealed that mRNAs with altered TE in the METTL1/WDR4 expressing cells function in cell cycle progression providing further support for the involvement of METTL1-mediated m7G tRNA modification and corresponding changes in TE in the regulation of the cell growth phenotypes observed (Fig. 5G). Furthermore, AGA was the highest enriched codon in the list of cell cycle mRNAs with increased TE versus both decreased TE and global average (Fig. S10C), suggesting that the increased abundance of the corresponding Arg-TCT tRNA might play an important role in the cell cycle and proliferation changes caused by METTL1/WDR4 expression (Fig. 5G). Moreover, when we examined AGA codon usage and ranked all (19,859) mRNAs in the human genome based on the number of AGA codons they contain we found that; 1) AGA is not a rare codon amongst the six possible codons for Arginine (Fig. S10D), 2) that there are a small number of genes with many AGA codons (Fig. S10D), and 3) Gene ontology of the top 1% of mRNAs (170) containing the most AGA codons (ranging in number from 47 to 717 AGA codons within the open reading frame) are significantly enriched for cell cycle mRNAs (Fig. S10E), thereby providing additional evidence that Arg-TCT, particularly the Arg-TCT-4-1 isodecoder, is especially important for the mRNA translation of certain genes involved in cell cycle control. This connection is specific to AGA since the same analysis for other Arg codons did not identify an enrichment for cell cycle genes (data not shown). Overall, our results identify a critical role of the METTL1 and the m7G tRNA methylome in regulating the translation of several cell-cycle-related genes and identify a small subset of tRNAs including Arg-TCT-4-1 that might be especially important for altered TE and METTL1-mediated oncogenesis.
Figure 5. METTL1/WDR4 overexpression leads to translational changes.

(A) Scatterplot of translation efficiency (TE) in METTL1-Wt/WDR4 OE versus empty vector cells. TE was calculated by dividing the ribosome-protected fragments (RPF) signals to the input RNA-seq signals. (B) Ribosome occupancy at individual codons at A sites and A+1 sites. Plots represent the relative ribosome protected fragment signals from METTL1/WDR4 relative to empty vector control cells. The codons are separated into m7G (red) and not m7G-modified (black) groups. The codons in red correspond to the group of codons with corresponding tRNAs increased in abundance upon METTL1/WDR4 overexpression. Dots in pink represent codons decoded by m7G tRNAs by wobble effect due to the undetected levels of their corresponding tRNAs. (C) Overall codon occupancy among the group of codons with corresponding tRNAs increased in abundance (Up), other m7G decode codons whose tRNAs don’t show changes in abundance (Non) and non-m7G dependent codons (Other). P values from one -way ANOVA, *P < 0.05; n.s. not significant. (D) Pearson correlation analysis between A site occupancy and tRNA abundance changes. (E) Scatterplot of codon usage changes in the differentially translated genes (Up vs Down and Up-vs All other) in METTL1/WDR4 OE cells. Dots in red indicate m7G decoded codons. On the right, comparison of AGA codon usage between TE-Up genes versus all other genes. P value from Student’s t-test. (F) Analysis of ribosome pausing in AGA codons between empty vector and METTL1/WDR4 OE cells. P value was calculated from a two-sided Mann-Whitney test. (G) Gene ontology analysis of Reactome pathway enrichment using the TE downregulated and upregulated genes upon METTL1-Wt/WDR4 overexpression. (H) Scatterplot of codon usage changes in up-regulated (FC≥1.2) proteins in METTL1-Wt/WDR4 OE cells (Up vs Down and Up-vs All other) in METTL1/WDR4 OE cells. Dots in red indicate m7G decoded codons. On the right, comparison of AGA codon usage between up-regulated proteins versus down and non-change. P value from one-way ANOVA, ***P < 0.001; *P < 0.05.
METTL1/WDR4 overexpression leads to upregulation of proteins enriched with AGA codons.
We used SILAC-based quantitative proteomics to assess global protein expression in METTL1/WDR4 overexpressing cells compared to control. Using this method 4,305 proteins were identified with a false-discovery rate of <1%. Of these, 518 proteins that were significantly up-regulated and 744 down-regulated in METTL1/WDR4 overexpressing cells compared to control (p<0.05, moderated t-test and fold-change-FC≥1.2) (Fig. S10F, Table S5). We next examined if the changes in protein expression is due to enhanced usage of any particular codon. For this purpose, we compared the codon usage between up-regulated proteins and both down-regulated proteins and the global average (entire dataset) and found that several m7G decoded codons are enriched in TE-Up compared to both TE-down and the global average (Fig. 5H). This analysis revealed a significant enrichment of AGA and AAA codons in the upregulated proteins due to METTL1/WDR4 expression (Fig. 5H). In line with this, we found that mRNAs encoding the up-regulated proteins show higher AGA usage compared to unchanged and down-regulated proteins (Fig. 5H). These results support our previous finding that genes enriched with AGA codons are preferentially up-regulated in METTL1/WDR4 overexpressing cells. Taken together, these results suggest that Arg-TCT, an m7G-modified upregulated tRNA that decodes AGA is responsible for some of the changes in protein synthesis upon METTL1/WDR4 overexpression (Fig. 4C).
Altered tRNA expression in human tumors.
We next comprehensively analyzed the expression profiles of tRNAs from TCGA by re-analyzing miRNA-seq data across 15 cancer types including all samples with small RNA sequencing data for both tumor and normal tissues (Zhang et al., 2018). This analysis identified that 22 out of the subset of 25 m7G-modified tRNAs are dysregulated across different tumor types (Fig. 6A, Table S6). Most strikingly, Arg-TCT was the tRNA that is most highly upregulated in tumors versus normal tissue and this observation is true for almost all of the 15 cancer types analyzed (Fig. 6A, Table S6). Furthermore, this elevated Arg-TCT level in tumors correlates with METTL1 expression in the majority (17 out of 22) of cancer types analyzed (Fig. 6B and S11A), whereas the expression of other tRNAs including Thr-TGT (that did not increase in METTL1 overexpressing fibroblasts) was found not to correlate with METTL1 expression in SARC (Fig. S11B) or other tumor samples (not shown). Next, we analyzed the individual isodecoder expression profiles of tRNA-Arg-TCT from TCGA and identified that Arg-TCT-4-1 is one of the most dysregulated Arg-TCT isodecoders across multiple different tumor types (Fig. S11C). Moreover, we found evidence of increased Arg-TCT-4-1 abundance (Fig. S11D) in LPS cell lines with METTL1 amplification (Fig. S2F) compared with cells with no METTL1 amplification. This elevated expression of Arg-TCT associated with poor patient survival in SARC and several other types of cancer (Fig. 6C, and data not shown). Taken together, these data indicate that increased METTL1 expression in tumors correlates well with increased abundance of certain m7G-modified tRNAs and that many of the same changes in tRNA expression we observe in METTL1 expressing fibroblasts are recapitulated in clinical samples including increased Arg-TCT, Lys-TTT, Ile-AAT, Cys-GCA, and Met-CAT expression (Fig. 4C and 6A). This analysis also highlights Arg-TCT-4-1 as a possible tRNA that could mediate some of the oncogenic effects of METTL1 in several cancers.
Figure 6. tRNA-Arg-TCT-4-1 overexpression promotes malignant transformation.

(A) Altered tRNA (m7G subset) expression in human tumors compared to normal counterparts. Orange denotes up-regulation and blue down-regulation. Boxplot on right summarizes tumor types with up or down-regulation. (B) Pearson correlation analyses between METTL1 and Arg-TCT expression levels in 22 human tumors (see Fig. S11A). (C) Kaplan-Meier survival curve of SARC patients with low vs high Arg-TCT expression levels. Mean cut-off. Data: TCGA. Wilcoxon test. (D) Northern Blot showing Arg-TCT-4-1 overexpression in MEF-WT cells. (E) Scheme of Renilla sensor enriched with AGA codons. (F) Renilla reporter activity upon Arg-TCT overexpression. Renilla light units were normalized to firefly luciferase and empty vector was set to 1. Error bars: means ± s.d. Each experiment corresponds to n=3, Each experiment was repeated 3 times. One-way analysis of variance (ANOVA) with Bonferroni correction. **, p<0.01; ns, not significant. (G) Quantification of colony formation in soft agar. Error bars: means ± s.d. Each experiment corresponds to n=3, Each experiment was repeated 3 times. ****P < 0.0001, ns, not significant. One-way analysis of variance (ANOVA) and Bonferroni correction. (H) Representative pictures of colony formation in soft agar of MEF-WT cell overexpressing Arg-TCT-4-1 wild type or Arg-TCT-4-1 T34>C mutant. (I) Western blot analysis for METTL1 post-overexpression of WT or catalytic-dead METTL1 in primary non-leukemic NrasG12D/+ HSPCs. (J) Colony formation assay of primary non-leukemic NrasG12D/+ lineage negative HSPCs, upon ectopic expression of either METTL1 (WT and catalytic-dead) or Arg-TCT-4-1 compared to empty control (mean ± s.d., n = 3). CFU, colony forming units; n.s., not significant; *p < 0.01 (t-test). (K) Bioluminescence imaging of mice transplanted with luciferase-expressing MOLM-13 cells upon overexpression of either METTL1 (WT and catalytic-dead) or Arg-TCT-4-1 compared to empty control at the indicated timepoint. (L) Quantification of whole-body bioluminescence related to Figure 6K (mean ± s.d., n = 5). *P < 0.01. (M) Kaplan–Meier plot showing the survival time of the mice related to Figure 6K. A log-rank test was performed. (n = 5 animals per group). **P < 0.01.
Oncogenic role of Arg-TCT-4-1 tRNA.
Considering that Arg-TCT-4-1 is; 1) one of the most upregulated tRNAs in METTL1 overexpressing cells, 2) the most differentially expressed m7G-modified tRNA in tumors compared to normal tissue, 3) correlated with METTL1 expression in tumors and with poor patient survival, as well as our finding that the corresponding codon (AGA) is highly enriched in the mRNAs with increased TE in METTL1/WDR4 overexpressing cells, we next explored the effect of overexpression of this tRNA in translation and its possible role in oncogenic transformation. To test this, we engineered tRNA expression vectors by subcloning genomic sequence spanning the tRNA including ~300 nt upstream and ~100 nt downstream sequence (containing the endogenous PolIII promoter, upstream leader, tRNA, and downstream trailer sequences) to a lentivirus vector without a promoter. Ectopic expression of Arg-TCT-4-1 (Fig. 6D) and its aminoacylation status (Fig. S11E) was confirmed by Northern blotting. We next tested the functionality of the overexpressed tRNA and explored whether levels of Arg-TCT-4-1 might be limiting for maximal TE in untransformed fibroblasts. To this end we utilized a dual luciferase vector in which we converted all of the 13 Arginine codons in the Renilla Luciferase into AGA codons to generate an Arg-TCT reporter. Since in the unmodified Renilla Luciferase (WT) only 2/13 Arginine codons are AGA, we would expect overexpression of Arg-TCT-4-1 tRNA to have a greater effect on expression of the Renilla Luciferase from the Arg-TCT reporter than for the WT reporter (Fig. 6E). In both cases the Renilla luciferase was normalized to Firefly since none of the 20 Arginine codons in Firefly are AGA. We found that expression of Arg-TCT-4-1 tRNA specifically enhanced expression of the Arg-TCT reporter and this effect was dependent on overexpression of Arg-TCT-4-1 since expression of a control Arg-TCT-4-1 T34>C mutant tRNA (CCT anticodon) had no effect (Fig. 6F). Next, we tested whether upregulation of Arg-TCT-4-1 might promote oncogenic transformation of mouse embryonic fibroblasts as measured by anchorage independent growth. We found that overexpression of Arg-TCT-4-1 was able to enhance the number colonies in this assay (Fig. 6G-H), but not the control Arg-TCT-4-1 T34>C tRNA suggesting that at least some of the oncogenic effects of METTL1 are mediated through its increased expression of Arg-TCT-4-1 and its AGA decoding function. Furthermore, we found that Arg-TCT-4-1 overexpression is able to phenocopy METTL1 overexpression and is also highly oncogenic in primary murine non-leukemic NrasG12D/+ HSPCs (Fig. 6I-J). Interestingly, we found that Arg-TCT is highly expressed in two different primary murine AML models compared to their normal or isogenic non-leukemic HSPCs (Fig. S11F). Notably, ectopic overexpression of Arg-TCT-4-1 in human AML MOLM-13 cells resulted in increased cancer progression in vivo (Fig. 6K-L), and phenocopied METTL1-WT overexpression in overall survival (Fig. 6M). In summary, we identify Arg-TCT-4-1 as a key mediator of oncogenic transformation.
Arg-TCT-4-1 overexpression recapitulates METTL1/WDR4-mediated proteome changes.
We used SILAC-based quantitative proteomic analysis to assess global protein expression in Arg-TCT-4-1 overexpressing cells compared to control. 4,142 proteins were identified with a false-discovery rate of <1%. We identified 581 significantly up-regulated and 709 significantly down-regulated proteins in Arg-TCT-4-1 overexpressing cells compared to control (p<0.05, moderated t-test and fold-change>1.2) (Fig. 7A, Table S7). Comparing the changes in protein expression observed in METTL1/WDR4 expressing cells with Arg-TCT-4-1 overexpressing cells revealed a highly significant positive correlation (R=0.6332, p<0.0001) between the two proteomic sets (Fig. 7B). Furthermore, gene ontology analysis of both sets showed similar enrichment in diseases and biological functions, with ‘cancer’ identified as the most mutually-significant enriched term (Fig. 7C). Next we looked at the overlap of the up-regulated proteins (p<0.05, FC≥1.2) in both datasets and found 240 proteins in common which represents ~46% and ~41% of the pool of proteins up-regulated in METTL1/WDR4 and Arg-TCT-4-1 expressing cells, respectively (Fig. 7D). Gene ontology analysis revealed that commonly up-regulated proteins function in the regulation of cell cycle progression (Fig. 7E) similar to what we found by Ribo-seq analysis (Fig. 5G). We validated the expression changes of several proteins that were up-regulated in both datasets and have been implicated in oncogenesis in various cancers. This analysis included genes with different levels of enrichment of AGA codons like Cdk4 (AGA per 1K, mouse: 9.87, human: 13.16), Hmga2 (AGA per 1K, mouse: 38.46, human: 40.54), Ash2l (AGA per 1K, mouse: 12.82, human: 7.95), Setdb1 (AGA per 1K, mouse: 9.93, human: 7.74), and Ube2t (AGA per 1K, mouse: 19.51, human: 30.30). We observed increased protein levels at the western blot level (Fig. 7F) and minimal or no change at the transcript level using RT-qPCR (Fig. 7G). Moreover, we also found that HMGA2 and KDM1a (AGA per 1K, mouse: 6.86, human: 7.98) proteins are strongly upregulated in human AML MOLM-13 cells expressing WT METTL1 and Arg-TCT-4-1, but not in empty vector control or mutant METTL1 (Fig. S12A), while no significant change at the transcript level was detected (Fig. S12B). We then asked if the differences in the content of AGA codons could be responsible for the changes in protein abundance mediated by METTL1/WDR4 or Arg-TCT-4-1 overexpression. For this purpose we generated a fluorescent reporter based on fusion proteins of Hmga2-WT and codon modified Hmga2-MUT (All AGA codons changed to CGC) to mCherry in a bidirectional promoter vector that also expresses acGFP1 as an internal control (0 AGA codons) (Fig. S12C). The reason we chose this endogenous gene is that Hmga2 shows high number of AGA codons (AGA per 1K, mouse: 38.46, human: 40.54), it is one of the most dysregulated proteins in METTL1/WDR4 and Arg-TCT-4-1 proteomics dataset, and HMGA2 has been frequently involved in cancer. This fluorescent reporter shows that METTL1/WDR4 and Arg-TCT-4-1 overexpression leads to high mCherry/acGFP1 levels when it is fused to Hmga2 WT compared to the mutant version of Hmga2 that lacks AGA codons (AGA were mutagenized to CGC) (Fig. 7H, S12D). Taken together, these data show that the changes in protein synthesis observed in METTL1/WDR4 expressing cells can be recapitulated by overexpression of Arg-TCT-4-1.
Figure 7. tRNA-Arg-TCT-4-1 overexpression recapitulates METTL1/WDR4-mediated proteome changes.

(A) Changes in protein abundance between Arg-TCT-4-1 (heavy) overexpressing cells and empty vector (light) control cells measured by SILAC-based proteomics n=3, moderated t-test. (B) Pearson correlation analysis between fold changes in METTL1/WDR4 and Arg-TCT-4-1 overexpressing cells (3,873 proteins that were detected in both groups were included in the analysis). (C) Gene ontology analysis of differentially expressed proteins in METTL1/WDR4 and Arg-TCT-4-1 overexpressing cells. (D) Venn diagram showing the overlap of METTL1/WDR4 and Arg-TCT-4-1 proteomic datasets (p<0.05 and FC≥1.2). (E) Gene ontology analysis of the proteins in the overlap from (D). Representative western blot analysis of a set of proteins found to be up-regulated in METTL1/WDR4 and Arg-TCT-4-1 datasets in MEF-WT cells. (G) Relative mRNA expression measured via RT-qPCR in MEF-WT cells. RPLP0 was used as normalizer and EV samples were set to 1. n=3 with three technical triplicates, p values from unpaired Student’s t-test, ***P < 0.001; **P < 0.01; *P < 0.05. (H) mCherry/acGFP1 ratios measured by flow cytometry between mCherry-Hmga2-WT (5 out of 12 AGA codons) and mCherry-Hmga2-MUT (0 out of 12 AGA codons) reporters. Data are mean ± s.d. n=2. P values from two-way ANOVA with Šídák correction; **P < 0.01; *P < 0.05.
DISCUSSION
Here we identify METTL1 as a potent new oncogene that is frequently amplified and/or overexpressed in many human cancers. Remarkably, we furthermore find that an individual m7G-modified tRNA, Arg-TCT-4-1, is largely responsible for METTL1 oncogenicity. METTL1 knockdown or deletion strongly suppresses cancer cell proliferation, cell cycle progression, blocks tumor growth in a plethora of cancer models, and leads to a substantial decrease in the levels of tRNAs that harbor the m7G modification, and globally decreases mRNA translation, thereby highlighting METTL1 as a possible therapeutic target in multiple cancer types. To understand the role of METTL1-mediated m7G RNA methylation in the control of cell growth and to recapitulate METTL1 amplification/upregulation in human cancers, we performed METTL1 gain-of-function experiments in different cellular contexts. Strikingly, overexpression of the METTL1/WDR4 complex in MEFs leads to malignant transformation including increased cell proliferation, accelerated cell cycle progression, enhanced colony formation, and in vivo tumor formation. Overexpression of wild-type methyltransferase complex, but not catalytic dead mutant, leads to increased abundance of a small subset of tRNAs that are m7G modified. METTL1 overexpression did not result in a global change in translation but rather affected a relatively small subset of mRNAs. Ribo-Seq showed that overexpression of the wild-type methyltransferase complex causes changes in translation of genes involved in cell cycle that are enriched in AGA codons. Ectopic Arg-TCT-4-1 expression enhances MEF colony formation in soft agar, and phenocopies the effect of METTL1 expression in non-leukemic mouse HSPCs, and in human AML cells. Moreover, SILAC based proteomics further corroborated the involvement of METTL1 and Arg-TCT-4-1 in malignant transformation and the selective up-regulation of genes enriched with AGA codons that are involved in cell cycle. Overall, these results reveal the underlying molecular and cellular mechanism of METTL1 oncogenicity that involves increased mRNA translation of a subset of cell cycle regulatory genes that are enriched in AGA codons.
Altered tRNA expression has been generally regarded as a consequence of the high proliferative and metabolic state of cancer cells (Goodarzi et al., 2016; Santos et al., 2019); however, it is becoming increasingly evident that tRNA dysregulation can play more active roles in tumorigenesis (Goodarzi et al., 2016). Moreover, it is emerging that the relative expression of individual tRNAs is highly variable between different normal human (Dittmar et al., 2006) or mouse (Pinkard et al., 2020) tissues and altered tRNA expression is associated with cell proliferative states (Gingold et al., 2014). We find that increased expression of a single tRNA, Arg-TCT-4-1, can promote cancer initiation and that this relies on its AGA decoding function. Furthermore, work performed in yeast has shown that impairment of wobble modifications mediated by Trm9 in tRNA-Arg-TCT leads to changes in protein expression in genes enriched in AGA codons that are involved in cell cycle and DNA damage control; thus providing further support that Arg-TCT is a key mediator of cell cycle regulation (Begley et al., 2007; Deng et al., 2015). We conclude that METTL1-mediated malignant transformation is due to altered m7G modification and abundance of certain tRNAs, in particular Arg-TCT-4-1, which leads to a remodeling of the mRNA ‘translatome’ with increased translation of mRNAs enriched in the respective AGA codon including a group of cell cycle regulators. This study highlights the potential of METTL1 as a druggable target against cancer.
Limitations of the study
In this study we were able to recapitulate METTL1-mediated transformation with the overexpression of Arg-TCT-4-1; however, METTL1 overexpression leads to changes in abundance of other tRNAs as well, thus it is possible that these tRNAs can also play a role in METTL1-driven transformation. Furthermore, we acknowledge that the malignant phenotypes observed in this study are likely the result of direct and indirect effects of METTL1 on m7G methylation levels on tRNAs and codon biased translation.
STAR METHODS
RESOURCE AVAILABILITY
Lead Contact
Further information and requests for resources and reagents should be directed to and will be fulfilled by the Lead Contact, Richard I. Gregory (rgregory@enders.tch.harvard.edu).
Materials Availability
Request for plasmids generated in this study should be directed to and will be fulfilled by the Lead Contact, Richard I. Gregory (rgregory@enders.tch.harvard.edu).
Data and Code Availability
The accession number for the TRAC-Seq and Ribo-Seq data reported in this paper can be found under GEO GSE150076. The codes used for TRAC-Seq, TCGA analyses, SILAC proteomics and codon analyses are available at https://github.com/rnabioinfor/TRAC-Seq and https://github.com/rnabioinfor/METTL1_m7G). RiboToolkit was used for Ribo-seq analyses and the code is available at http://rnabioinfor.tch.harvard.edu/RiboToolkit. Raw data from Western and Northern blots were deposited on Mendeley at http://dx.doi.org/10.17632/vpy4t2bvp2.1
EXPERIMENTAL MODEL AND SUBJECT DETAILS
Cell Lines.
Primary mouse embryonic fibroblast with SV40 T antigen (MEF-WT, CRL2991) human T98G (male) (CRL1690) and human glioblastoma LNZ308 cells (male) (CRL11543) were purchased from ATCC. LP6 (sex unspecified)(Snyder et al., 2009) was a gift from Eric Snyder, LPS141 (sex unspecified)(Snyder et al., 2009) and LPS853 (sex unspecified)(Ou et al., 2015) were gifts from Jonathan Fletcher, and 93T449 (female)(Pedeutour et al., 1999) was a gift from Florence Pedeutour. Human white pre-adipocyte cells (sex unspecified) (C-12735) were purchased from Promocell and cultured in preadipocyte growth media according to manufacturer’s instructions. Passage 2 was used for experiments. MEF-WT, T98G and LNZ308 were cultured in DMEM supplemented with 10% FBS and 1X penicillin/streptomycin. LPS141 and 93T449 cells were cultured in RPMI 1640 medium supplemented with 15% FBS and 1X penicillin/streptomycin. LPS853 cells were cultured in IMDM medium supplemented with 15% FBS and 1X penicillin/streptomycin. LP6 cells were cultured in DMEM/F12 medium supplemented with 10% FBS, 1% Glutamax and 1X penicillin/streptomycin. All cell lines were cultured in the presence of 5% CO2 at 37°C. MOLM-13 (male), MV4-11 (male), THP-1 (male), NOMO-1 (female), EOL-1 (male), HEL (male), HL-60 (female), MEC-1 (male), MEC-2 (male), JURKAT (male), SU-DHL-5 (female), BxPC3 (female) and SU86.86 (female) were cultured in RPMI1640 (Invitrogen, 21875091) supplemented with 10% FBS (Invitrogen, 16000044) and 1% penicillin/streptomycin/glutamine. Peer was cultured in RPMI1640 (Invitrogen, 21875091) supplemented with 20% FBS (Invitrogen, 16000044) and 1% penicillin/streptomycin/glutamine. NB-4 (female) and KG-1 (male) were cultured in IMDM (Invitrogen, 12440061) supplemented with 10% FBS (Invitrogen, 16000044) and 1% penicillin/streptomycin/glutamine. 293T (female), B16F10 (mouse, female), PANC-1 (male) and PA-TU-8988T (female) cells were cultured in DMEM (Invitrogen, 31600083) supplemented with 10% FBS (Invitrogen, 16000044) and 1% penicillin/streptomycin/glutamine. The following cancer cell lines were obtained from the Sanger Institute Cancer Cell Collection (https://cellmodelpassports.sanger.ac.uk) and negative for mycoplasma contamination: MOLM-13, MV4-11, THP-1, NOMO-1, EOL-1, HEL, HL-60, MEC-1, MEC-2, JURKAT, SU-DHL-5, BxPC3, SU86.86, 293T, B16F10, PANC-1 and PA-TU-8988T. AML patient and cord-blood-derived CD34+ cell samples (independent of sex) were obtained with informed consent under local ethical approval (REC 07-MRE05-44). Human cell lines employed are not listed in the cross-contaminated or misidentified cell lines database curated by the International Cell Line Authentication Committee (ICLAC).
Animal subjects.
4-6 weeks old female NU/J (Nude) immunodeficient mice (Jackson Laboratory #002019) were used for subcutaneous injections. Female 6- to 10-week-old NSGS mice or Rag2−/− IL2RG−/− mice were used for tail-vein or subcutaneous injections. Flt3ITD/+ mice2 were kindly provided by Gary Gilliland and crossed with Rosa26Cas9/+ mice. 6- to 10-week-old female Rosa26Cas9/+, NrasG12D/+, Flt3ITD/+; Rosa26Cas9/+ or moribund Npm1flox–cA/+; Flt3ITD/+, Npm1flox–cA/+; NrasG12D/+ mice were used for bone marrow isolation of hematopoietic progenitors.
METHOD DETAILS
Plasmid Construction.
For WDR4 overexpression, the full-length WDR4 cDNA was first PCR amplified from the 293T cDNA with primers that contain the XhoI (forward primer) and BglII (reverse primer) sites. A Kozak sequence and 6xhis tag were incorporated into the forward primer. Then the PCR product was gel purified and digested with XhoI and BglII at 37°C for 1 hour. After that the digested PCR product was purified again and ligated into the XhoI/BglII cut pBabe-Puro vector. WDR4 was cut and subcloned into a pBabe-Neo vector using EcoRI and SalI restriction sites. For METTL1, overexpression previously generated plasmids expressing METTL1 wild-type and catalytic dead mutant (aa160-163, LFPD to AFPA) were used(Lin et al., 2018). For METTL1 rescue experiments, we generated a plasmid with a mutant shRNA binding site using site directed mutagenesis. Methyltransferase plasmids for recombinant protein expression were generated using the pETDuet-1 expression plasmid. 6xHis-WDR4 was cloned into pETDuet-1 using BamHI and SalI RE sites. Next, wild-type and catalytic dead mutant Flag-METTL1(L160A,D163A) proteins were cloned into pETDuet-1-WDR4 plasmid using NdeI and XhoI RE sites. To overexpress individual tRNAs we first removed the U6 promoter from a pLKO.1 lentivirus vector using site directed mutagenesis and at the same time introduced a SalI RE site in the multiple cloning site (pLKO.1-puro-ΔU6). We PCR amplified the genomic sequence spanning the tRNA including ~300 nt upstream and ~100 nt downstream sequence (containing the PolIII promoter, upstream leader, tRNA, and downstream trailer sequences) and inserted MluI and SalI RE sites in the flanking regions of the amplicon. Next, we subcloned the tRNA sequences into the lentivirus vector without a promoter using MluI and SalI RE sites. Site directed mutagenesis was used to generate mutant Arg-TCT-4-1 by substituting T in position 34 to C (T34>C); thus changing the anticodon from TCT into CCT. Renilla luciferase reporter plasmid was generated by de novo gene synthesis (GeneWiz) modifying all the arginine codons (16 total) to AGA in the Renilla open reading frame. Codon modified Renilla was then subcloned into a psiCheck2 plasmid (Promega) using NheI and XhoI RE sites (psiCheck2-RLuc-AGA-sensor). Hmga2-WT and codon modified Hmga2-MUT (All AGA codons changed to CGC) were generated by de novo gene synthesis (GeneWiz). mCherry was inserted into the multiple cloning siteof the bidirectional promoter vector pBi-CMV2 expressing a acGFP1 reporter (Clontech) using BamHI and NheI RE sites. Hmga2-WT and Hmga2-MUT open reading frames were then inserted into the C-terminus of mCherry using NheI and HindIII RE sites generating mCherry-Hmga2-WT and mCherry-Hmga2-MUT respectively. Primer sequences can be found in Table S8.
Recombinant Protein Purification.
Recombinant wild-type and catalytic dead mutant Flag-METTL1(L160A,D163A) proteins were co-expressed with wild type 6xHis-WDR4 and purified using Ni-NTA Agarose (QIAGEN). pETDuet-1 METTL1-Wt/WDR4 and METTL1-Mut/WDR4 were transformed into BL21 bacteria for induced expression of recombinant proteins. Bacteria were inoculated and cultured in LB medium at 37°C. Recombinant protein expression was induced (OD 0.4-0.6) using 0.5mM IPTG at 20°C overnight. Next, the bacteria were collected and lyzed by sonication, centrifuged at 15,000rpm at 4°C for 60 min. The cleared supernatant was collected and recombinant methyltransferase complexes were purified using Ni-NTA Agarose (QIAGEN) to capture 6xHis-WDR4 following the manufacturer’s instructions.
In vitro methylation assay.
Full length wild type tRNA-Val(TAC) or mutant (G46>C) RNA probes (200pmol, Dharmacon) were incubated with recombinant METTL1-Wt/WDR4 or METTL1-Mut/WDR4 (500ng) in the presence of H3-S-adenosylmethyonine (1μM) for one hour at 37°C in 1X reaction buffer (Tris pH 7.4 20mM, DTT 1mM, NaCl 50mM, KCl 50 mM, MgCl2 1mM, Glycerol 4%, RNAsin 0.2U/μL). A no-protein treatment was used to measure background radiation. Next, RNA was purified using Oligo Clean and Concentrator kit (Zymo) following the manufacturer’s instructions. Eluted RNA (20μL) was then mixed with 5 mL of Ultima Gold scintillation buffer (Perkin Elmer) and radiation levels were measured using a Tri-Carb 2910 TR instrument (Perkin Elmer).
Copy Number Analysis.
Genomic DNA was isolated using Quick-DNA microprep kit (Zymo) following the manufacturer’s instructions. METTL1 copy number alteration was evaluated using gene specific TaqMan Copy Number Assay (Thermo Fisher Scientific) according to the manufacturer’s instructions. RNAse P was used as a reference gene and T98G human GBM cell line was used as the calibrator sample (CCLE).
Cellular RNA Degradation Reactions (meCLICK).
MOLM13 cells were transduced with an Empty or a METTL1 gRNA as described above. On day 5 post-transduction the cells were suspended in methionine-free RPMI-1640 media (Gibco) supplemented with 10% v/v FBS and 1% v/v penicillin/streptomycin/l-glutamine at a density of 1 000 000 cells mL–1. The cells were incubated for 30 min at 37 °C followed by addition of PropSeMet at a final concentration of 150 μM. Treated cells were incubated for further 16 h at 37 °C. Aqueous solutions of premixed CuSO4 and THPTA were added at final concentrations of 100 and 300 μM, respectively, followed by the click-degrader at 400 μM and NaAsc at 5 mM. Treated cells were incubated for 10 min at 37 °C and resuspended in complete RPMI-1640 medium. Afterward, the cells were again incubated at 37 °C and harvested after 5 h for RNA extraction. Total RNA was extracted from pelleted cells using microRNAeasy Kit (Qiagen) according to the manufacturer’s instructions. One microgram of total RNA was retrotranscribed using Superscript Vilo Master Mix (Invitrogen) according the to manufacturer’s instructions. Levels of specific RNAs were measured using fast mode of StepOnePlus Real-Time PCR System (Applied Biosystems) and Fast SYBR Green Master Mix (Applied Biosystems) according to the manufacturer’s instructions. RNA levels were normalized to 18S subunit of the ribosome. Primer sequences are listed in Table S8 .
Quantitative RT-PCR.
Total RNA was isolated from cancer cells using the RNeasy Mini (Qiagen, 74104) or miRNeasy Kit (Qiagen, 217004). For cDNA synthesis, total RNA was reverse-transcribed with the Superscript VILO cDNA Synthesis kit (Life Technologies, 11754050). The levels of specific RNAs was measured using the ABI 7900 or StepOne real-time PCR machines and the Fast SybrGreen PCR mastermix (ThermoFisher, 4385612) according to the manufacturer’s instructions. All samples, including the template controls, were assayed in triplicate. The relative number of target transcripts was normalized to 18S subunit of the ribosome or RPLP0. The relative quantification of target gene expression was performed with the standard curve or comparative cycle threshold (CT) method. The primer sequences are listed in Table S8.
Immunohistochemistry staining.
The brain glioblastoma cancer tumor array was purchased from Biomax (GL805e). The slide was baked for 60 minutes in an oven set to 60 °C. Following deparaffinization and rehydration, antigen retrieval was performed using antigen unmasking reagent (citrate based) in a pressure cooker for 2.5 minutes and let to cool down for 30 minutes. Blocking was performed by incubating the slide in BloxAll (Vector Labs, SP-6000) for 10 minutes followed by incubation in 2.5% horse serum solution for 20 minutes. Then the slide was incubated with METLL1 antibody (Protein Group, 14994-1) at 1:200 or WDR4 antibody (Abcam, EPR11052) at 1:6000 for 60 minutes at room temperature. Primary antibody was detected using Impress Excell staining kit (Vector Labs, MP-7601). Slides were developed in DAB, then dehydrated and coverslipped. Each sample was scored by the percentage of positively stained cells and the staining intensity (intensity score: 0–3). Then the sample staining score was calculated by multiplying the percentage score and the intensity score.
Virus production and generation of stable knockdown and overexpression cells.
Generation of stable knockdown and overexpression cells via virus transduction was performed described previously(Lin et al., 2016). In brief, shRNA containing pLKO.1 vector was co-transfected with pLP1, pLP2, and VSVG into 293T cells. For overexpression, pBabe vectors containing the wild-type METTL1 (METTL1-Wt), METTL1 catalytic dead mutant (L160A-D163A, METTL1-Mut), and WDR4 were co-transfected with Gag-Pol and VSVG plasmids into 293T cells. Viruses were collected at 48 h and 72 h after transfection and then used to infect cells; 48 h after infection, puromycin (2.5ug/mL) or G418 (400ug/mL) was added to the culture medium to select the infected cells. MEF-WT cells overexpressing METTL1-Wt, METTL1-Mut, or empty vector were maintained in medium supplemented with puromycin (2.5ug/mL) and G418 (400 ug/mL). LNZ308, LP6, LPS853, and 93T449 cells infected with shMETTL1, or shGFP were maintained in medium with puromycin (2.5 ug/ml). For CRISPR studies, viruses were prepared as follows: 293T cells were transfected with the appropriate lentiviral vector together with the packaging plasmids PAX2 and VSVg at a 1:1.5:0.5 ratio. Supernatant was harvested 48 and 72 h after transfection. 5 × 10⁵ cells and viral supernatant were mixed in 2 ml culture medium supplemented with 8 μg ml−1 (human) or 4 μg ml−1 (mouse) polybrene (Merck, H9268), followed by spinfection (60 min, 900g, 32 °C) and further incubated overnight at 37 °C. The medium was refreshed on the following day and the transduced cells were cultured further.
Generation of Cas9-expressing cancer cell lines.
All Cas9-expressing cancer cell lines for screening were transduced with a virus produced from pKLV2-EF1aBsd2ACas9-W as previously reported(Tzelepis et al., 2016). Breiefly, blasticidin selection was initiated 3 days after transduction at 10 μg ml−1 for all cell lines. After stable cell lines were established, the transduced cells were single-cell sorted into 96-well plates (MoFlo XDP). Cas9 activity in individual subclones was tested using a lentiviral reporter pKLV2-U6gRNA(gGFP)- PGKBFP2AGFP-W. For CRISPRa assays, MOLM-13 cells were electroporated in Buffer R (Invitrogen) with 200 ng of plasmid encoding PiggyBac transposase together with 1μg dCas9:SAM to facilitate stable integration as previously reported(Yang et al., 2019). Electroporation was performed using the Neon Transfection System (Thermo Fisher Scientific). Electroporation conditions used for MOLM-13 cells were based on manufacturer instructions (1350V, 35 ms, 1pulse). 2 days after electroporation, cells were then selected by 10μg/ml Blasticidine (Gibco, A1113903) for 10 days before further experiments performed. Post-selection, dCas9:SAM expressing MOLM-13 cells were expanded to 100 x 106 cells for lentiviral transduction.
Generation of conditional knock-down cells.
B16F10 cells (3 × 10⁵) were infected as described above using PLKO-TETon-Puro lentiviral vectors expressing shRNAs against the coding sequence of mouse METTL1 or a scrambled control. Twenty-four hours after spinfection, the cells were replated in fresh medium containing 1 μg ml−1 of puromycin and kept in selection medium for 7 days. shRNA was induced by treatment with 500 ng ml−1 doxycycline (Merck, D9891) for the indicated times. The shRNA sequences are listed in Table S8.
gRNA competition assays.
gRNA competition assays were performed using single gRNA vectors as described previously(Tzelepis et al., 2016). For the validation of individual target genes, gRNAs were designed using http://www.sanger.ac.uk/htgt/wge/. Viral supernatants were collected 48 h after transfection. All transfections and viral collections were performed in 24-well plates and transduction was performed as mentioned above. For gRNA/BFP competition assays, flow cytometry analysis was performed on 96-well plates using a LSRFortessa instrument (BD). Gating was performed on live cells using forward and side scatter, before measuring of BFP+ cells. The gRNA sequences are listed in Table S8.
Cell proliferation, apoptosis, and cell cycle analyses.
In brief, for cell proliferation, 8x10⁴ cells were seeded in a 12-well plate on day 0. MEF-WT and LNZ308 Cells were trypsinized and counted on day 2 and day 4 to measure proliferation using a TC20 cell counter (Bio-Rad). B16F10 control or METTL1-KD cells (1 × 10⁵; 4 days after doxycycline induction) were seeded in 2 ml complete DMEM medium and counted 4 days after plating using the Countess II cell counter. For METTL1 overexpression experiments, MOLM-13 and THP-1 cells transduced with the indicated lentiviral cDNA vectors, then 1 × 10⁵ cells were seeded in 2 ml complete RPMI medium and counted 5 and 8 days after plating using the Countess II cell counter. For apoptosis and cell cycle analyses, 6x10⁶ cells were seeded in a 6-well plate and cells were collected 24 hours later. The numbers of apoptotic cells were quantified by flow cytometric assays using Annexin V-FITC Apoptosis Detection Kit (BioVision) according to the manufacturer’s instructions. Cell cycle analyses were performed using flow cytometry after labeling cells with bromodeoxyuridine (BrdU) using the FITC BrdU Flow Kit (BD Pharmingen, 559619) or the APC BrdU Flow Kit (BD Pharmigen, 51-9000019AK) following the manufacturer’s instructions. Briefly, 1x10⁶ cells were incubated with 10 μM at 37°C with 5% CO2 in air for 1 hour. After 1 hour of pulse, cells were washed three times to remove unincorporated BrdU, and fresh medium was added. For pulse-chase time course experiments cell were incubated for different amounts of time following BrdU labeling. Cells were fixed and DNA stained using 7-aminoactinomycin D (7-AAD). Cells were analyzed using the BDFortessa LSRII Cell Analyzer (BD Pharmigen). For in vivo assays using MOLM-13 cells, bone marrow cells were collected from mice transplanted with human AML cells 10 days before. Then human AML cells were enriched using human CD45 microbeads ( Miltenyi, 130-118-780) and 1x10⁶ human cells were used for cell cycle analysis using the APC BrdU Flow Kit according to manufacturer’s protocol (BD Pharmigen, 51-9000019AK). Data were analyzed by using LSRFortessa (BD) instruments. For in vivo assays using B16F10 cells, subcutaneous tumors were collected from mice transplanted with mouse melanoma cells 10 days before. Then 1 x 10⁶ mouse melanoma cells were used for cell cycle analysis using the APC BrdU Flow Kit according to manufacturer’s protocol (BD Pharmigen, 51-9000019AK). Data were analyzed by using LSRFortessa (BD) instruments.
Soft agar colony formation assays.
Fifty thousand single live MEFs cells were mixed with 0.35% top-agar (SeaPlaque, Lonza) and were plated onto 0.7% base-agar (SeaPlaque, Lonza) in six-well plates. Twenty-eight days after plating the cells into soft agar, colony numbers were counted. The plates were imaged using a EVOS FL auto plate imager (Thermo Fisher Scientific) under continuous scan. Images were stitched and the colony numbers were counted using ImageJ.
Isolation of hematopoietic progenitors.
Flt3ITD/+ mice2 were kindly provided by Gary Gilliland and crossed with Rosa26Cas9/+ mice. Freshly isolated bone marrow from 6- to 10-week-old female Rosa26Cas9/+, NraG12D/+, Flt3ITD/+; Rosa26Cas9/+ or moribund Npm1flox–cA/+; Flt3ITD/+, Npm1flox–cA/+; NrasG12D/+ mice were used. Bone marrow cells were exposed to erythrocyte lysis using BD PharmLyse (BD Bioscience, 555899), followed by magnetic bead selection of Lin− cells using the Lineage Cell Depletion Kit (Miltenyi Biotec, 130-090-858) according to the manufacturer’s instructions. Lin− were cultured in X-VIVO 20 (04-448Q, Lonza) supplemented with 5% BIT serum (09500, Stem Cell Technologies) 10ng ml−1 IL3 (Peprotech, 213-13), 10ng ml−1 IL6 (216-16, Peprotech) and 50ng ml−1 of SCF (Peprotech, 250-03). Retrovirus constructs pMSCV-MLL-AF9-IRES-YFP and pMSCV-MLL-ENL-IRES-Neo were used with package plasmid psi-Eco to produce retrovirus. 293T cells were cultured and prepared for transduction in 10cm plates as described above. For virus production, 5 μg of the above plasmids and 5 μg psi-Eco packaging vector were transfected drop wise into the 293T cells using 47.5 μl TransIT LT1 (Mirus, MIR 2304) and 600 μl Opti-MEM (Invitrogen, 31985062). The resulting viral supernatant was harvested as previously described. Transduction of primary mouse cells was performed in 6-well plates as mentioned above. After transduction, transduced cells were sorted for YFP (for MLL-AF9) or selected with neomycin (for MLL-ENL). For re-plating assays using gRNA or cDNA constructs, 5,000 lineage negative cells and primary murine AML cells were plated in three wells of 6-well-plate of M3434 methylcellulose (Stem Cell Technologies, 03434) after selection with 1.0 μg ml−1 puromycin for 3 to 5 days starting from day 2 post transduction. The colonies were counted 7 days later and further 5,000 cells re-seeded and re-counted after a week until the 3rd re-plating.
Adult Primary Leukemia and Cord Blood Sample Analysis.
5 x 10⁵ human AML patient and cord-blood-derived CD34+ cells were pelleted and resuspended in whole cell lysis buffer (50 mM Tris-HCl pH=8, 450 mM NaCl, 0.1% NP-40, 1mM EDTA), supplemented with 1 mM DTT, protease inhibitors (Sigma, S8820), and phosphatase inhibitors (Sigma, P5726-1ML). Protein concentrations were assessed by Bradford assay (Bio-Rad, 5000006) and an equal amount of protein was loaded per track. Prior to loading, the samples were supplemented with SDS-PAGE sample buffer and DTT was added to each sample. 10 μg of protein was separated on SDS-PAGE gels, and blotted onto polyvinylidene difluoride membranes (Millipore, IPVH00010). Cord-blood-derived CD34+ cells were tested for colony-forming efficiency in StemMACS HSC-CFU semi-solid medium (Miltenyi, 130-091-280) in the presence of the indicated shRNA vector for either scramble or METTL1. Colonies were counted by microscopy 12–14 days (CD34+ cells) after plating. All human primary and cord blood samples were obtained with informed consent under local ethical approval (REC 07-MRE05-44).
Competitive Bone Marrow Transplantation.
Freshly isolated bone marrow from 6- to 10-week-old female Rosa26Cas9/+ mice were used. Bone marrow cells were exposed to erythrocyte lysis using BD PharmLyse (BD Bioscience, 555899), followed by magnetic bead selection of Lin- cells using the Lineage Cell Depletion Kit (Miltenyi Biotec, 130-090-858) according to the manufacturer’s instructions. Lin- were then cultured in X-VIVO 20 (04-448Q, Lonza) supplemented with 5% BIT serum (09500, Stem Cell Technologies) 10ng ml-1 IL3 (Peprotech, 213-13), 10ng ml-1 IL6 (216-16, Peprotech) and 50ng ml-1 of SCF (Peprotech, 250-03) overnight. Lin- cells were then transduced with a blank (no vector), an Empty-BFP or Mettl1-BFP gRNA and cultured for another 48 hours. On day 4 post bone marrow extraction, transduced Lin- cells with the BFP vectors were purified using cell sorting and mixed equally (50-50) with the Lin- cells from the blank cohort. Of those 2 individual pooled cohorts, 1 x 10⁶ cells were then transplanted to lethally irradiated (12 Gy) female C57BL/6J mice, with an addition of extra 5 x 10⁵ whole BM cells for additional support (final 1,5 x 10⁶ cells). The competitive chimerism was then monitored over the following 16 weeks by flow cytometry of the peripheral blood using using a LSRFortessa instrument (BD). For evaluation of the METTL1 levels in both cohorts, bone marrow cells were isolated from mice 8 weeks post-transplantation and protein from 5 x 10⁶ cells extracted as described above.
High performance liquid chromatography with tandem mass spectrometry (HPLC-MS/MS) analysis of RNA.
250 ng to 500 ng RNA was digested with 0.5U P1 nuclease at 37°C for 2 hours and dephosphorylated with 1U rSAP at 37°C for 1 hour. Then 100 μL samples were filtered with Millex-GV 0.22u filters. The RNA samples were not de-capped, hence the m7G measurements reflect internal m7G modification and do not include the m7G cap. 5 to 10 uL from each sample was injected into Agilent 6470 Triple Quad LC/MS instrument. The samples were run in mobile phase buffer A (water with 0.1% Formic Acid) and 2 to 20% gradient of buffer B (Methanol with 0.1% Formic Acid). MRM transitions were measured for guanosine (284.1 to 152.1), 7-methylguanosine (m7G) (298.1 to 166.1). For LC/MS-MS data collection and analysis the following software was used: Agilent Mass Hunter LC/MS Data Acquisition Version B.08.00 and Quantitative Analysis Version B.07.01.
Isolation of tRNAs for HPLC-MS/MS analysis.
To isolate Arg-TCT tRNA, 300 pmol of synthetic DNA oligos complementary to Arg-TCT isodecoders 1,2,3,5 (probe 1) or Arg-TCT isodecoder 4 (probe 2) were incubated with 300 μg of total RNA in 50 μL of annealing buffer (10 mM Tris pH8.0, 1 mM EDTA, 50 mM NaCl) and incubated at 95°C for 5 minutes and slowly cooled to room temperature (25 °C) over 3.5 hours to allow hybridization to occur. The hybridized products were incubated with streptavidin C1 beads (Invitrogen) in IP buffer (1M NaCl, 5 mM Tris pH7.5, 0.5 mM EDTA) at 4°C for 1 hour. After extensive washing, beads were heated at 95°C for 5 min and supernatant (containing tRNAs) was collected. Next, RNA in supernatant was size-selected (<200nt) and concentrated using Zymo RNA clean and purification kit (Zymo). Biotinylated oligo sequences are listed in Table S8.
m7G tRNA meRIP.
m7G tRNA meRIP was performed as previously described(Lin et al., 2018). Briefly, small RNAs (< 200nt) were purified using the mirVana miRNA Isolation Kit (Thermo Fisher Scientific). Then anti-m7G meRIP was performed on the small RNA by incubating 10 ug small RNAs with 10 ug anti-m7G antibody (MBL International, #RN017M) or normal rabbit IgG control (Cell Signaling, #2229) for 2 hr at 4C. Next, 50 ul pre-washed Protein A/G Magnetic Beads (Thermo Fisher Scientific, #88802) were added to purify the m7G modified small RNAs and incubated for 2 hours at 4C. The beads were washed extensively and the bead bound RNAs were dissociated by boiling the beads in 1X urea loading buffer (Invitrogen) for 5 minutes.
m7G TRAC-Seq.
m7G TRAC-Seq, meRIP was performed as previously described(Lin et al., 2019; Lin et al., 2018). First, isolated small RNAs were first treated with recombinant wild-type and D135S AlkB proteins to remove the dominant methylations on RNAs as previously described. Briefly, 10ug small RNAs were treated with 80 pmol wt AlkB and 160 pmol D135S AlkB mutant for 2 hours in a 100 ul demethylation reaction [300 mM KCl, 2 mM MgCl2, 50 mM of (NH4)2Fe(SO4)2·6H2O, 300 mM 2-ketoglutarate (2-KG), 2 mM L-ascorbic acid, 50 mg/mL BSA, 50 mM MES buffer (pH 5.0)] at room temperature. After incubation, the reaction was quenched with at final concentration of 5 mM EDTA and the RNAs were purified by phenol–chloroform extraction followed by ethanol precipitation. Alkb-treated RNAs (2.5 ug) were then treated with 0.1M NaBH4 for 30 min on ice at dark in the presence of 1 mM free m7GTP as methylation carrier. Then the RNAs were precipitated with sodium acetate (300mM final concentration, PH5.2) and 2.5 volumes of cold ethanol at −20C overnight. After precipitation, the NaBH4-treated RNAs were subsequently treated with aniline-acetate solution (H2O: glacial acetate acid:aniline, 7:3:1) at room temperature at dark for 2 hours to induce the site-specific cleavage. After cleavage, the RNA samples were purified by ethanol precipitation and used for cDNA library construction using NEBNext Small RNA Library Prep Set (New England Biolabs) followed by sequencing with Illumina Nextseq 500.
m7G site calling from TRAC-Seq.
Adapter sequences were trimmed and low-quality sequences (Q20) were discarded using trim_galore (https://www.bioinformatics.babraham.ac.uk/projects/trim_galore). For tRNA chemical sequencing data, clean reads were mapped to the mature tRNA sequences downloaded from GtRNAdb using Bowtie with a maximum of two mismatches allowed(Langmead et al., 2009). The alignments were then processed to record the read depth of each site on tRNAs using Bedtools(Quinlan, 2014). Based on tRNA mapping bam files and read depth information, cleavage score and cleavage score ratio between input and chemically-treated sample using the program cleavage_score.R (https://github.com/rnabioinfor/TRAC-Seq)(Lin et al., 2019; Lin et al., 2018). The positions with a cleavage score > 3 and the cleavage ratio > 0.2 in both samples were considered as the candidate m7G sites. Based on 21 bp sequences around m7G sites, the enriched motifs were analyzed by MEME with a maximum 7bp width. To conduct tRNA expression analysis for Input samples, we used the programs ARM-Seq data analysis pipeline(Cozen et al., 2015). Differential expression analysis can be then performed based on the output count file by using DESeq (http://bioconductor.org/packages/release/bioc/html/DESeq.html).
Northern Blot, Northwestern Blot, and Western Blot.
For Northern blotting of tRNAs or U6 snoRNA, 2ug total RNA samples were mixed with 2X TBE loading buffer (Bio-Rad) and incubated at 95°C for 5 min. The samples were then loaded into 15% TBE-UREA (Bio-Rad) gels to separate the RNAs by molecular weight. Next, the RNAs were transferred onto a positive charged nylon membrane and crosslinked with UV. For Northern blots, the membrane was blotted with radioactive labeled probes against tRNAs or U6 snRNA. Acid urea PAGE (10%) was used to evaluate aminoacylation levels in presence of 10 mM CuSO4. The probe sequences are listed in Table S8. Botted membranes were then exposed to autoradiography films. For Northwestern blot, membranes were immunoblotted with mouse monoclonal anti 7-methylguanosine (m7G) (MBL International, RN017M). For western blotting, cells were transduced with lentiviral gRNA, shRNA or cDNA vectors and selected with 1.0 μg ml−1 puromycin for 3 days starting from day 2 post transduction. The transduced cells were further cultured for 5 days before lysis. Cell pellets resuspended in whole cell lysis buffer (50 mM Tris-HCl pH=8, 450 mM NaCl, 0.1% NP-40, 1mM EDTA), supplemented with 1 mM DTT, protease inhibitors (S8820, Sigma), and phosphatase inhibitors (P5726-1ML, Sigma). Protein concentrations were assessed by Bradford assay (5000006, Bio-Rad) and an equal amount of protein was loaded per track. Prior to loading, the samples were supplemented with SDS-PAGE sample buffer and DTT was added to each sample. 10-40 μg of protein was separated on SDS-PAGE gels, and blotted onto polyvinylidene difluoride membranes (IPVH00010, Millipore). Membranes were then immunoblotted with the following antibodies: B-Actin (Abcam, ab8229 or ab8227), METTL1 (Protein Group, 14994-1 or Abcam, ab157097), WDR4 (Abcam, EPR11052), HMGA2 (Abcam, ab97276; or Cell Signaling, 8179), KDM1/LSD1 antibody (Abcam, ab17721), ASH2L (Proteintech, 12331-1-AP), SETDB1 (Proteintech, 11231-1-AP), CDK4 (Proteintech, 11026-1-AP).
RNA-seq analysis of patient samples.
RNA-seq data of healthy and AML patients from the Leucegene dataset were downloaded from four individual studies(Lavallee et al., 2016; Macrae et al., 2013; Pabst et al., 2016; Simon et al., 2012). Mapping to the human genome assembly GRCh38 and read counts were performed by STAR v2.7(Dobin et al., 2013). Reads were normalized to effective exon lengths and then to the upper quartile of each sample. Log10 values of gene expression were shown as box-and-whiskers and p-values were computed using two-tailed T tests.
Ribosome footprinting (Ribo-Seq).
Immortalized MEFs stably transduced with either empty vector (EV), wild type METTL1 and WDR4, or mutant METTL1 and WDR4 were grown to 80-90% confluence in DMEM supplemented with 10% FBS in 15-cm dishes. Ribosome footprinting was performed according to TruSeq® Ribo Profile system (Illumina) with modifications. Briefly, cells were treated with 0.1 mg/mL cycloheximide (CHX) for 1 minute to inhibit translation elongation and washed with ice-cold PBS containing 0.1 mg/mL CHX. Next, cells were lyzed in 800 μl 1X Mammalian Polysome Buffer (Illumina) supplemented with 1% Triton X-100, 1 mM DTT, 10 units DNase I, 0.1 mg/mL CHX, and 0.1% NP-40. Lysates were cleared by centrifugation at 12,000g for 10 min at 4°C, and supernatants were flash-frozen in liquid nitrogen and stored at −80°C until processing. RNA concentration of the lysates was measured according to their absorbance at A260 and an equivalent of 12xA260/ml was treated with 5 U/A260 TruSeq Ribo Profile RNase Nuclease (Illumina) for 45 minutes at room temperature. RNase activity was inhibited by adding 15 μl SUPERase to the mixture. Ribosome protected fragments (RPFs) were isolated using MicroSpin S-400 columns (GE Healthcare). RPF RNA samples (5μg) were subjected to ribosomal RNA depletion using RiboMinus™ Eukaryote Kit v2 (Thermo Fisher Scientific). Ribo-depleted RNA samples were separated on 15% polyacrylamide/TBE/Urea gels (Thermo Fisher Scientific) and the RNA fragments corresponding to ~25-35 nt were excised. RNA was gel-extracted and precipitated overnight at 4°C using 0.5 M ammonium acetate. In parallel, total RNA input samples were isolated, and fragmented at 94°C for 25 minutes. Input total RNA and RPFs were subjected to end repair by TruSeq Ribo Profile PNK (Illumina), cleaned using RNA Clean & Concentrator-5 kit (ZYMO Research) and ligated to 2.5 μM Universal miRNA Cloning Linker (NEB) by using 100 units T4 RNA Ligase 2, truncated KQ (NEB) for 3 hours at 22°C. After ligation, RNA samples from both total RNA and RPFs were reverse transcribed using Superscript™ III Reverse Transcriptase (Thermo Fisher Scientific) and 0.25 μM RT primer (IDT). cDNA samples were then gel-extracted on 10% polyacrylamide/TBE/Urea gels (Thermo Fisher Scientific) and circularized by CircLigase™ ssDNA Ligase (Lucigen) for 2 hours at 60°C. cDNA libraries for total RNA and RPFs were amplified for 9 and 12 PCR cycles, respectively, using Phusion High-Fidelity PCR Master Mix (NEB), Illumina index primers and 10 μM forward primer (IDT). Amplified libraries were cleaned using AMPure XP Beads (Beckman Coulter), followed by gel-extraction on 8% native TBE gels (Thermo Fisher Scientific). Libraries were sequenced with Illumina NextSeq 500. The primer sequences are listed in Table S8.
Ribo-Seq data analysis.
The sequences of input and Ribo-seq samples were firstly processed to get the clean reads by trimming the adapters and filtering the low-quality sequences. Then, for Ribo-seq input data, the clean reads were aligned to reference genome sequences using STAR(Dobin et al., 2013). The resulted BAM mapping files were used as inputs of HTSeq(Anders et al., 2015) to calculate the read counts for each gene from GENCODE gene mode. For the cleaned Ribo-seq data, the clean ribosome-protected fragments (RPFs) were firstly collapsed into FASTA format by fq2collapedFa. RiboToolkit (https://bioinformatics.caf.ac.cn/RiboToolkit_demo) was used to perform codon occupancy analysis and translation efficiency analysis by uploading the collapsed RPF tags and gene read counts from input samples(Liu et al., 2020a). In brief, rRNA and tRNA sequences were filtered from RPF containing files by alignment to rRNA sequences (Ensembl non-coding, release 91)( Zerbino, et al., 2018) and tRNA sequences from GtRNAdb databases (Chan and Lowe, 2016). The resulting ribosome-protected fragments (RPFs) were aligned to the mouse reference genome (mm10) using STAR [10.1093/bioinformatics/bts635] and only unique mapped reads were kept. The genome unique mapping reads were then mapped to transcript sequences using Bowtie with a maximum of one mismatch allowed (Langmead et al., 2009). and all the transcript mappings were kept. CONCUR tool (https://github.com/susbo/concur) was used for calculating codon usage based on the reference genome mapping based on STAR (Frye et al., 2020). The translation efficiency (TE) was calculated by dividing RPF abundance on CDS by its mRNA abundance of input sample. A threshold of two-fold change and FDR <0.05 was used to define the differential translation genes (Zinshteyn and Gilbert, 2013). PausePred (https://pausepred.ucc.ie/), was used to infer ribosome pauses from Ribo-seq data. Peaks of ribosome footprint density are scored based on their magnitude relative to the background density within the surrounding area (Kumari et al., 2018).
Proteomic analysis by stable isotope labeling using amino acids in cell culture (SILAC).
LNZ308 human glioblastoma cells or MEF-WT immortalized cells were grown in media supplemented with isotopic-labeled 13C615N2 l-lysine and 13C615N4 l-arginine (heavy) or normal amino acids (light) for 15 to 21 days until a labeling efficiency >95% was achieved following the instructions of the SILAC Protein Quantitation Kit (Trypsin) – DMEM (A33972, Thermo Scientific). Light SILAC-labeled shGFP LNZ308 and Empty-vector MEF-WT cells as well as heavy-labeled shMETTL1 LNZ308, METTL1/WDR4 and Arg-TCT-4-1 overexpressing MEF-WT cells were lysed in 1x passive cell lysis buffer (Promega) supplemented with complete protease inhibitor (11873580001, Roche). Protein lysates were cleared by centrifugation at 14,000xg for 5 minutes at 4°C. Equal amounts of heavy and light protein (1:1) amounts were mixed with 2x reducing sample buffer an 100 ug of clarified sample was separated by SDS-PAGE (4-20%). Three technical replicates were performed for each sample. Gels were stained using Novex Colloidal blue staining (Invitrogen) and each lane was cut into 12 slices of equal size. Excised gel bands were cut into approximately 1 mm3 pieces. The samples were reduced with 1 mM DTT for 30 minutes at 60°C and then alkylated with 5mM iodoacetamide for 15 minutes in the dark at room temperature. Gel pieces were then subjected to a modified in-gel trypsin digestion procedure (Shevchenko, et al., 1996, Anal Chem.). Gel pieces were washed and dehydrated with acetonitrile for 10 min. followed by removal of acetonitrile. Pieces were then completely dried in a speed-vac. Rehydration of the gel pieces was with 50 mM ammonium bicarbonate solution containing 12.5 ng/μl modified sequencing-grade trypsin (Promega, Madison, WI) at 4°C. Samples were then placed in a 37°C room overnight. Peptides were later extracted by removing the ammonium bicarbonate solution, followed by one wash with a solution containing 50% acetonitrile and 1% formic acid. The extracts were then dried in a speed-vac (~1 hr). The samples were then stored at 4°C until analysis. On the day of analysis the samples were reconstituted in 5 - 10 μl of HPLC solvent A (2.5% acetonitrile, 0.1% formic acid). A nano-scale reverse-phase HPLC capillary column was created by packing 2.6 μm C18 spherical silica beads into a fused silica capillary (100 μm inner diameter x ~30 cm length) with a flame-drawn tip (Peng and Gygi J). After equilibrating the column each sample was loaded via a Famos auto sampler (LC Packings, San Francisco CA) onto the column. A gradient was formed and peptides were eluted with increasing concentrations of solvent B (97.5% acetonitrile, 0.1% formic acid). As each peptide was eluted they were subjected to electrospray ionization and then they entered into an LTQ Orbitrap Velos Pro ion-trap mass spectrometer (Thermo Fisher Scientific, San Jose, CA). Eluting peptides were detected, isolated, and fragmented to produce a tandem mass spectrum of specific fragment ions for each peptide. Peptide sequences (and hence protein identity) were determined by matching protein or translated nucleotide databases with the acquired fragmentation pattern by the software program, Sequest (ThermoFinnigan, San Jose, CA) (Eng. et al., 1994 J. Am. Soc. Mass. Spectrom). The differential modification of 8.0142 and 10.0083 mass units for lysine and arginine, respectively were included in the database searches to find SILAC labeled peptides. All databases include a reversed version of all the sequences and the data was filtered to between a one percent or lower peptide false discovery rate. SILAC protein ratios (H/L) were determined as the average of all peptide ratios assigned to a protein between heavy and light samples. Differential protein expression was determined using a moderated t-test, testing for the null-hypothesis being no change in H/L ratio. Multiple tests were corrected using false discovery rate (<1%). Codon usage was estimated by dividing the number of specific codons in the coding sequence (CDS, observed) of an mRNA divided by the genome average number of each codon (expected) followed by a normalization to the CDS length (Supek 2005).
TCGA data analysis.
RNA-Seq expression data and small RNA-Seq data for 33 TCGA tumor types were downloaded from the Genomic Data Commons Data Portal (GDC) of TCGA (http://cancergenome.nih.gov/). The gene expression matrix was then constructed by merging the TPM (Transcripts Per Million) values of all RNA-seq samples. The tumor types with normal tissues were used to draw the gene expression boxplots and the statistic differences are then calculated using Wilcoxon rank-sum test (with asterisks indicating statistical significance). The expression correlations between METTL1 and WDR4 among TCGA tumors were conducted by using Pearson correlation coefficient. The tRNA expressions from TCGA small RNA-seq data were analyzed using ARM-Seq data analysis pipeline(Cozen et al., 2015). We used data generated by the Clinical Proteomic Tumor Analysis Consortium (NCI/NIH) to analyze METTL1 protein levels versus RNA transcripts.
Luciferase reporter assay.
Dual luciferase assays were performed according to the manufacturer’s protocol (Promega). RLuc activity was normalized to the Renilla luciferase (FLuc) activity and the ratio was normalized to protein concentration. The normalized RLuc activity (translation efficiency) in the presence of empty vector was set to 1.
Fluorescent reporter assay.
In brief, 8x10⁵ MEF-WT cells overexpressing METT1/WDR4, Arg.TCT-4-1 or empty vector control were seeded in a 60mm plate on day 0. On day 1, cells were transfected with 2μg of mCherry-Hmga2-WT or mCherry-Hmga2-MUT using Lipofectamine 2000 (Life Technologies) and 48 hours later cells were trypsinized and resuspended in fresh medium to a density of 1x10⁶ cells/mL. Cells were analyzed using the BDFortessa LSRII Cell Analyzer (BD Pharmigen) and acGFP1 and mCherry expression was monitored. Data were analyzed using FlowJo V10.7 (Beckton Dickinson and Co.) and presented as a ratio between mCherry and acGFP1 intensity levels.
Animal Studies.
Research involving animals complied with protocols (BIDMC 102-2014) approved by the Beth Israel Deaconess Medical Center Institutional Animal Care and Use Committee. 4-6 weeks old female NU/J (Nude) immunodeficient mice (Jackson Laboratory #002019) were used for subcutaneous injections. To study the oncogenic transformation ability of METTL1/WDR4, MEF-WT cells (5x10⁶ cells) overexpressing METTL1-Wt/WDR4, catalytic dead mutant METTL1-L160A, D163A/WDR4 (METTL1-Mut/WDR4) or empty vector (EV) were transplanted into nude mice. To study the role of METTL1 in tumor formation, human LNZ308 glioblastoma cells or human LP6 liposarcoma cells (5x10⁵ cells) with stable METTL1 knockdown (shMETTL1) or negative control (shGFP) were transplanted. The indicated number of cells were mixed with serum-free medium and growth factor reduced Matrigel (Corning #354230) (1:1) and injected into the right flank of nude mice. Five or six mice were used for each group. Subcutaneous tumor formation was monitored by calipers twice a week. The tumor volume was calculated using the formula 1/2(length × width2). The recipient mice were monitored and euthanized when the tumors reached 1 cm in diameter. At end-point tumors were collected and weighted. For in vivo experiments with whole-body bioluminescent imaging the following protocol was used. MOLM-13 cells expressing Cas9 and B16F10 cells were first transduced with a firefly luciferase–expressing plasmid (System Biosciences, LL205PA-1). After propagation, the cells were transduced with the indicated lentiviral gRNA or doxycycline-inducible shRNA or cDNA vectors and selected with puromycin from day 2 to day 5. At day 5 post transduction, the cells were suspended in fresh medium without puromycin. At day 6, 5 x 10⁵ cells were transplanted into female 6- to 10-week-old NSGS mice or Rag2−/− IL2RG−/− mice by tail-vein (MOLM-13) or subcutaneous (B16F10) injections. For the in vivo B16F10 experiments, daily treatment of 2 mg/kg of doxycycline was administered via intraperitoneal injection (IP) on day 5 post-transplantation, for 10 consecutive days. Doxycycline (Sigma, D9891) were dissolved in 20%(w/v) 2-hydroxyproply beta-cyclodextrin vehicle (Sigma, H107). At day 5 post-transplant, the tumor burdens of the animals were detected using IVIS Lumina II (Caliper) with Living Image version 4.3.1 software (PerkinElmer). Briefly, 100 μl of 30 mg/ml D-luciferin (BioVision, 7903-1G) was injected into the animals intraperitoneally. Ten min after injection, the animals were maintained in general anesthesia by isoflurane and put into the IVIS chamber for imaging. The detected tumor burdens were measured and quantified by the same software. Diseased mice were assessed blindly by qualified animal technicians from the Sanger mouse facility. All animal studies were carried out in accordance with the Animals (Scientific Procedures) Act 1986, UK and approved by the Ethics Committee at the Sanger Institute. Randomization and blinding were not applied.
QUANTIFICATION AND STATISTICAL ANALYSIS
Quantification and statistical analysis methods were described in individual method sections and Figure legends. Center is represented by mean and dispersion is represented by standard deviation. The n is reported in each figure legend. Paired or one-sided Student’s T tests, Fisher’s exact test or Wilcoxon’s signed rank test were used for two group comparisons. One or two-way ANOVA were used for multigroup comparison. Bonferroni or Tukey post-hoc p-value corrections were performed for multigroup comparisons. Pearson or Spearman tests were performed for correlation analysis. Randomization and blinding were not applied. The ROUT method was used to identify outliers (Q = 1%). Data was considered significant if p-values < 0.05.
Supplementary Material
Table S1. tRNA abundance changes in shMETTL1 vs shGFP control cells. Related to Figure 2B
Table S2. SILAC proteomic data from shMETTL1 vs shGFP control cells. Related fo Figure 2F
Table S3. tRNA abundance changes in METTL1/WDR4 overexpressing cells vs Empty vector control cells. Related to Figure 3C
Table S4. Ribo-Seq data from METTL1/WDR4 overexpressing cells vs Empty vector control cells. Related to Figure 5A
Table S5. SILAC proteomics data from METTL1/WDR4 overexpressing cells vs Empty vector control cells. Related to Figure 5H
Table S6. tRNA expression levels from TCGA datasets. Related to Figure 6A
Table S7. SILAC proteomics data from Arg-TCT-4-1 overexpressing cells vs Empty vector control cells. Related to Figure 7A
Table S8. Sequences of primers and oligos used in this study. Related to STAR Methods Section
KEY RESOURCES TABLE
| REAGENT or RESOURCE | SOURCE | IDENTIFIER |
|---|---|---|
| Antibodies | ||
| Rabbit polyclonal anti-beta-Acin | AbCam | Cat# Ab8229 |
| Rabbit polyclonal anti-Mettl1 | Proteintech Group | Cat# 14994-1 |
| Rabbit polyclonal anti-WDR4 | AbCam | Cat# EPR11052 |
| Mouse monoclonal 7-methylguanosine (m7G) | MBL International | Cat# RN017M |
| Normal rabbit IgG control | Cell Signaling | Cat# 2229 |
| anti-METTL1 | AbCam | Cat# ab157097 |
| anti-HMGA2 | Cell Signaling | Cat# 8179 |
| anti-HMGA2 | AbCam | Cat# ab97276 |
| anti-KDM1/LSD1 | AbCam | Cat# ab17721 |
| anti-ASH2L | Proteintech | Cat# 12331-1-AP |
| anti-SETDB1 | Proteintech | Cat# 11231-1-AP |
| anti-CDK4 | Proteintech | Cat# 11026-1-AP |
| Bacterial and Virus Strains | ||
| NEB Stable Competent E. coli | New England Biolabs | Cat# C3040I |
| BL21(DE3) Competent E. coli | New England Biolabs | Cat# C2527I |
| GC10 chemically competent cells | Genesee Scientific | Cat# 42-657 |
| Biological Samples | ||
| Glioblastoma multiforme (GBM) tissue array | Biomax | Cat# GL805e |
| Chemicals, Peptides, and Recombinant Proteins | ||
| METTL1-Wt/WDR4 recombinant protein | This manuscript | N/A |
| METTL1-Mut (L160A,D163A)/WDR4 recombinant protein | This manuscript | N/A |
| DMEM medium | GIBCO | Cat# 11965092 |
| RPMI 1640 medium | GIBCO | Cat# 11875093 |
| IMDM medium | GIBCO | Cat# 12440061 |
| DMEM/F12 | GIBCO | Cat# 11320033 |
| Preadipocyte Growth Medium | Promocell | Cat# C-27410 |
| Fetal Bovine Serum | GeminiBio | Cat# 100-106 |
| Penicillin-Streptomycin | GIBCO | Cat# 15140163 |
| GlutaMax | GIBCO | Cat# 35050061 |
| DPBS | GIBCO | Cat# 14190250 |
| Trypsin-EDTA | GIBCO | Cat# 15400054 |
| DetachKit | Promocell | Cat# C-41200 |
| ZnCl2 | Sigma | Cat# Z0152 |
| Trizma base | Sigma | Cat# T4661 |
| EDTA | Sigma | Cat# 431788 |
| NaCl | Sigma | Cat# S7653 |
| KCl | Sigma | Cat# P9541 |
| MgCl2 | Sigma | Cat# M8266 |
| Igepal CA-630 | Sigma | Cat# I8896 |
| Bovine Serum Albumin | Sigma | Cat# 05470 |
| Isopropyl b-D-1-thiogalactopyranoside (IPTG) | Sigma | Cat# I5502 |
| MES | Sigma | Cat# M3671 |
| a-Ketoglutaric acid | Sigma | Cat# 75890 |
| Ammonium iron(II) sulfate hexahydrate | Sigma | Cat# 215406 |
| L-Ascorbic acid | Sigma | Cat# A92902 |
| Sodium borohydride | Sigma | Cat# 452882 |
| Aniline | Sigma | Cat# 242284 |
| RNasin Ribonuclease Inhibitors | Promega | Cat# N2518 |
| Lipofectamine 2000 Transfection Reagent | Invitrogen | Cat# 11668019 |
| Platinum High Fidelity Taq DNA Polymerase | Invitrogen | Cat# 11304029 |
| TRIzol Reagent | Invitrogen | Cat# 15596026 |
| TaqMan Genotyping Master Mix | Applied Biosystems | Cat# 4371353 |
| Matrigel Growth Factor Reduced (GFR) | Corning | Cat# 354230 |
| Protein A/G Magnetic Beads | ThermoFisher | Cat# 88802 |
| Corning FluoroBlok 24-Multiwell Insert Systems, PET Membrane | Corning | Cat# 351152 |
| Ni-NTA Superflow | QIAGEN | Cat# 30410 |
| Ultima Gold scintillation buffer | Perkin Elmer | Cat# 6013321 |
| Geneticin Selective Antibiotic (G418 Sulfate) | GIBCO | Cat# 10131035 |
| Puromycin | Sigma | Cat# P7255 |
| FxCycle PI/RNase Staining Solution | Invitrogen | Cat# F10797 |
| SeaPlaque Agarose | Lonza | Cat# 50101 |
| 4-20% Tris Glycine gel | Invitrogen | Cat# XP04200 |
| 15% TBE Urea Gel | Bio-Rad | Cat# 3450092 |
| TBE urea loading buffer | Invitrogen | Cat# LC6876 |
| Cycloheximide | Sigma | Cat# C1988 |
| Triton X-100 | Sigma | Cat# T8787 |
| Dithiothreitol | Invitrogen | Cat# 707265ML |
| NP-40 | Sigma | Cat# 74385 |
| SUPERase Inhibitor | Invitrogen | Cat# AM2694 |
| MicroSpin S-400 | GE Healthcare | Cat# 27514001 |
| RiboMinus Eukaryote Kit v2 | Invitrogen | Cat# A15020 |
| Ammonium acetate | Invitrogen | Cat# AM9070G |
| Universal miRNA Cloning Linker | New England Biolabs | Cat# S1315S |
| T4 RNA Ligase 2, truncated KQ | New England Biolabs | Cat# M0373S |
| SuperScript III Reverse Transcriptase | Invitrogen | Cat# 18080093 |
| 10% polyacrylamide/TBE/Urea gels | Invitrogen | Cat# EC6875 |
| CircLigase ssDNA Ligase | Lucigen | Cat# CL4111K |
| Phusion High-Fidelity PCR Master Mix | New England Biolabs | Cat# M0531S |
| AMPure XP Beads | Beckman Coulter | Cat# A63880 |
| 8% native TBE gels | Invitrogen | Cat# EC6215 |
| Acetic acid glacial, R99.85% | Thermo Fisher Scientific | Cat# A38-212 |
| 2-Mercaptoethanol | Thermo Fisher Scientific | Cat# 60-24-2 |
| DAPI (4',6-Diamidino-2-Phenylindole, Dihydrochloride) | Invitrogen | Cat# D1306 |
| XhoI | New England Biolabs | Cat# R0146S |
| BglII | New England Biolabs | Cat# R0144S |
| EcoRI | New England Biolabs | Cat# R0101S |
| SalI | New England Biolabs | Cat# R0138S |
| BamHI | New England Biolabs | Cat# R0136S |
| NdeI | New England Biolabs | Cat# R0111S |
| MluI | New England Biolabs | Cat# R0198S |
| Imidazole | Sigma | Cat# I5513 |
| Protease inhibitors | Sigma | Cat# S8820 |
| BloxAll | Vector Labs | Cat# SP-6000 |
| Impress Excell staining kit | Vector Labs | Cat# MP-7601 |
| Polybrene | Merck | Cat# H9268 |
| Blasticidin | Gibco | Cat# A1113903 |
| BD PharmLyse | BD Bioscience | Cat# 555899 |
| X-VIVO 20 | Lonza | Cat# 04-448Q |
| BIT serum | Stem Cell Technologies | Cat# 09500 |
| IL3 | Peprotech | Cat# 213-13 |
| IL6 | Peprotech | Cat# 216-16 |
| SCF | Peprotech | Cat# 250-03 |
| TransIT LT1 | Mirus | Cat# MIR-2304 |
| Opti-MEM | Invitrogen | Cat# 31985062 |
| M3434 methylcellulose | Stem Cell Technologies | Cat# 03434 |
| Bradford assay | Bio-Rad | Cat# 5000006 |
| Polyvinylidene difluoride membranes | Millipore | Cat# IPVH00010 |
| StemMACS HSC-CFU semi-solid medium | Miltenyi Biotec | Cat# 130-091-280 |
| P1 nuclease | Sigma | Cat# N8630-1VL |
| rSAP | New England Biolabs | Cat# M0371S |
| Millex-GV 0.22u filters | Millipore Sigma | Cat# SLGV033RS |
| Doxycycline | Sigma | Cat# D9891 |
| 2-hydroxyproply beta-cyclodextrin vehicle | Sigma | Cat# H107 |
| D-luciferin | BioVision | Cat# 7903-1G |
| CuSO4 | Sigma | Cat# 908940 |
| Tris(benzyltriazolylmethyl)amine | Sigma | Cat# 762342 |
| Sodium L-ascorbate | Sigma | Cat# A7631 |
| Critical Commercial Assays | ||
| NEBNext Multiplex Small RNA Library Prep Set for Illumina (Set 1) | New England Biolabs | Cat# E7300S |
| MinElute PCR Purification Kit (50) | QIAGEN | Cat# 28004 |
| RNA Clean & Concentrator −5 | Zymo Research | Cat# R1013 |
| Quick-DNA microprep kit | Zymo Research | Cat# D3020 |
| mirVana miRNA Isolation Kit | Invitrogen | Cat# AM1560 |
| METTL1 TaqMan Copy Number Assay | Applied Biosystems | Cat# 4400291 |
| TaqMan Copy Number Reference Assay, RNase P, Human | Applied Biosystems | Cat# 4403326 |
| Annexin V-FITC Apoptosis Detection Kit | BioVision | Cat# K101 |
| FITC BrdU Flow Kit | BD Pharmigen | Cat# 559619 |
| Dual-Luciferase Reporter Assay | Promega | Cat# E1910 |
| TruSeq Ribo Profile system | Illumina | Cat# PHMR12126 |
| RNeasy Mini kit | Qiagen | Cat# 74104 |
| miRNeasy Kit | Qiagen | Cat# 217004 |
| SuperScript VILO cDNA Synthesis kit | Life Technologies | Cat# 11754050 |
| Fast SybrGreen PCR mastermix | ThermoFisher | Cat# 4385612 |
| APC BrdU Flow Kit | BD Pharmigen | Cat# 51-9000019AK |
| Lineage Cell Depletion Kit | Miltenyi Biotec | Cat# 130-090-858 |
| SILAC Protein Quantitation Kit (Trypsin) – DMEM | Thermo Scientific | A33972 |
| Deposited Data | ||
| Raw images of Westerns and Northern blots | http://dx.doi.org/10.17632/vpy4t2bvp2.1 | N/A |
| Sequencing data | https://www.ncbi.nlm.nih.gov/geo/query/acc.cgi?acc=GSE150076 | GSE150076 |
| Code | https://github.com/rnabioinfor/TRAC-Seq https://github.com/rnabioinfor/METTL1_m7G http://rnabioinfor.tch.harvard.edu/RiboToolkit | N/A |
| TCGA database | http://cancergenome.nih.gov/ | N/A |
| Experimental Models: Cell Lines | ||
| Human White Preadipocytes (HWP) | Promocell | Cat# C-12732 |
| Wt MEFs | ATCC | Cat# CRL-2991 |
| T98G | ATCC | Cat# CRL-1690 |
| 93T449 | ATCC | Cat# CRL-3043 |
| LNZ308 | ATCC | Cat# CRL11543 |
| LP6 | Snyder et al., 2009 | N/A |
| LPS141 | Snyder et al., 2009 | N/A |
| LPS853 | Ou et al., 2015 | N/A |
| 93T449 | Pedeutour et al., 1999 | N/A |
| MOLM-13 | Sanger Institute Cancer Cell Collection (https://cellmodelpassports.sanger.ac.uk | N/A |
| MV4-11 | Sanger Institute Cancer Cell Collection (https://cellmodelpassports.sanger.ac.uk | N/A |
| THP-1 | Sanger Institute Cancer Cell Collection (https://cellmodelpassports.sanger.ac.uk | N/A |
| NOMO-1 | Sanger Institute Cancer Cell Collection (https://cellmodelpassports.sanger.ac.uk | N/A |
| EOL-1 | Sanger Institute Cancer Cell Collection (https://cellmodelpassports.sanger.ac.uk | N/A |
| HEL | Sanger Institute Cancer Cell Collection (https://cellmodelpassports.sanger.ac.uk | N/A |
| HL-60 | Sanger Institute Cancer Cell Collection (https://cellmodelpassports.sanger.ac.uk | N/A |
| MEC-1 | Sanger Institute Cancer Cell Collection (https://cellmodelpassports.sanger.ac.uk | N/A |
| MEC-2 | Sanger Institute Cancer Cell Collection (https://cellmodelpassports.sanger.ac.uk | N/A |
| JURKAT | Sanger Institute Cancer Cell Collection (https://cellmodelpassports.sanger.ac.uk | N/A |
| SU-DHL-5 | Sanger Institute Cancer Cell Collection (https://cellmodelpassports.sanger.ac.uk | N/A |
| BxPC3 | Sanger Institute Cancer Cell Collection (https://cellmodelpassports.sanger.ac.uk | N/A |
| SU86.86 | Sanger Institute Cancer Cell Collection (https://cellmodelpassports.sanger.ac.uk | N/A |
| B16F10 | Sanger Institute Cancer Cell Collection (https://cellmodelpassports.sanger.ac.uk | N/A |
| PANC-1 | Sanger Institute Cancer Cell Collection (https://cellmodelpassports.sanger.ac.uk | N/A |
| PA-TU-8988T | Sanger Institute Cancer Cell Collection (https://cellmodelpassports.sanger.ac.uk | N/A |
| HEK-293T | Sanger Institute Cancer Cell Collection (https://cellmodelpassports.sanger.ac.uk | N/A |
| Experimental Models: Organisms/Strains | ||
| NU/J (Nude) immunodeficient mice | Jackson Laboratory | Cat# #002019 |
| NSGS mice | Sanger Institute Mouse Facility | N/A |
| Rag2−/− IL2RG−/− mice | Sanger Institute Mouse Facility | N/A |
| Flt3ITD/+ mice | Gary Gilliland | |
| Rosa26Cas9/+ mice | Sanger Institute Mouse Facility | N/A |
| NrasG12D/+ mice | Sanger Institute Mouse Facility | N/A |
| Npm1flox–cA/+ mice | Sanger Institute Mouse Facility | N/A |
| Npm1flox–cA/+ mice | Sanger Institute Mouse Facility | N/A |
| Oligonucleotides | ||
| Oligonucleotides were listed in Table S8 | This manuscript | N/A |
| Recombinant DNA | ||
| pET30a-AlkB | Addgene | Cat# 79050 |
| pET30a-AlkB-D135S | Addgene | Cat# 79051 |
| pET-Duet-1 | EMD Biosciences | Cat# 71146 |
| psiCheck-2 | Promega | Cat# C8021 |
| pBABE-neo | Addgene | Cat# 1767 |
| pLKO.1 puro | Addgene | Cat# 8453 |
| pBABE-neo-WDR4 | This manuscript | N/A |
| pLKO.1-puro-ΔU6 | This manuscript | N/A |
| pLKO.1-puro-ΔU6-Arg-TCT-4-1 | This manuscript | N/A |
| pLKO.1-puro-ΔU6-Arg-TCT-4 T34>C | This manuscript | N/A |
| psiCheck2-RLuc-AGA-sensor | This manuscript | N/A |
| pBABE-Puro-Flag-METTL1 | Lin et al., 2018 | N/A |
| pBABE-Puro-Flag-METTL1-Mut (L160A,D163A) | Lin et al., 2018 | N/A |
| Luciferase–expressing plasmid | System Biosciences | Cat# LL205PA-1 |
| pBi-CMV2 | Clontech | Cat# 631631 |
| pBi-CMV2-mCherry | This manuscript | N/A |
| pBi-CMV2-mCherry-Hmga2-WT | This manuscript | N/A |
| pBi-CMV2-mCherry-Hmga2-MUT | This manuscript | N/A |
| Software and Algorithms | ||
| DESeq | http://bioconductor.org/packages/release/bioc/html/DESeq.html | N/A |
| RiboToolkit | https://bioinformatics.caf.ac.cn/RiboToolkit_demo | N/A |
| Bowtie2 | http://bowtie-bio.sourceforge.net N/A | N/A |
| TopHat | https://ccb.jhu.edu/software/tophat/manual.shtml | N/A |
| Toppgene | https://toppgene.cchmc.org | N/A |
| HTSeq | https://htseq.readthedocs.io/en/release_0.10.0/ | N/A |
| Bedtools | http://bedtools.readthedocs.io/en/latest/ | N/A |
| mirTools 2.0 | http://www.wzgenomics.cn/mr2_dev/ | N/A |
| ARM-Seq | http://lowelab.ucsc.edu/software/ | N/A |
| trim_galore | https://www.bioinformatics.babraham.ac.uk/projects/trim_galore | N/A |
| cleavage_score.R | https://github.com/rnabioinfor/TRAC-Seq | N/A |
Highlights.
METTL1-mediated tRNA modification drives oncogenic transformation.
Changes in the tRNA pool remodels the mRNA ‘translatome’ in a codon-biased manner.
Arg-TCT-4-1 is a METTL1 substrate with oncogenic properties.
METTL1 and Arg-TCT-4-1 up-regulation increase expression of growth-promoting proteins.
ACKNOWLEDGEMENTS
E.A.O. was supported by the Pew Latin American Fellows Program in the Biomedical Sciences from Pew Charitable Trusts and by a fellowship from the Damon Runyon Cancer Research Foundation (DRG-2378–19). M.P. was supported by a grant from the National Institute of Diabetes and Digestive and Kidney Diseases (NIH-NIDDK) (K01DK121861) and a fellowship from the Manton Center for Orphan Disease Research. R.I.G. was supported by an Outstanding Investigator Award (R35CA232115) from the National Cancer Institute (NCI) of the NIH. K.T is funded by Wellcome with a Sir Henry Wellcome Fellowship (RG94424). G.S.V. is funded by a Cancer Research UK Senior Cancer Fellowship (C22324/A23015). We thank Jonathan Fletcher, Eric Snyder, and Florence Pedeutour for the LPS cell lines. We also thank Ross Tomaino from the Taplin Mass Spectrometry Facility for his valuable help in the SILAC proteomics analysis.
Footnotes
DECLARATION OF INTERESTS
R.I.G. and F.J.S. are co-founders and scientific advisory board members of 28-7 Therapeutics. R.I.G. is a co-founder and scientific advisory board member of Theon Therapeutics. E.Y. is co-funded by STORM Therapeutics.
Publisher's Disclaimer: This is a PDF file of an unedited manuscript that has been accepted for publication. As a service to our customers we are providing this early version of the manuscript. The manuscript will undergo copyediting, typesetting, and review of the resulting proof before it is published in its final form. Please note that during the production process errors may be discovered which could affect the content, and all legal disclaimers that apply to the journal pertain.
REFERENCESUncategorized References
- Alexandrov A, Chernyakov I, Gu W, Hiley SL, Hughes TR, Grayhack EJ, and Phizicky EM (2006). Rapid tRNA decay can result from lack of nonessential modifications. Mol Cell 21, 87–96. [DOI] [PubMed] [Google Scholar]
- Alexandrov A, Grayhack EJ, and Phizicky EM (2005). tRNA m7G methyltransferase Trm8p/Trm82p: evidence linking activity to a growth phenotype and implicating Trm82p in maintaining levels of active Trm8p. RNA 11, 821–830. [DOI] [PMC free article] [PubMed] [Google Scholar]
- Alexandrov A, Martzen MR, and Phizicky EM (2002). Two proteins that form a complex are required for 7-methylguanosine modification of yeast tRNA. RNA 8, 1253–1266. [DOI] [PMC free article] [PubMed] [Google Scholar]
- Anders S, Pyl PT, and Huber W (2015). HTSeq--a Python framework to work with high-throughput sequencing data. Bioinformatics 31, 166–169. [DOI] [PMC free article] [PubMed] [Google Scholar]
- Bahr A, Hankeln T, Fiedler T, Hegemann J, and Schmidt ER (1999). Molecular analysis of METTL1, a novel human methyltransferase-like gene with a high degree of phylogenetic conservation. Genomics 57, 424–428. [DOI] [PubMed] [Google Scholar]
- Barbieri I, Tzelepis K, Pandolfini L, Shi J, Millan-Zambrano G, Robson SC, Aspris D, Migliori V, Bannister AJ, Han N, et al. (2017). Promoter-bound METTL3 maintains myeloid leukaemia by m(6)A-dependent translation control. Nature 552, 126–131. [DOI] [PMC free article] [PubMed] [Google Scholar]
- Begley U, Dyavaiah M, Patil A, Rooney JP, DiRenzo D, Young CM, Conklin DS, Zitomer RS, and Begley TJ (2007). Trm9-catalyzed tRNA modifications link translation to the DNA damage response. Mol Cell 28, 860–870. [DOI] [PMC free article] [PubMed] [Google Scholar]
- Birch J, Clarke CJ, Campbell AD, Campbell K, Mitchell L, Liko D, Kalna G, Strathdee D, Sansom OJ, Neilson M, et al. (2016). The initiator methionine tRNA drives cell migration and invasion leading to increased metastatic potential in melanoma. Biol Open 5, 1371–1379. [DOI] [PMC free article] [PubMed] [Google Scholar]
- Blanco S, Bandiera R, Popis M, Hussain S, Lombard P, Aleksic J, Sajini A, Tanna H, Cortes-Garrido R, Gkatza N, et al. (2016). Stem cell function and stress response are controlled by protein synthesis. Nature 534, 335–340. [DOI] [PMC free article] [PubMed] [Google Scholar]
- Chen M, Wei L, Law CT, Tsang FH, Shen J, Cheng CL, Tsang LH, Ho DW, Chiu DK, Lee JM, et al. (2017). RNA N6-methyladenosine methyltransferase METTL3 promotes liver cancer progression through YTHDF2 dependent post-transcriptional silencing of SOCS2. Hepatology. [DOI] [PubMed] [Google Scholar]
- Choe J, Lin S, Zhang W, Liu Q, Wang L, Ramirez-Moya J, Du P, Kim W, Tang S, Sliz P, et al. (2018). mRNA circularization by METTL3-eIF3h enhances translation and promotes oncogenesis. Nature 561, 556–560. [DOI] [PMC free article] [PubMed] [Google Scholar]
- Chou HJ, Donnard E, Gustafsson HT, Garber M, and Rando OJ (2017). Transcriptome-wide Analysis of Roles for tRNA Modifications in Translational Regulation. Mol Cell 68, 978–992 e974. [DOI] [PMC free article] [PubMed] [Google Scholar]
- Chu JM, Ye TT, Ma CJ, Lan MD, Liu T, Yuan BF, and Feng YQ (2018). Existence of Internal N7-Methylguanosine Modification in mRNA Determined by Differential Enzyme Treatment Coupled with Mass Spectrometry Analysis. ACS Chem Biol 13, 3243–3250. [DOI] [PubMed] [Google Scholar]
- Clarke CJ, Berg TJ, Birch J, Ennis D, Mitchell L, Cloix C, Campbell A, Sumpton D, Nixon C, Campbell K, et al. (2016). The Initiator Methionine tRNA Drives Secretion of Type II Collagen from Stromal Fibroblasts to Promote Tumor Growth and Angiogenesis. Curr Biol 26, 755–765. [DOI] [PMC free article] [PubMed] [Google Scholar]
- Cozen AE, Quartley E, Holmes AD, Hrabeta-Robinson E, Phizicky EM, and Lowe TM (2015). ARM-seq: AlkB-facilitated RNA methylation sequencing reveals a complex landscape of modified tRNA fragments. Nat Methods 12, 879–884. [DOI] [PMC free article] [PubMed] [Google Scholar]
- de Crecy-Lagard V, Boccaletto P, Mangleburg CG, Sharma P, Lowe TM, Leidel SA, and Bujnicki JM (2019). Matching tRNA modifications in humans to their known and predicted enzymes. Nucleic Acids Res 47, 2143–2159. [DOI] [PMC free article] [PubMed] [Google Scholar]
- Delaunay S, and Frye M (2019). RNA modifications regulating cell fate in cancer. Nat Cell Biol 21, 552–559. [DOI] [PubMed] [Google Scholar]
- Deng W, Babu IR, Su D, Yin S, Begley TJ, and Dedon PC (2015). Trm9-Catalyzed tRNA Modifications Regulate Global Protein Expression by Codon-Biased Translation. PLoS Genet 11, e1005706. [DOI] [PMC free article] [PubMed] [Google Scholar]
- Dittmar KA, Goodenbour JM, and Pan T (2006). Tissue-specific differences in human transfer RNA expression. PLoS Genet 2, e221. [DOI] [PMC free article] [PubMed] [Google Scholar]
- Dobin A, Davis CA, Schlesinger F, Drenkow J, Zaleski C, Jha S, Batut P, Chaisson M, and Gingeras TR (2013). STAR: ultrafast universal RNA-seq aligner. Bioinformatics 29, 15–21. [DOI] [PMC free article] [PubMed] [Google Scholar]
- Frye M, and Bornelov S (2020). CONCUR: quick and robust calculation of codon usage from ribosome profiling data. Bioinformatics. [DOI] [PMC free article] [PubMed] [Google Scholar]
- Frye M, and Watt FM (2006). The RNA methyltransferase Misu (NSun2) mediates Myc-induced proliferation and is upregulated in tumors. Curr Biol 16, 971–981. [DOI] [PubMed] [Google Scholar]
- Gingold H, Tehler D, Christoffersen NR, Nielsen MM, Asmar F, Kooistra SM, Christophersen NS, Christensen LL, Borre M, Sorensen KD, et al. (2014). A dual program for translation regulation in cellular proliferation and differentiation. Cell 158, 1281–1292. [DOI] [PubMed] [Google Scholar]
- Goodarzi H, Nguyen HCB, Zhang S, Dill BD, Molina H, and Tavazoie SF (2016). Modulated Expression of Specific tRNAs Drives Gene Expression and Cancer Progression. Cell 165, 1416–1427. [DOI] [PMC free article] [PubMed] [Google Scholar]
- Ishimura R, Nagy G, Dotu I, Zhou H, Yang XL, Schimmel P, Senju S, Nishimura Y, Chuang JH, and Ackerman SL (2014). RNA function. Ribosome stalling induced by mutation of a CNS- specific tRNA causes neurodegeneration. Science 345, 455–459. [DOI] [PMC free article] [PubMed] [Google Scholar]
- Jovine L, Djordjevic S, and Rhodes D (2000). The crystal structure of yeast phenylalanine tRNA at 2.0 A resolution: cleavage by Mg(2+) in 15-year old crystals. J Mol Biol 301, 401–414. [DOI] [PubMed] [Google Scholar]
- Kirchner S, and Ignatova Z (2015). Emerging roles of tRNA in adaptive translation, signalling dynamics and disease. Nat Rev Genet 16, 98–112. [DOI] [PubMed] [Google Scholar]
- Langmead B, Trapnell C, Pop M, and Salzberg SL (2009). Ultrafast and memory-efficient alignment of short DNA sequences to the human genome. Genome Biol 10, R25. [DOI] [PMC free article] [PubMed] [Google Scholar]
- Lavallee VP, Lemieux S, Boucher G, Gendron P, Boivin I, Armstrong RN, Sauvageau G, and Hebert J (2016). RNA-sequencing analysis of core binding factor AML identifies recurrent ZBTB7A mutations and defines RUNX1-CBFA2T3 fusion signature. Blood 127, 2498–2501. [DOI] [PubMed] [Google Scholar]
- Leulliot N, Chaillet M, Durand D, Ulryck N, Blondeau K, and van Tilbeurgh H (2008). Structure of the yeast tRNA m7G methylation complex. Structure 16, 52–61. [DOI] [PubMed] [Google Scholar]
- Lin S, Choe J, Du P, Triboulet R, and Gregory RI (2016). The m(6)A Methyltransferase METTL3 Promotes Translation in Human Cancer Cells. Mol Cell 62, 335–345. [DOI] [PMC free article] [PubMed] [Google Scholar]
- Lin S, Liu Q, Jiang YZ, and Gregory RI (2019). Nucleotide resolution profiling of m(7)G tRNA modification by TRAC-Seq. Nat Protoc 14, 3220–3242. [DOI] [PMC free article] [PubMed] [Google Scholar]
- Lin S, Liu Q, Lelyveld VS, Choe J, Szostak JW, and Gregory RI (2018). Mettl1/Wdr4-Mediated m(7)G tRNA Methylome Is Required for Normal mRNA Translation and Embryonic Stem Cell Self-Renewal and Differentiation. Mol Cell 71, 244–255 e245. [DOI] [PMC free article] [PubMed] [Google Scholar]
- Liu Q, Shvarts T, Sliz P, and Gregory RI (2020a). RiboToolkit: an integrated platform for analysis and annotation of ribosome profiling data to decode mRNA translation at codon resolution. Nucleic Acids Res. [DOI] [PMC free article] [PubMed] [Google Scholar]
- Liu Y, Zhang Y, Chi Q, Wang Z, and Sun B (2020b). Methyltransferase-like 1 (METTL1) served as a tumor suppressor in colon cancer by activating 7-methyguanosine (m7G) regulated let-7e miRNA/HMGA2 axis. Life Sci 249, 117480. [DOI] [PubMed] [Google Scholar]
- Macrae T, Sargeant T, Lemieux S, Hebert J, Deneault E, and Sauvageau G (2013). RNA-Seq reveals spliceosome and proteasome genes as most consistent transcripts in human cancer cells. PLoS One 8, e72884. [DOI] [PMC free article] [PubMed] [Google Scholar]
- Nedialkova DD, and Leidel SA (2015). Optimization of Codon Translation Rates via tRNA Modifications Maintains Proteome Integrity. Cell 161, 1606–1618. [DOI] [PMC free article] [PubMed] [Google Scholar]
- Okamoto M, Fujiwara M, Hori M, Okada K, Yazama F, Konishi H, Xiao Y, Qi G, Shimamoto F, Ota T, et al. (2014). tRNA modifying enzymes, NSUN2 and METTL1, determine sensitivity to 5-fluorouracil in HeLa cells. PLoS Genet 10, e1004639. [DOI] [PMC free article] [PubMed] [Google Scholar]
- Ou WB, Zhu J, Eilers G, Li X, Kuang Y, Liu L, Marino-Enriquez A, Yan Z, Li H, Meng F, et al. (2015). HDACi inhibits liposarcoma via targeting of the MDM2-p53 signaling axis and PTEN, irrespective of p53 mutational status. Oncotarget 6, 10510–10520. [DOI] [PMC free article] [PubMed] [Google Scholar]
- Pabst C, Bergeron A, Lavallee VP, Yeh J, Gendron P, Norddahl GL, Krosl J, Boivin I, Deneault E, Simard J, et al. (2016). GPR56 identifies primary human acute myeloid leukemia cells with high repopulating potential in vivo. Blood 127, 2018–2027. [DOI] [PubMed] [Google Scholar]
- Pandolfini L, Barbieri I, Bannister AJ, Hendrick A, Andrews B, Webster N, Murat P, Mach P, Brandi R, Robson SC, et al. (2019). METTL1 Promotes let-7 MicroRNA Processing via m7G Methylation. Mol Cell 74, 1278–1290 e1279. [DOI] [PMC free article] [PubMed] [Google Scholar]
- Pavon-Eternod M, Gomes S, Geslain R, Dai Q, Rosner MR, and Pan T (2009). tRNA overexpression in breast cancer and functional consequences. Nucleic Acids Res 37, 7268–7280. [DOI] [PMC free article] [PubMed] [Google Scholar]
- Pedeutour F, Forus A, Coindre JM, Berner JM, Nicolo G, Michiels JF, Terrier P, Ranchere-Vince D, Collin F, Myklebost O, et al. (1999). Structure of the supernumerary ring and giant rod chromosomes in adipose tissue tumors. Genes Chromosomes Cancer 24, 30–41. [PubMed] [Google Scholar]
- Pinkard O, McFarland S, Sweet T, and Coller J (2020). Quantitative tRNA-sequencing uncovers metazoan tissue-specific tRNA regulation. Nat Commun 11, 4104. [DOI] [PMC free article] [PubMed] [Google Scholar]
- Quinlan AR (2014). BEDTools: The Swiss-Army Tool for Genome Feature Analysis. Curr Protoc Bioinformatics 47, 11 12 11–34. [DOI] [PMC free article] [PubMed] [Google Scholar]
- Rapino F, Delaunay S, Rambow F, Zhou Z, Tharun L, De Tullio P, Sin O, Shostak K, Schmitz S, Piepers J, et al. (2018). Codon-specific translation reprogramming promotes resistance to targeted therapy. Nature 558, 605–609. [DOI] [PubMed] [Google Scholar]
- Saletore Y, Meyer K, Korlach J, Vilfan ID, Jaffrey S, and Mason CE (2012). The birth of the Epitranscriptome: deciphering the function of RNA modifications. Genome Biol 13, 175. [DOI] [PMC free article] [PubMed] [Google Scholar]
- Santos M, Fidalgo A, Varanda AS, Oliveira C, and Santos MAS (2019). tRNA Deregulation and Its Consequences in Cancer. Trends Mol Med 25, 853–865. [DOI] [PubMed] [Google Scholar]
- Simon C, Chagraoui J, Krosl J, Gendron P, Wilhelm B, Lemieux S, Boucher G, Chagnon P, Drouin S, Lambert R, et al. (2012). A key role for EZH2 and associated genes in mouse and human adult T-cell acute leukemia. Genes Dev 26, 651–656. [DOI] [PMC free article] [PubMed] [Google Scholar]
- Snyder EL, Sandstrom DJ, Law K, Fiore C, Sicinska E, Brito J, Bailey D, Fletcher JA, Loda M, Rodig SJ, et al. (2009). c-Jun amplification and overexpression are oncogenic in liposarcoma but not always sufficient to inhibit the adipocytic differentiation programme. J Pathol 218, 292–300. [DOI] [PubMed] [Google Scholar]
- Tian QH, Zhang MF, Zeng JS, Luo RG, Wen Y, Chen J, Gan LG, and Xiong JP (2019). METTL1 overexpression is correlated with poor prognosis and promotes hepatocellular carcinoma via PTEN. J Mol Med (Berl) 97, 1535–1545. [DOI] [PubMed] [Google Scholar]
- Torres AG, Batlle E, and Ribas de Pouplana L (2014). Role of tRNA modifications in human diseases. Trends Mol Med 20, 306–314. [DOI] [PubMed] [Google Scholar]
- Tzelepis K, Koike-Yusa H, De Braekeleer E, Li Y, Metzakopian E, Dovey OM, Mupo A, Grinkevich V, Li M, Mazan M, et al. (2016). A CRISPR Dropout Screen Identifies Genetic Vulnerabilities and Therapeutic Targets in Acute Myeloid Leukemia. Cell Rep 17, 1193–1205. [DOI] [PMC free article] [PubMed] [Google Scholar]
- Vu LP, Pickering BF, Cheng Y, Zaccara S, Nguyen D, Minuesa G, Chou T, Chow A, Saletore Y, MacKay M, et al. (2017). The N6-methyladenosine (m6A)-forming enzyme METTL3 controls myeloid differentiation of normal hematopoietic and leukemia cells. Nat Med 23, 1369–1376. [DOI] [PMC free article] [PubMed] [Google Scholar]
- Wikman H, Nymark P, Vayrynen A, Jarmalaite S, Kallioniemi A, Salmenkivi K, Vainio-Siukola K, Husgafvel-Pursiainen K, Knuutila S, Wolf M, et al. (2005). CDK4 is a probable target gene in a novel amplicon at 12q13.3-q14.1 in lung cancer. Genes Chromosomes Cancer 42, 193–199. [DOI] [PubMed] [Google Scholar]
- Wu Q, Medina SG, Kushawah G, DeVore ML, Castellano LA, Hand JM, Wright M, and Bazzini AA (2019). Translation affects mRNA stability in a codon-dependent manner in human cells. Elife 8. [DOI] [PMC free article] [PubMed] [Google Scholar]
- Yang J, Rajan SS, Friedrich MJ, Lan G, Zou X, Ponstingl H, Garyfallos DA, Liu P, Bradley A, and Metzakopian E (2019). Genome-Scale CRISPRa Screen Identifies Novel Factors for Cellular Reprogramming. Stem Cell Reports 12, 757–771. [DOI] [PMC free article] [PubMed] [Google Scholar]
- Zhang LS, Liu C, Ma H, Dai Q, Sun HL, Luo G, Zhang Z, Zhang L, Hu L, Dong X, et al. (2019). Transcriptome-wide Mapping of Internal N(7)-Methylguanosine Methylome in Mammalian mRNA. Mol Cell 74, 1304–1316 e1308. [DOI] [PMC free article] [PubMed] [Google Scholar]
- Zhang Z, Ye Y, Gong J, Ruan H, Liu CJ, Xiang Y, Cai C, Guo AY, Ling J, Diao L, et al. (2018). Global analysis of tRNA and translation factor expression reveals a dynamic landscape of translational regulation in human cancers. Commun Biol 1, 234. [DOI] [PMC free article] [PubMed] [Google Scholar]
- Zinshteyn B, and Gilbert WV (2013). Loss of a conserved tRNA anticodon modification perturbs cellular signaling. PLoS Genet 9, e1003675. [DOI] [PMC free article] [PubMed] [Google Scholar]
Associated Data
This section collects any data citations, data availability statements, or supplementary materials included in this article.
Supplementary Materials
Table S1. tRNA abundance changes in shMETTL1 vs shGFP control cells. Related to Figure 2B
Table S2. SILAC proteomic data from shMETTL1 vs shGFP control cells. Related fo Figure 2F
Table S3. tRNA abundance changes in METTL1/WDR4 overexpressing cells vs Empty vector control cells. Related to Figure 3C
Table S4. Ribo-Seq data from METTL1/WDR4 overexpressing cells vs Empty vector control cells. Related to Figure 5A
Table S5. SILAC proteomics data from METTL1/WDR4 overexpressing cells vs Empty vector control cells. Related to Figure 5H
Table S6. tRNA expression levels from TCGA datasets. Related to Figure 6A
Table S7. SILAC proteomics data from Arg-TCT-4-1 overexpressing cells vs Empty vector control cells. Related to Figure 7A
Table S8. Sequences of primers and oligos used in this study. Related to STAR Methods Section
Data Availability Statement
The accession number for the TRAC-Seq and Ribo-Seq data reported in this paper can be found under GEO GSE150076. The codes used for TRAC-Seq, TCGA analyses, SILAC proteomics and codon analyses are available at https://github.com/rnabioinfor/TRAC-Seq and https://github.com/rnabioinfor/METTL1_m7G). RiboToolkit was used for Ribo-seq analyses and the code is available at http://rnabioinfor.tch.harvard.edu/RiboToolkit. Raw data from Western and Northern blots were deposited on Mendeley at http://dx.doi.org/10.17632/vpy4t2bvp2.1