

Abstract
While changes in heme oxygenase (HO-1) in lung cancer have already been reported, conflicting results were obtained for enzyme expression in human lung cancer specimens. Therefore, the aim of this work was to study HO-1 expression in a large collection of human lung cancer samples. For this purpose, we analyzed the expression of HO-1 in an organized tissue microarray (TMA) and investigated its correlation with clinicopathological data. Ninety-six percent of tumor samples were positive for HO-1, and the expression of HO-1 was significantly higher in cancerous than in non-cancerous tissues. Importantly, HO-1 expression correlated with advanced stages and lymph node involvement. Additionally, quantitative RT-PCR in 18 pairs of human lung carcinomas and their adjacent non-malignant tissues was performed. Our results demonstrate that HO-1 protein is upregulated in epithelial malignant cells in NSCLC and its expression is associated with higher stages of the disease. Additionally, different subcellular localization is observed between tumor and adjacent non-malignant tissues.
Keywords: Heme-oxygenase-1, Lung cancer, NSCLC, Tissue microarray, Immunohistochemistry
1. Introduction
Heme oxygenase 1 (HO-1) catalyzes the first rate-limiting step in the degradation of heme, rendering biologically active products as biliverdin, ferrous iron and carbon monoxide [1]. By reducing oxidative injury, HO-1 plays a protective role in the defense against oxidative and inflammatory insults in cells and tissues, maintaining cellular homeostasis [2]. In the lung, HO-1 is expressed in various cell types including alveolar macrophages, endothelial cells, fibroblasts and type II pneumocytes [3,4]. HO-1 expression is upregulated in several pulmonary diseases including asthma, cystic fibrosis, acute respiratory distress syndrome and chronic obstructive pulmonary disease [5–8].
The influence of HO-1 activity on the growth of cancer cells is supported by a variety of studies involving cell tissue cultures and/or animal models [9]; however a pro- or antiproliferative role for cells in tumors seems to be highly tissue-specific. Related to its role in lung tumor progression, HO-1 inhibition has been shown to reduce tumor growth in a mouse model of lung cancer [10], to inhibit proliferation in lung cancer A549 cells [11] and to enhance the chemosensitivity of A549 to cisplatin [12]. Moreover, it was recently reported that lung adenocarcinoma patients had a significantly higher frequency of a specific promoter polymorphism, suggesting a possible association between altered HO-1 expression and the development of lung adenocarcinoma [13].
Regarding enzyme expression in lung cancer, there are few reports showing HO-1 expression in human lung cancer specimens. In one of them, decreased HO-1 expression has been shown in the macrophages of non-small cell lung cancer tissues [14] while another study on 30 patients with a history of smoking, lung tumor tissues showed significantly increased HO-1 levels when compared to their respective adjacent normal tissues [15].
In order to shed light upon the role of HO-1 expression in lung tumors we set this study with the aim to examine HO-1 expression levels in a larger number of human lung cancer specimens obtained from local health centers and assembled in a tissue microarray (TMA) [16] and to correlate enzyme expression with clinicopathological features.
2. Materials and methods
2.1. Human tissue specimens and tissue microarray construction
Samples were obtained in consecutive order from 341 lung cancer patients who underwent surgery at local hospitals (Buenos Aires, Argentina), between January 1st 1990 and December 31th 2004. The protocol was approved by the Hospitals’ ethic committees and follows the Ethical Principles enunciated by the Declaration of Helsinki. Data collected included age, gender, histopathological subtype, tumor location, TNM staging (6th edition) and overall survival time. In 3 patients with unsuspected metastatic disease and in other 3 with T4 tumors there was no need to obtain mediastinal lymph node biopsies for the staging, thus explaining the difference in the total number of N status registries. TMAs were constructed using the approach described by Kononen et al. [17]. Additionally, a cohort of 18 independent tissue samples of lung cancer patients was studied and used for antibody validation. Also, paired tumor/adjacent fresh tissue samples were obtained from a cohort of 18 patients and preserved in RNA Later (Ambion Inc., Austin, TX).
2.2. Immunohistochemistry
Immunohistochemical staining was performed as previously described [18]. Sections were incubated with primary rabbit anti-human HO-1 antibody (StressGen Biorreagents, Canada). For negative controls, the primary antibodies were replaced with isotype-specific IgG.
2.3. Evaluation of staining intensity and statistical analysis
The specimens were semi-quantitated by the percentage of stained cells and the mean percentage in 10 randomly chosen fields of the individual IHC was determined. Each specimen was then assigned to one of 4 groups (0 = 0–10% of stained cells; 1 = 11–24% of stained cells; 2 = 25–75% of stained cells; 3 = more than 75% of stained cells). The statistical significance of HO-1 expression levels between groups was determined by χ2-test for categorical variables or Mann–Whitney test for continuous variables.
Overall survival according to HO-1 expression was constructed using Kaplan–Meier survival curves, and the log-rank test was used for comparison of survival curves. p-Values of less than 0.05 indicated a significant result.
2.4. RNA amplification and quantitative real-time PCR (qRT-PCR)
Total RNA was extracted from 200mg of frozen tissue using the SV Total RNA Isolation System (Promega). HO-1 expression was quantified by qPCR using the following primer set: forward 5'-GAGGCCAAGACTGCGTTCC-3'; reverse 5'-GGTGTCATGGGTCAGCAGC-3'. The amount of HO-1 quantified was normalized with actin: forward 5'-GTGGGCCGCTCTAGGCACCA-3'; reverse 5'-CGGTTGGCCTTAGGGTTCAGGGGGG-3'.
2.5. Cell lines
Lung adenocarcinoma A549 and NIH3T3 cells were cultured in DMEM high-glucose medium supplemented with 10% fetal bovine serum, penicillin, streptomycin and amphotericin B (Invitrogen).
2.6. Immunoblotting
A549 and NIH3T3 cells were cultured to 70% confluence and homogenized in lysis buffer. Additionally, 200 mg frozen tumor and adjacent tissues were homogenized and total protein lysates were prepared. Immunoblotting was performed as previously described [18]. Anti human HO-1 (Stress Gen Biorreagents, Canada) or antiactin (Santa Cruz Biotechnology) antibodies were used.
3. Results
3.1. Validation of antibody and HO-1 expression in human lung cancer tissues
Immunospecificity of the antibody for HO-1 in lung tissue was first tested by western blot of protein lysates of human lung adenocarcinoma cells A549 (Fig. 1A). As a positive control we used the NIH3T3 cell line which expresses high amounts of HO-1 [19]. The antibody exclusively recognized one band in A549 cells representing a protein with a mobility corresponding to the molecular weight of HO-1 (32 kDa). Subsequently, we analyzed tissue staining patterns by immunohistochemical evaluation of sections from human lung cancer specimens. In total, 18 individual paraffin blocks were assessed for HO-1 protein expression. Material analyzed included adenocarcinoma, squamous cell carcinoma (SSC), carcinoid, SCLC, and bronquioloalveolar carcinoma. This analysis showed that the antibody displayed strong cytoplasmic staining in tumor epithelial cells (see representative pictures in Fig. 1C–E) compared with no staining when the primary antibody was substituted with a non-immune, isotype-matched IgG (Fig. 1B). Interestingly, tumor clusters frequently show a gradient of HO-1 expression with stronger labeling of tumor cells at the invasion front (Fig. 1E). Sixteen specimens contained adjacent non-cancerous tissues and HO-1 expression was evaluated and compared to their matched tumors. All adjacent non-malignant tissues showed lower percentages of HO-1-stained epithelial cells (Fig. 1F) than their respective malignant tissues (p = 0.01, Mann–Whitney), and enzyme expression was mainly nuclear (Fig. 1F, black arrows). Also, three specimens contained preneoplastic lesions showing HO-1 expression degrees similar to those observed in the tumor tissues. Taken together, this analysis showed that HO-1 could be specifically detected by immunohistochemistry in paraffin-embedded, archived human lung cancer tissues and by Western blot in a lung adenocarcinoma cell line (A549). This antibody was used for further studies of HO-1 expression, and staining of serial sections of the TMA with isotype-matched non-immune antibodies was included as a negative control.
Fig. 1.

HO-1 specific expression in human lung cancer. (A) Western blot showing a specific band for HO-1 in A549 cells. Protein lysates from the NIH3T3 cells served as a positive control. (B) Negative control showing lack of staining. (C and D) Representative IHC of a SCC, at 400× and 1000× magnifications. Arrow indicates cytoplasmic HO-1 in tumor epithelial cells. (E) Representative IHC of a SCC belonging to a different patient, at 400× magnification. An asterisk shows stroma lacking HO-1 expression. (F) Non-malignant adjacent area showing HO-1 staining in some epithelial cells. Black arrows indicate cells with nuclear HO-1.
3.2. Screening of HO-1 protein expression in NSCLC tissue microarrays
To screen widely for HO-1 expression in human lung cancer samples, we performed HO-1 immunostaining on tissue microarrays. These allow for the simultaneous analysis of protein expression in hundreds of tumor tissues organized in a slide with homogenized staining conditions. After excluding cores containing less than 200 cells and tissues that were removed during the immunostaining procedure, the successfully analyzed material included 167 adenocarcinomas (60%), 10 bronchioloalveolar carcinomas (3.5%), 7 carcinoids (2.5%), 18 undifferentiated carcinomas (6.5%), 1 large cell carcinoma (0.35%), 75 SCC (27%) and 8 non-malignant lung tissues. The relevant clinical pathological features of the studied subjects are summarized in Table 1.
Table 1.
Clinico-pathological features of the successfully studied population.
| Clinical-pathological data | N=278 |
|---|---|
| Gender | |
| Male | 209 |
| Female | 69 |
| T status (TNM) | |
| T1 | 31 |
| T2 | 152 |
| T3 | 72 |
| T4 | 23 |
| TNM stage (6th edition) | |
| I | 105 |
| II | 43 |
| III | 126 |
| IV | 4 |
| N status | |
| N0 | 132 |
| N1,2 | 140 |
| Histological subtype | |
| Adenocarcinoma | 167 |
| Squamous cell carcinoma | 75 |
| Large cell carcinoma | 1 |
| Undifferentiated carcinoma | 18 |
| Bronquioloalveolar carcinoma | 10 |
| Carcinoid | 7 |
The rate of HO-1 positive samples was 96% (n = 266) and the tumor samples examined showed variable percentages of HO-1-positive cells (representative selected array cores are shown in Fig. 2A–I). HO-1 was mostly localized to cytoplasm in tumor cells (Fig. 2E and F, black arrows and Fig. 2G–I, insets), and only a few cells showed nuclear staining (Fig. 2H, inset). Non-malignant adjacent tissues showed HO-1 staining in both epithelial and inflammatory cells (Fig. 2 B) and the epithelial cells displayed mainly nuclear (red arrow) HO-1, although the expression rates were much lower than in tumor tissues.
Fig. 2.
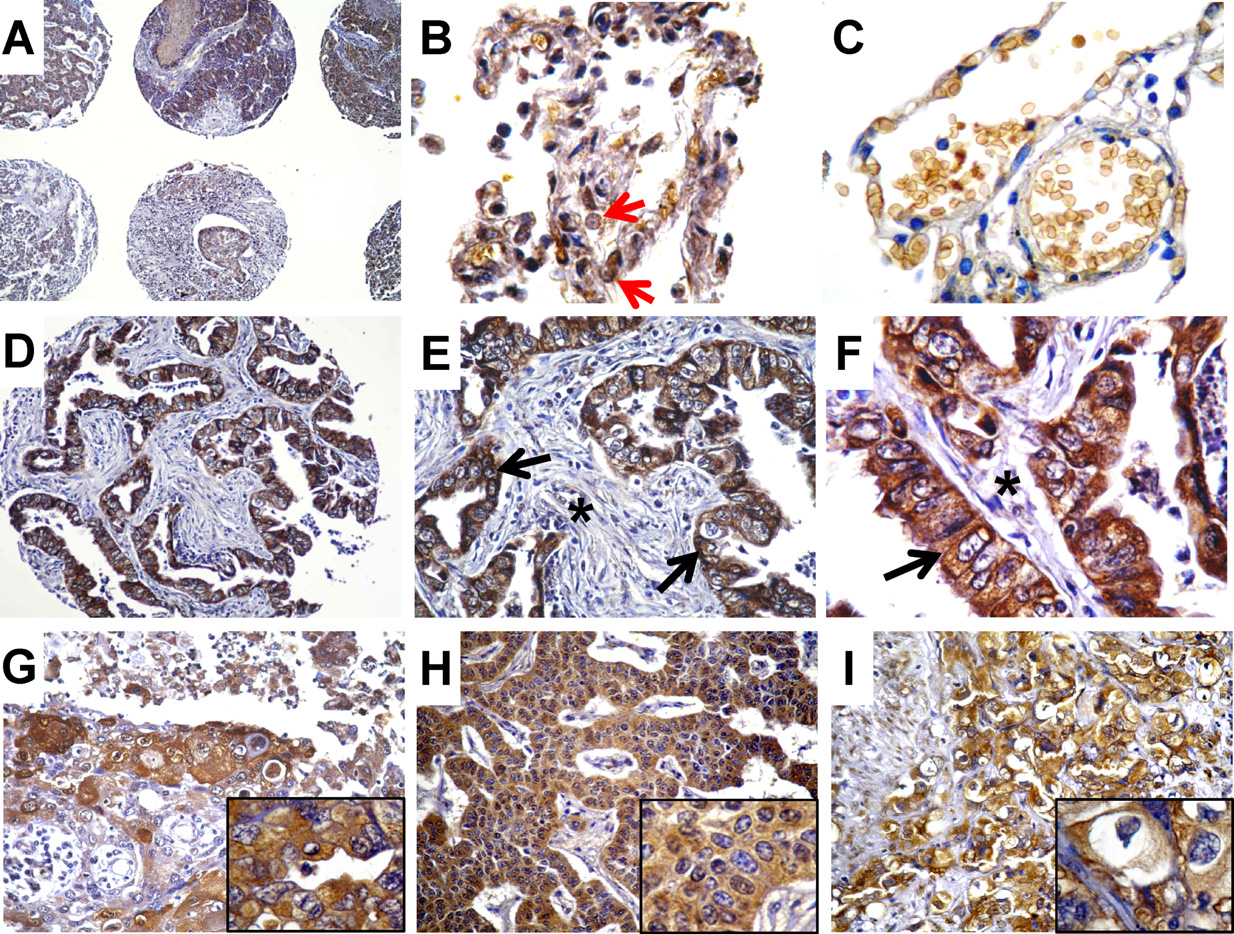
HO-1 expression and localization in samples of the TMA. (A) Different cores at 100× magnification. (B) HO-1 expression in non-malignant epithelial tissue and inflammatory cells, at 1000× magnification. (C) Non-malignant tissue showing lack of HO-1 staining in epithelial cells, 1000×. (D–F) Adenocarcinoma at 200×, 400× and 1000×. Black arrows indicate cytoplasmic HO-1 and asterisk shows lack of HO-1 expression in connective tissue. (G) SCC at 200×. Inset showing cytoplasmic HO-1. (H) Carcinoid at 200×. Inset showing mostly cytoplasmic HO-1 with a few cells presenting nuclear HO-1 staining. (I) SCC at 400×. Inset showing cytoplasmic HO-1.
Additionally, we studied the correlation between HO-1 immunohistochemical staining and gender, stage (TNM), T status and N status (Table 2). For this purpose we dichotomized into low (T1T2) and high (T3T4) T status, early (I and II) and advanced (III, IV) stages and lymph node positive (N1,2) and negative (N0) samples. Interestingly, HO-1 positivity increased with higher stages of the disease (p = 0.038) and with T status (p = 0.020) and was associated with lymph node metastasis (p = 0.035).
Table 2.
HO-1 protein expression was analyzed by immunohistochemical staining of TMA and its correlation with clinical and pathological data was performed. Staining was evaluated as described in Section 2 and samples were classified as: 0 = 0–10% stained cells; 1 = 11–24% of stained cells; 2 = 25–75% of stained cells and 3 = more than 75% of stained cells.
| Clinico pathological parameters | 0 | 1 | 2 | 3 | p * |
|---|---|---|---|---|---|
| n (%) | n (%) | n (%) | n (%) | ||
| Gender | |||||
| Male | 6(2.9) | 83 (39.7) | 86(41.1) | 34(16.3) | 0.087 |
| Female | 6(8.7) | 20(29.0) | 28 (40.6) | 15(21.7) | |
| T status (TNM) | |||||
| T1T2 | 10(5.4) | 71 (38.8) | 64(35.0) | 38 (20.8) | 0.020 |
| T3T4 | 2(2.1) | 32 (33.7) | 50(52.6) | 11(11.6) | |
| TNM stage | |||||
| I II | 8(5.4) | 61 (41.2) | 49(33.1) | 30(20.3) | 0.038 |
| III IV | 4(3.1) | 42 (32.3) | 65 (50.0) | 19(14.6) | |
| Lymph node metastasis | |||||
| N0 | 6(4.5) | 57 (43.2) | 42(31.8) | 27 (20.5) | 0.035 |
| N1,2 | 5(3.6) | 45 (32.1) | 69(49.3) | 21(15.0) | |
p-Values of χ2 test are shown.
3.3. HO-1 expression is not associated to patient overall survival
We next asked whether HO-1 could be considered a prognostic factor in NSCLC, and for this purpose we analyzed if HO-1 protein expression was associated with patient overall survival. For this analysis and since few samples presented negative HO-1 staining we dichotomized the patients into those presenting high HO-1 staining (>50% stained cells) and those presenting low HO-1 staining (<50%). The high expression group had a mean survival time of 1825 days with a median of 1081 days against a mean and median survival of 1235 and 705 days, respectively, for the low expression group. However, no significant differences in patient survival were observed between the two groups (p = 0.72; Fig. 3A). Additional further analysis with patients classified according to the semiquantification of the expression levels of HO-1 gave similar results (p = 0.42; Fig. 3 B).
Fig. 3.
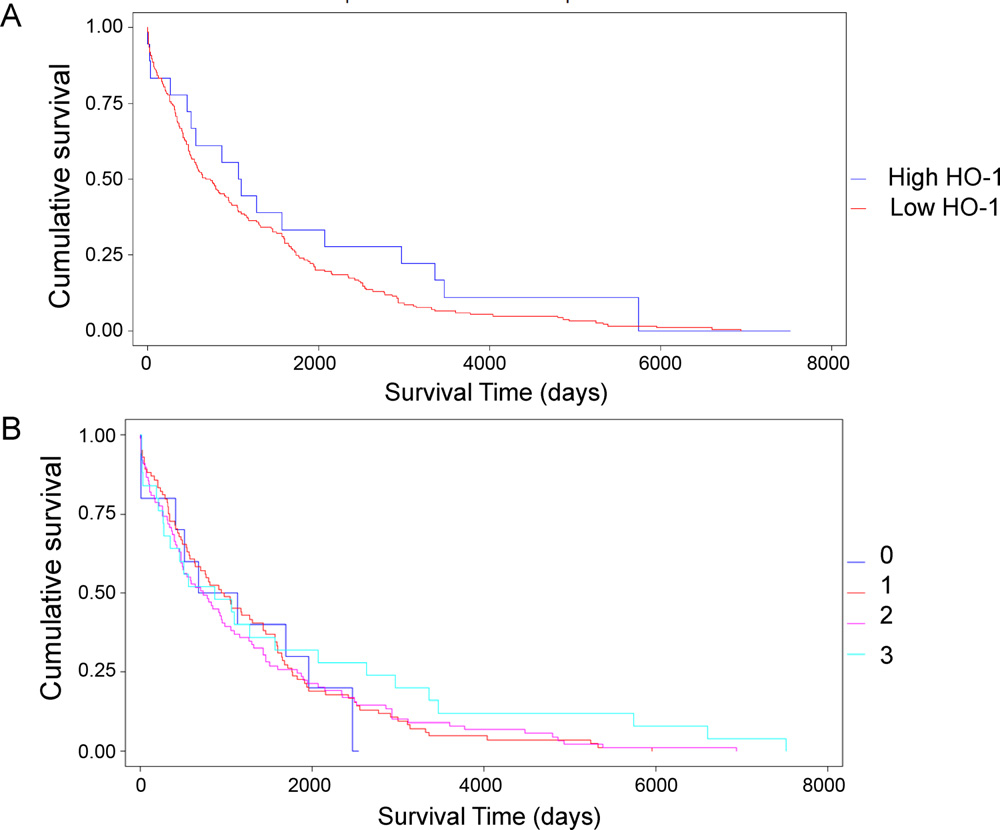
Kaplan–Meier plot of survival times in NSCLC patients classified by HO-1 expression. (A) Patients were dichotomized into HO-1-low expressing and -high expressing tumor specimens. (B) Patients were classified according to the semiquantification of HO-1.
3.4. HO-1 mRNA and protein expression in frozen tissues
In order to take a step further in our study of HO-1 expression in tumors and to compare HO-1 mRNA levels in tumors and non-malignant lung tissues, we isolated RNA from 18 frozen tumor tissues and their adjacent non-malignant tissues and performed real time quantitative PCR for detection of HO-1 mRNA. Fig. 4B and C shows that there is a great variation in HO-1 mRNA levels among different patients. Mean value for HO-1 mRNA in tumors was lower than the mean value for HO-1 mRNA in non-malignant adjacent tissues (p = 0.029, Fig. 4C). We also prepared protein lysates from 7 frozen representative samples of tumor tissues and their adjacent non-malignant tissues and analyzed HO-1 expression by western-blot, obtaining similar results to those obtained for mRNA levels (Fig. 4D). The lower panel in Fig. 4D shows the ratio (normal to malignant tissue) for values obtained in protein and mRNA analyses.
Fig. 4.
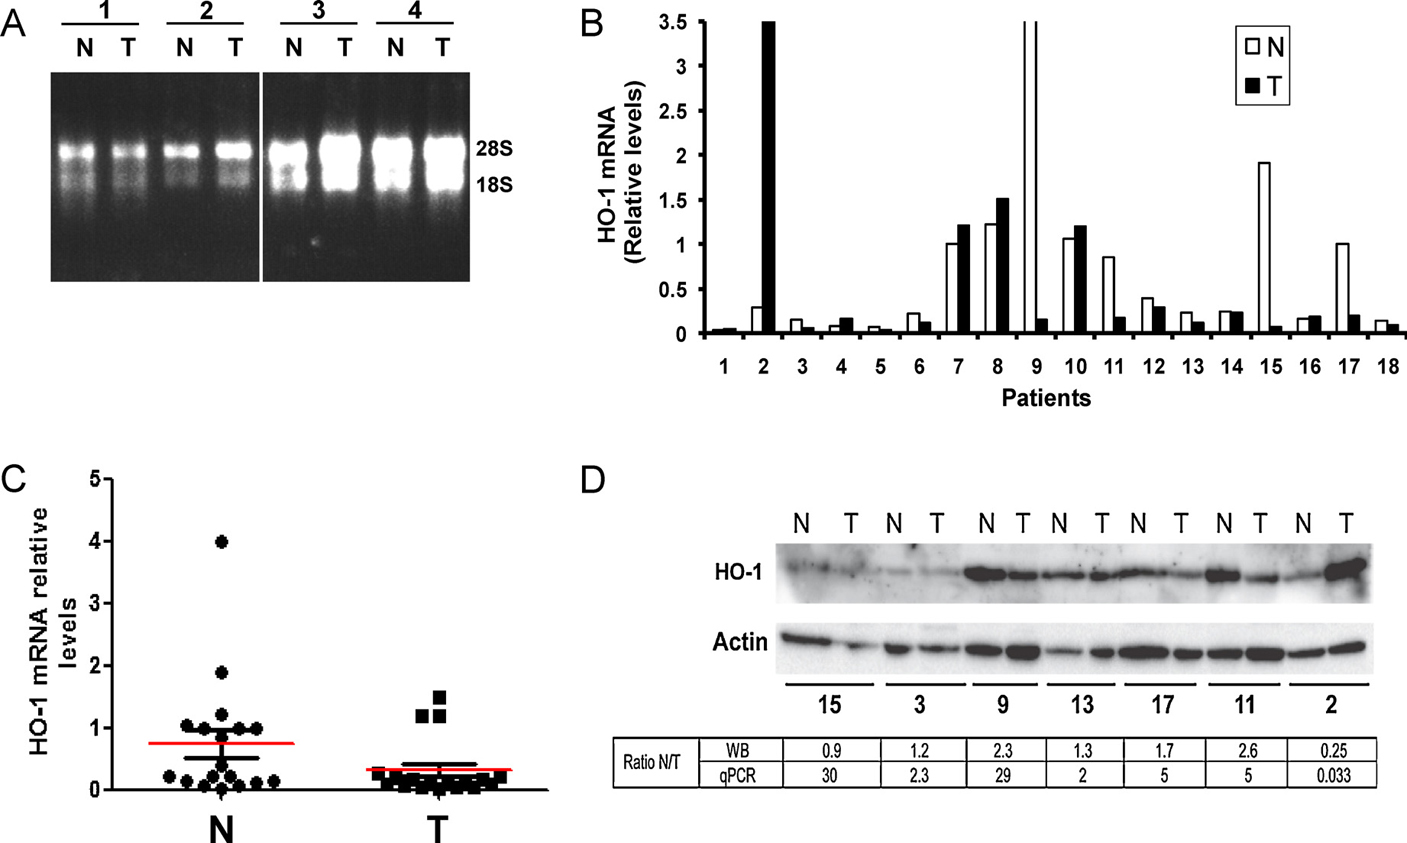
Detection of HO-1 mRNA and protein extracted from 18 tumors (T) and their adjacent non-malignant tissue (N). (A) Shown is the RNA extracted from 8 representative samples. Numbers correspond to different patients. (B) Plot showing the mRNA levels of the tumors and their paired non-malignant tissues in all samples analyzed. (C) Dot plot showing HO-1 mRNA levels in tumors and their adjacent non-malignant tissues. Red lines show mean values for each group. (p = 0.029; Mann–Whitney). (D) Representative western-blot showing HO-1 protein levels in total lysates prepared from the tumors and their paired non-malignant tissues of the patients analyzed. The ratio of HO-1 expression between normal and tumor tissues (N/T) as detected by qPCR and WB is shown.
4. Discussion
In this report we describe HO-1 expression and localization in human lung cancer by means of immunohistochemical staining and by RT-qPCR of lung tissues. To our knowledge this is the first report of HO-1 expression in a wide panel of lung cancer specimens (278). There is a study performed in 53 samples of NSCLC patients showing that HO-1 decreases in the macrophages of tumor tissue compared to the macrophages of adjacent tissues [14]. Another study performed with 30 samples showed upregulation of HO-1 in tumor epithelial cells when compared with their normal tissues [15]. However, a recent report analyzing HO-1 mRNA expression in 28 NSCLC specimens detected lower levels of HO-1 in tumors [20]. Due to these discrepancies it was necessary to study HO-1 expression in a higher number of samples and therefore we analyzed protein expression in 278 NSCLC samples in a TMA. Our study shows there is a great variation in the expression levels of HO-1 among the different tumor samples and demonstrates there are significant differences in HO-1 protein expression between tumor and non-malignant samples. These results are in accordance with those obtained for other tissues, in which upregulation of HO-1 in tumors was observed when compared with normal tissues [9,21]. For example, in prostate cancer [22,23], brain tumors [24], chronic myeloid leukemia [25], melanoma [26], pancreatic cancer [27], renal carcinoma [28] and head and neck squamous cell carcinoma [29,30] HO-1 has been shown to be overexpressed. Our results do support those of De Palma et al. [20] showing down regulation of HO-1 in NSCLC tumors at the mRNA level. However, it is possible that HO-1 mRNA detected by qPCR and HO-1 protein detected by WB in non-malignant adjacent tissues is in part provided by inflammatory cells, since almost all non-malignant adjacent tissues evidenced strong presence of inflammatory HO-1-expressing cells in the alveoli, as observed by microscopic evaluation of stained slides (Fig. 2B). On the other hand, when tumor tissues are analyzed, few HO-1-expressing inflammatory cells are observed. This is in accordance with Boschetto et al. [14] where they found high levels of HO-1-expressing macrophages in the non-malignant margins and low levels in tumor tissues. The authors also described that the main HO-1-expressing cell in the alveoli were macrophages. Therefore, we show that tumor epithelial cells express HO-1 at higher levels than non-malignant lung epithelial cells, as observed by microscopic analysis of HO-1 immunostaining in lung tumors and their adjacent non-malignant tissues, and suggest that care has to be taken when interpreting the results when analyzing mRNA or proteins extracted from tissue homogenates, especially molecules that are expressed by various cell types within a tissue. This might explain the discrepancies found in the literature regarding differences in HO-1 expression between tumor and adjacent non-malignant tissues.
Interestingly, the frequently observed gradient of HO-1 expression increasing at the invasion front of the tumor clusters could indicate a role of this protein in tumor invasion. Also important could be the finding of differential HO-1 sub-cellular localization between tumor and non-malignant tissues, since non-malignant adjacent tissues presented nuclear localization of HO-1 whereas tumor tissues presented mostly cytoplasmic staining. This unusual nuclear localization of HO-1 was first observed in murine fibroblast where HO-1 translocated to the nucleus leading to activation of oxidant-responsive transcription factors [31]. The authors postulated that the nuclear form of HO-1 may upregulate genes that promote cytoprotection against oxidative stress. Additionally, the nuclear localization of HO-1 was demonstrated in prostate cancer where it was associated to tumor progression [32]. As opposed to our results, they observed a higher degree of nuclear HO-1 in the tumor epithelia than in the non-malignant adjacent areas. On the other hand, Li et al. [15] observed nuclear HO-1 localization in both lung tumor epithelia and non-malignant tissues. This subcellular localization was also described in rat fetal lung cells exposed to hyperoxia [33] and in a rat hepatoma cell line [31]. It is known that lung tissues are exposed to oxidant stress and therefore they need good ROS scavenging systems, including HO-1. However, HO-1 also plays a role as a tumor-promoter molecule [21] and thus it may have both pro and antagonistic effects on lung tumor progression. Indeed, the role of HO-1 in carcinogenesis has not yet been well elucidated [9,21] and there are conflictive reports regarding HO-1 role in tumor progression. In this sense, the study of HO-1 prognostic significance in human tumors is relevant, and again, the reports show contradictory results. For example, in bladder cancer, HO-1 was significantly associated to recurrence and progression [34] whereas in tongue squamous cell carcinoma low expression correlated with lymph node metastasis [35], and in colorectal cancer expression of HO-1 was associated with a longer survival time [36]. In this regard, we found that HO-1 was positively correlated with tumor stage and lymph node metastasis, showing that it is associated with the progression of NSCLC.
A decrease in antioxidant systems, particularly the heme oxygenase-1 has been described in macrophages in severe COPD [37] which is often present in lung cancer patients. It would be interesting to know if the presence of COPD influences the HO-1 levels in non-malignant areas adjacent to the tumors. Additionally, we observed that preneoplastic tissues showed similar levels of HO-1 than tumor epithelia, supporting the results obtained in oral epithelial dysplasias [38].
In conclusion, we provide evidence that HO-1 is upregulated during lung carcinogenesis and that it is mostly localized in cytoplasm in tumor cells whereas in adjacent non-cancerous tissue it is mainly localized in the nucleus. Importantly, we demonstrate that HO-1 expression correlates with higher stages of the disease and with lymph node metastasis in NSCLC.
Acknowledgments
This work was supported by grants and fellowships awarded by CONICET and ANPCyT, Argentina.
Footnotes
Conflict of interest statement
None declared.
References
- [1].Tenhunen R, Marver HS, Schmid R. The enzymatic conversion of heme to bilirubin by microsomal heme oxygenase. Proc Natl Acad Sci USA 1968;61:748–55. [DOI] [PMC free article] [PubMed] [Google Scholar]
- [2].Applegate LA, Luscher P, Tyrrell RM. Induction of heme oxygenase: a general response to oxidant stress in cultured mammalian cells. Cancer Res 1991;51:974–8. [PubMed] [Google Scholar]
- [3].Slebos DJ, Ryter SW, Choi AM. Heme oxygenase-1 and carbon monoxide in pulmonary medicine. Respir Res 2003;4:7–10. [DOI] [PMC free article] [PubMed] [Google Scholar]
- [4].Fredenburgh LE, Perrella MA, Mitsialis A. The role of heme-oxygenase-1 in pulmonary disease. Am J Respir Cell Mol Biol 2007;36:158–65. [DOI] [PMC free article] [PubMed] [Google Scholar]
- [5].Zhou H, Lu F, Latham C, Zander DS, Visner GA. Heme oxygenase-1 expression in human lungs with cystic fibrosis and cytoprotective effects against Pseudomonas aeruginosa in vitro. Am J Respir Crit Care Med 2004;170(6):633–40. [DOI] [PubMed] [Google Scholar]
- [6].Mumby S, Upton RL, Chen Y, Stanford SJ, Quinlan GJ, Nicholson AG, et al. Lung heme oxygenase-1 is elevated in acute respiratory distress syndrome. Crit Care Med 2004;32(5):1130–5. [DOI] [PubMed] [Google Scholar]
- [7].Siner JM, Jiang G, Cohen ZI, Shan P, Zhang X, Lee CG, et al. VEGF-induced heme oxygenase-1 confers cytoprotection from lethal hyperoxia in vivo. FASEB J 2007;21:1422–32. [DOI] [PubMed] [Google Scholar]
- [8].Repine JE, Bast A, Lankhorst I. Oxidative stress in chronic obstructive pulmonary disease. Oxidative stress study group. Am J Respir Crit Care Med 1997;156(2 Pt 1):341–57. [DOI] [PubMed] [Google Scholar]
- [9].Jozkowicz A, Was H, Dulak J. Heme oxygenase-1 in tumors: is it a false friend? Antioxid Redox Signal 2007;9:2099–115. [DOI] [PMC free article] [PubMed] [Google Scholar]
- [10].Hirai K, Sasahira T, Ohmori H, Fujii K, Kuniyasu H. Inhibition of heme oxygenase-1 by zinc protoporphyrin IX reduces tumor growth of LL/2 lung cancer in C57BL mice. Int J Cancer 2007;120(3):500–5. [DOI] [PubMed] [Google Scholar]
- [11].Kuroda H, Takeno M, Murakami S, Miyazawa N, Kaneko T, Ishigatsubo Y. Inhibition of heme oxygenase-1 with an epidermal growth factor receptor inhibitor and cisplatin decreases proliferation of lung cancer A549 cells. Lung Cancer 2010;67(1):31–6. [DOI] [PubMed] [Google Scholar]
- [12].Kim HR, Kim S, Kim EJ, Park JH, Yang SH, Jeong ET, et al. Suppression of Nrf2-driven heme oxygenase-1 enhances the chemosensitivity of lung cancer A549 cells toward cisplatin. Lung Cancer 2008;60(1):47–56. [DOI] [PubMed] [Google Scholar]
- [13].Kikuchi A, Yamaya M, Suzuki S, Yasuda H, Kubo H, Nakayama K, et al. Association of susceptibility to the development of lung adenocarcinoma with the heme oxygenase-1 gene promoter polymorphism. Hum Genet 2005;116(5): 354–60. [DOI] [PubMed] [Google Scholar]
- [14].Boschetto P, Zeni E, Mazzetti L, Miotto D, Lo Cascio N, Maestrelli P, et al. Decreased heme-oxygenase (HO)-1 in the macrophages of non-small cell lung cancer. Lung Cancer 2008;59(2):192–7. [DOI] [PubMed] [Google Scholar]
- [15].Li MY, Yip J, Hsin MK, Mok TS, Wu Y, Underwood MJ, et al. Haem oxygenase-1 plays a central role in NNK-mediated lung carcinogenesis. Eur Respir J 2008;32(4):911–23. [DOI] [PubMed] [Google Scholar]
- [16].Hewitt SM. Design, construction, and use of tissue microarrays. Methods Mol Biol 2004;264:61–72. [DOI] [PubMed] [Google Scholar]
- [17].Kononen J, Bubendorf L, Kallioniemi A, Bärlund M, Schraml P, Leighton S, et al. Tissue microarrays for high-throughput molecular profiling of tumor specimens. Nat Med 1998;4(7):844–7. [DOI] [PubMed] [Google Scholar]
- [18].Facchinetti MM, Gandini NA, Fermento ME, Sterin-Speziale NB, Ji Y, Patel V, et al. The expression of sphingosine kinase-1 in head and neck carcinoma. Cells Tissues Organs 2010;192(5):314–24. [DOI] [PMC free article] [PubMed] [Google Scholar]
- [19].Marinissen MJ, Tanos T, Bolós M, de Sagarra MR, Coso OA, Cuadrado A. Inhibition of heme oxygenase-1 interferes with the transforming activity of the Kaposi sarcoma herpesvirus-encoded G protein-coupled receptor. J Biol Chem 2006;281(16):11332–46. [DOI] [PubMed] [Google Scholar]
- [20].De Palma G, Mozzoni P, Acampa O, Internullo E, Carbognani P, Rusca M, et al. Expression levels of some antioxidant and epidermal growth factor receptor genes in patients with early-stage non-small cell lung cancer. J Nucleic Acids 2010;2010:1–6 [pii 147528]. [DOI] [PMC free article] [PubMed] [Google Scholar]
- [21].Was H, Dulak J, Jozkowicz A. Heme oxygenase-1 in tumor biology and therapy. Curr Drug Targets 2010;11(12):1551–70. [DOI] [PubMed] [Google Scholar]
- [22].Maines MD, Abrahamsson PA. Expression of heme oxygenase-1 (HSP32) in human prostate: normal, hyperplastic, and tumor tissue distribution. Urology 1996;47:727–33. [DOI] [PubMed] [Google Scholar]
- [23].Alaoui-Jamali MA, Bismar TA, Gupta A, Szarek WA, Su J, Song W, et al. A novel experimental heme oxygenase-1-targeted therapy for hormone refractory prostate cancer. Cancer Res 2009;69:8017–24. [DOI] [PubMed] [Google Scholar]
- [24].Hara E, Takahashi K, Tominaga T. Expression of heme oxygenase and inducible nitric oxide synthase mRNA in human brain tumors. Biochem Biophys Res Commun 1996;224:153–8. [DOI] [PubMed] [Google Scholar]
- [25].Mayerhofer M, Florian S, Krauth MT, Aichberger KJ, Bilban M, Marculescu R, et al. Identification of heme oxygenase-1 as a novel BCR/ABL-dependent survival factor in chronic myeloid leukemia. Cancer Res 2004;64: 3148–54. [DOI] [PubMed] [Google Scholar]
- [26].Torisu-Itakura H, Furue M, Kuwano M, Ono M. Co-expression of thymidine phosphorylase and heme oxygenase-1 in macrophages in human malignant vertical growth melanomas. Jpn J Cancer Res 2000;91:906–10. [DOI] [PMC free article] [PubMed] [Google Scholar]
- [27].Berberat PO, Dambrauskas Z, Gulbinas A, Giese T, Giese N, Künzli B, et al. Inhibition of heme oxygenase-1 increases responsiveness of pancreatic cancer cells to anticancer treatment. Clin Cancer Res 2005;11(10):3790–8. [DOI] [PubMed] [Google Scholar]
- [28].Goodman AI, Choudhury M, da Silva JL, Schwartzman ML, Abraham NG. Over-expression of the heme oxygenase gene in renal cell carcinoma. Proc Soc Exp Biol Med 1997;214:54–61. [DOI] [PubMed] [Google Scholar]
- [29].Tsuji MH, Yanagawa T, Iwasa S, Tabuchi K, Onizawa K, Bannai S, et al. Heme oxygenase-1 expression in oral squamous cell carcinoma as involved in lymph node metastasis. Cancer Lett 1999;138:53–9. [DOI] [PubMed] [Google Scholar]
- [30].Lee J, Lee SK, Lee BU, Lee HJ, Cho NP, Yoon JH, et al. Upregulation of heme oxygenase-1 in oral epithelial dysplasias. Int J Oral Maxillofac Surg 2008;37:287–92. [DOI] [PubMed] [Google Scholar]
- [31].Lin Q, Weis S, Yang G, Weng YH, Helston R, Rish K, et al. Heme oxygenase-1 protein localizes to the nucleus and activates transcription factors important in oxidative stress. J Biol Chem 2007;282:20621–33. [DOI] [PubMed] [Google Scholar]
- [32].Sacca P, Meiss R, Casas G, Mazza O, Calvo JC, Navone N, et al. Nuclear translocation of haeme oxygenase-1 is associated to prostate cancer. Br J Cancer 2007;97(12):1683–9. [DOI] [PMC free article] [PubMed] [Google Scholar]
- [33].Suttner DM, Sridhar K, Lee CS, Tomura T, Hansen TN, Dennery PA. Protective effects of transient HO-1 overexpression on susceptibility to oxygen toxicity in lung cells. Am J Physiol 1999;276:L443–51. [DOI] [PubMed] [Google Scholar]
- [34].Yim MS, Ha YS, Kim IY, Yun SJ, Choi YH, Kim WJ. HMOX1 is an important prognostic indicator of non-muscle invasive bladder cancer recurrence and progression. J Urol 2011;185(2):701–5. [DOI] [PubMed] [Google Scholar]
- [35].Yanagawa T, Omura K, Harada H, Nakaso K, Iwasa S, Koyama Y, et al. Heme oxygenase-1 expression predicts cervical lymph node metastasis of tongue squamous cell carcinomas. Oral Oncol 2004;40(1):21–7. [DOI] [PubMed] [Google Scholar]
- [36].Becker JC, Fukui H, Imai Y, Sekikawa A, Kimura T, Yamagishi H, et al. Colonic expression of heme oxygenase-1 is associated with a better long-term survival in patients with colorectal cancer. Scand J Gastroenterol 2007;42(7): 852–8. [DOI] [PubMed] [Google Scholar]
- [37].Maestrelli P, Páska C, Saetta M, Turato G, Nowicki Y, Monti S, et al. Decreased haem oxygenase-1 and increased inducible nitric oxide synthase in the lung of severe COPD patients. Eur Respir J 2003;21(6):971–6. [DOI] [PubMed] [Google Scholar]
- [38].Lee J, Lee SK, Lee BU, Lee HJ, Cho NP, Yoon JH, et al. Upregulation of heme oxygenase-1 in oral epithelial dysplasias. Int J Oral Maxillofac Surg 2008;37(3):287–92. [DOI] [PubMed] [Google Scholar]