Abstract
Background:
Guidelines now endorse active surveillance for low risk PTC, but this approach is not commonly utilized. Those with limited life expectancy due to age and comorbidity may be best suited for active surveillance given their higher likelihood of other-cause mortality compared to disease-specific mortality.
Methods:
SEER-Medicare was queried for patients >65 years with T1, N0, M0 PTC who received surgery. We evaluated OS and DSS, and survival based on tumor size and extent of surgery (hemi- vs total-thyroidectomy). We performed a matched pair analysis comparing OS between the cancer cohort and patients matched for age, sex, and race. We created a competing risk model to identify the cumulative incidence of other-cause mortality to define groups of patients with life expectancy less than 10 and 15 years.
Results:
A total of 3,280 patients were included in the analysis. The 20-year OS and DSS were 38.2% and 98.5% respectively. DSS was comparable between patients based on tumor size and treatment extent, and survival was better in the cancer cohort compared to matched controls (p<0.001). Life expectancy was less than 15 years for any patient age >80 regardless of Charlson Comorbidity Score (CCS ≥0), and any patient age >70 with CCS ≥1. Life expectancy was less than 10 years for any patient age >80 with CCS ≥1, and any patient age >70 with CCS ≥3.
Conclusion:
Older patients with comorbidities have limited life expectancies but excellent DSS from low risk PTC. Incorporating life expectancy into management decisions and guidelines, as in other cancer types, would likely promote the selection of less aggressive management for populations that are most suited for this approach.
Keywords: papillary thyroid cancer, active surveillance, life expectancy, guidelines, surgery
Introduction
Surgery has long been the mainstay of treatment for all thyroid cancers including low risk papillary thyroid carcinoma, including in patients >65 years old. However, epidemiological data describing the increasing diagnosis of incidental and low risk PTC and associated low overall mortality raised the possibility that active surveillance might be a reasonable management strategy for some patients.1-4 Based on outcomes data from prospective patient series with long term follow up from Japan5-7, active surveillance (AS) was adopted in 2015 American Thyroid Association (ATA) guidelines as a management option for select patients with low risk papillary thyroid carcinoma (PTC).8
Older patients are known to be better candidates for thyroid cancer active surveillance because of lower rates of disease progression, lack of survival benefit associated with surgical resection, and higher risk of surgical and treatment related complications.6,9,10 It follows that the most ideal candidates for active surveillance are those older patients with limited life expectancy, who are more likely to suffer other-cause mortality rather than thyroid cancer related death. However, whereas guidelines for other disease types, most notably prostate cancer, account for age, comorbidity, and life expectancy, 11-13 so far thyroid cancer guidelines have not done the same. Population level analyses of life expectancy and comorbidity are first necessary to understand the comparative risk of other-cause mortality in subgroups of older patients.
We sought to determine the degree to which, and timing of when patients in older age brackets with comorbidities suffer other-cause mortality rather than thyroid cancer related death. We used the SEER-Medicare database to identify patients older than 65 with low risk PTC from 1992 to 2013. Our first aim was to examine overall and thyroid cancer-specific mortality, including using matched pair analysis of patients with no cancer history. Our second aim was to examine the cumulative incidence of other-cause mortality stratified by age and comorbidity status. We hypothesized that certain groups of patients could be identified based on age and comorbidity who had a life expectancy <10 or <15 years (defined as 50% of the cohort with other-cause mortality by that time) who might be ideal candidates for active surveillance.
Methods
Data Source
We analyzed the Surveillance, Epidemiology, and End Results (SEER)-Medicare database, which provides information about Medicare beneficiaries with cancer. The SEER component is currently comprised of data from 20 geographical regions covering approximately 28% of the US population. The linked Medicare claims identify the health care utilization for each registered patient until the end of 2014 or death. This linkage has been a collaborative effort of the National Cancer Institute (NCI), the SEER registries, and the Centers for Medicare and Medicaid Services and has claims data on 93% of patients from the SEER registry.14 This study was considered exempt from the Institutional Review Board as the data obtained from the SEER-Medicare database was used in accordance with the Data Use Agreement from the NCI.
Cohort Selection
We identified patients aged 66-years and older with low risk PTC, defined as T1 tumor without known regional or distant spread. We identified patients with a diagnosis of thyroid cancer (ICD-0-3 site – C739, Site Recode – 32010) with histological confirmation of PTC and its variants (ICD-0-3 Histology Code - 8050, 8052, 8053, 8260, 8261, 8262, 8263, 8340, 8341, 8342, 8343, 8344, 8350, 8450, 8452, 8460) from diagnosis years 1992-2013. Patients with the following were excluded from the study analysis: greater than stage T1 at presentation, regional or distant metastatic disease at diagnosis, tumor spread (i.e. extra-thyroidal extension), missing diagnosis date, non-surgical management, death prior or equal to the diagnosis date, prior cancer diagnosis, missing reporting source or autopsy only/death certificate only reporting source, and no enrollment in Parts A and B of Medicare (12 months prior to diagnosis and 12 months post diagnosis, or death whichever was earlier) or enrollment in HMO (12 months prior to diagnosis and 12 months post diagnosis, or death whichever was earlier).
Measures
The sociodemographic profiles of patients were identified from the Patient Entitlement and Diagnosis Summary (PEDSF) file of the SEER-Medicare Dataset. The Charlson Comorbidity Score (CCS) was identified using claims data from 12 months prior to the diagnosis of the index cancer until the month of actual diagnosis and derived using the Deyo-Klabunde modification of Charlson Comorbidity Index.15 The scores were grouped as 0, 1, 2 and 3+ (for CCS 3 and above).
For treatment, index surgery was defined as surgery performed within one-year of diagnosis and confirmed with claims data. CPT codes 60200, 60210, 60212, 60220, 60225, 60240, 60245, 60246, 60252, 60254, 60260, 60270, 60271 were considered as primary surgical intervention. Patients without these surgical codes were classified as receiving non-surgical management. Vital Status at the last follow up and Cause of Death Information were used to analyze the outcomes of interest including overall survival, other cause mortality, and cancer specific mortality.
Statistical Analysis
Mean and median values were calculated for descriptive data. Frequency tables were created for all tumor categories, identifying the demographic and the clinico-pathological data. Overall survival (OS) and disease specific survival (DSS) were calculated using Kaplan Meier curves; the curves were stratified on both age and the Modified Charlson Comorbidity Score. For the matched pair analysis, in order to examine any differences in overall survival, we used the provided non-cancer sample of patients from the SEER-Medicare files to find patients matched with the low risk PTC cohort based on age, race, and sex.
Life Expectancy
A competing risk model was created to identify the cumulative incidence of other cause mortality. The event was defined as Cause of Death due to other cause mortality (non-cancer related death) with death from thyroid cancer as the competing risk. Results were stratified by Charlson Comorbidity Score and age group. The cumulative incidence of other cause mortality >50% was used to identify the life expectancy of the subgroups, as predicted by the median survival. The statistical analysis was performed using the SAS v.9.4 software and p value <0.05 was considered significant.
Results
A total of 22,526 patients aged 66 years or older with a primary, histologically confirmed T1 thyroid cancer between the years 1992 and 2013 were identified in the SEER registry. Based on our selection criteria 3,280 patients with T1 PTC without extrathyroidal extension, or regional or distant disease were eligible for inclusion in the final analysis (Figure 1).
Figure 1.
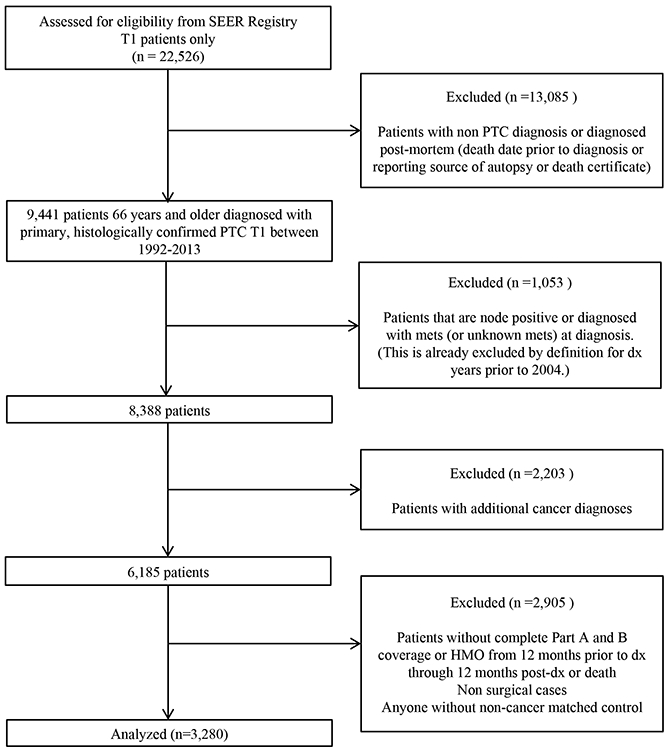
CONSORT Diagram
Patient demographics
Population characteristics by Charlson score are presented in Table 1. Of the study cohort, 70% patients were between the ages 66-74 years, 80% were females, 85% were Caucasian, and 85% were from metropolitan areas. Patients with T1a tumors (<1cm) comprised 71% of the cohort. All patients were treated surgically, and total thyroidectomy was performed in 58% of the cohort. The median follow up was 5.4 years for the entire cohort, and only 13.3% of all patients had follow up less than 2 years. At the last follow-up, 2866 (88.0%) patients were alive, and 389 (11.9%) patients died of other causes.
Table 1.
Patient Characteristics According to Charlson Comorbidity Index Score
| Total N=3280 | CCS 0 N=1910 (58%) |
CCS 1 N=829 (25%) |
CCS 2 N=312 (9%) |
CCS 3 N=229 (7%) |
|---|---|---|---|---|
| Age At Diagnosis | ||||
| 66-69 | 768 (40%) | 272 (33%) | 101 (32%) | 72 (31%) |
| 70-74 | 600 (31%) | 279 (34%) | 114 (37%) | 71 (31%) |
| 76-80 | 352 (18%) | 170 (21%) | 60 (19%) | 48 (21%) |
| 80+ | 190 (9.9%) | 108 (13%) | 37 (12%) | 38 (17%) |
| Sex | ||||
| Female | 1556 (81%) | 649 (78%) | 237 (76%) | 166 (72%) |
| Male | 354 (19%) | 180 (22%) | 75 (24%) | 63 (28%) |
| Ethnicity | ||||
| Caucasian | 1682 (88%) | 704 (85%) | 254 (81%) | 158 (69%) |
| Other | 158 (8.3%) | 75 (9.0%) | 31 (9.9%) | 36 (16%) |
| African American | 70 (3.7%) | 50 (6.0%) | 27 (8.7%) | 35 (15%) |
| Marital Status | ||||
| Married | 1137 (60%) | 487 (59%) | 161 (52%) | 116 (51%) |
| Unmarried | 773 (40%) | 342 (41%) | 151 (48%) | 113 (49%) |
| Urban-rural Residence | ||||
| Metropolitan | 1626 (85%) | 691 (83%) | 270 (87%) | 193 (84%) |
| Non-metropolitan | 284 (15%) | 138 (17%) | 42 (13%) | 36 (16%) |
| Geographic Region | ||||
| Midwest | 216 (11%) | 101 (12%) | 30 (9.6%) | 29 (13%) |
| Northeast | 425 (22%) | 196 (24%) | 71 (23%) | 53 (23%) |
| South | 457 (24%) | 217 (26%) | 96 (31%) | 63 (28%) |
| West | 812 (43%) | 315 (38%) | 115 (37%) | 84 (37%) |
| Census Tract Median Income | ||||
| 4th Quartile | 538 (28%) | 195 (24%) | 62 (20%) | 46 (20%) |
| 3rd Quartile | 487 (25%) | 215 (26%) | 78 (25%) | 56 (24%) |
| 2nd Quartile | 463 (24%) | 209 (25%) | 82 (26%) | 57 (25%) |
| 1st Quartile/Unknown | 422 (22%) | 210 (25%) | 90 (29%) | 70 (31%) |
| Diagnosis Year | ||||
| 1992-2003 | 358 (19%) | 126 (15%) | 49 (16%) | 31 (14%) |
| 2004-2013 | 1552 (81%) | 703 (85%) | 263 (84%) | 198 (86%) |
| Surgery | ||||
| Total/Subtotal | 1116 (58%) | 464 (56%) | 190 (61%) | 135 (59%) |
| Hemi | 794 (42%) | 365 (44%) | 122 (39%) | 94 (41%) |
| Tumor Size | ||||
| T1a | 1362 (71%) | 586 (71%) | 226 (72%) | 167 (73%) |
| T1b | 548 (29%) | 243 (29%) | 86 (28%) | 62 (27%) |
| Status as Last Follow Up | ||||
| Alive | 1740 (91%) | 706 (85%) | 257 (82%) | 167 (73%) |
| Died | 170 (8.9%) | 123 (15%) | 55 (18%) | 62 (27%) |
Survival outcomes
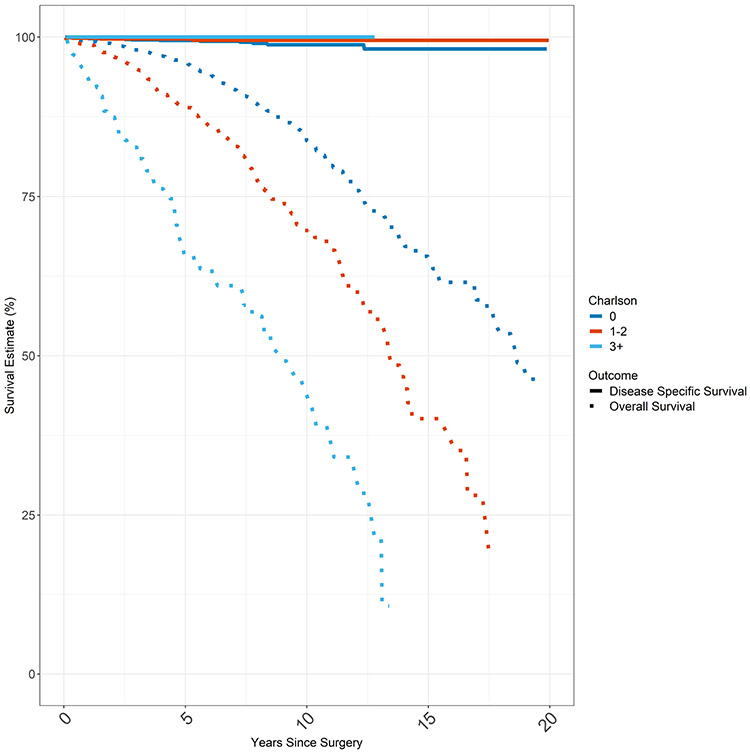
Kaplan Meier Survival Estimates were plotted for overall survival (OS) and disease specific survival (DSS) based on Charlson comorbidity score (Figure 2). Median overall survival was 17 years for the entire cohort. While overall survival was dependent on comorbidity, mortality from thyroid cancer is so low that disease specific survival was not impacted by comorbidity. For example in analyzing 10 year survival, the OS for Charlson comorbidity score 0, CCS1, CCS2, and CCS3 groups were 83.7%, 70.6%, 67.0%, and 46.5% respectively (p < 0.001). However, the 10yr DSS for Charlson comorbidity score 0, CCS1, CCS2, and CCS3 groups were 98.8%, 99.5%, 99.3%, and 100% respectively (p = 0.5).
Figure 2.
Overall Survival & Disease Specific Survival
Total cancer cohort consisting of first and only cancer (T1, N0, M0 PTC; n = 3280). Overall survival and disease specific survival of total cohort by Charlson Comorbidity Score. Disease specific survival approximates 100% whereas overall survival worsens with increasing Charlson Comorbidity Index Score. DSS is represented by the solid lines and OS is represented by the dashed lines. Each CCS category (0, 1-2, 3+) is represented by a different color.
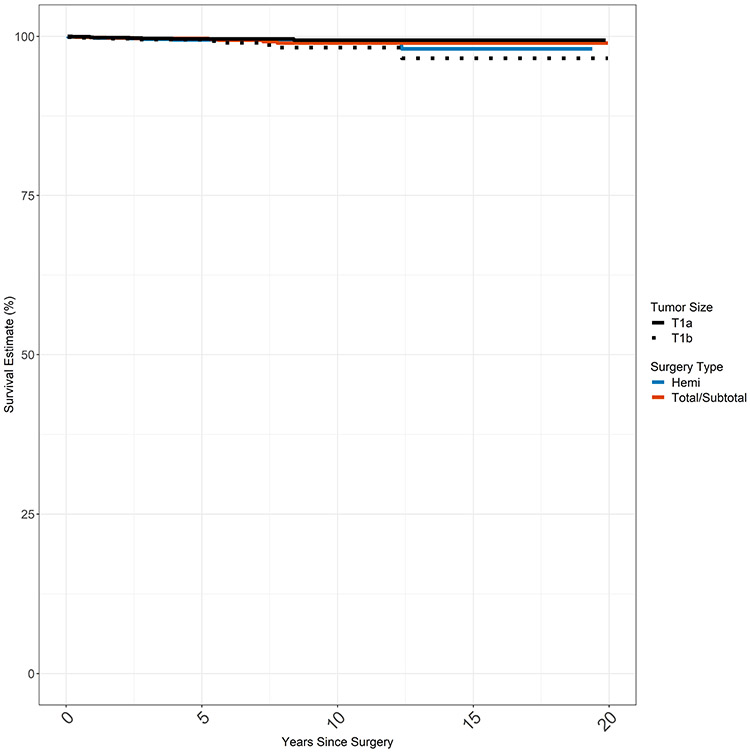
Kaplan Meier estimates were also created for DSS based on surgery type (hemithyroidectomy vs total thyroidectomy) and stage of disease (stage T1a vs stage T1b) at presentation (Figure 3). Median survival was not reached for any of the groups. Disease specific survival at 20 years was >97% in all four groups without significant differences in survival between surgery type (p=0.9). There was a statistically significant difference in survival by T stage (T1a vs T1b, p=0.03) with few overall events in either group (17 total deaths in T1a and T1b combined).
Figure 3.
Disease Specific Survival by Stage and Surgery Extent
None of the groups reached median survival; DDS was >97% at 20 years for all 4 groups.
Matched Pair Analysis
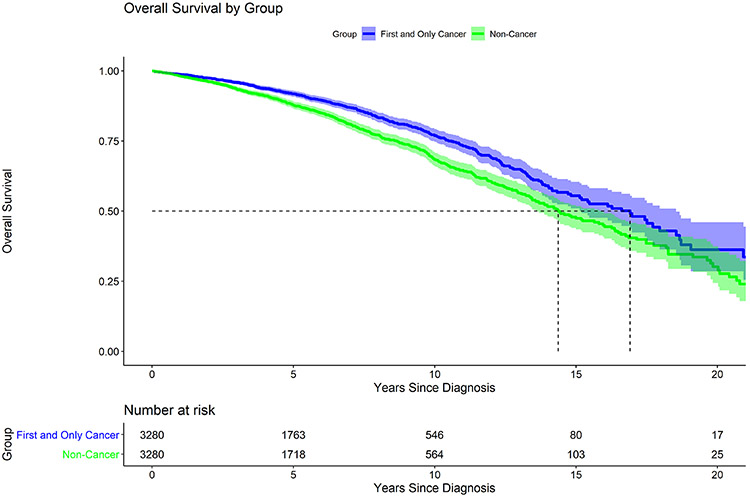
As an additional exploratory analysis to determine the impact of thyroid cancer on overall survival, Kaplan Meier estimates were plotted for the matched pair analysis. The median overall survival for the cancer group (T1, N0 PTC, first and only cancer) was higher at 16.9 years than the median overall survival for the non-cancer group (no cancer diagnosis of any kind) at 14.4 years (p<0.001) (Figure 4). Characteristics of the cancer cohort and matched controls are presented in Appendix Table 1.
Figure 4.
Matched Pair Analysis
All cancer patients as described in Figure 1 (n = 3280) matched with cases without any cancer diagnoses (n= 3280). Median survival for the cancer cohort and matched case controls was 16.9 years and 14.4 years respectively (p <0.001). Pairs matched on age, gender, and race.
Life expectancy
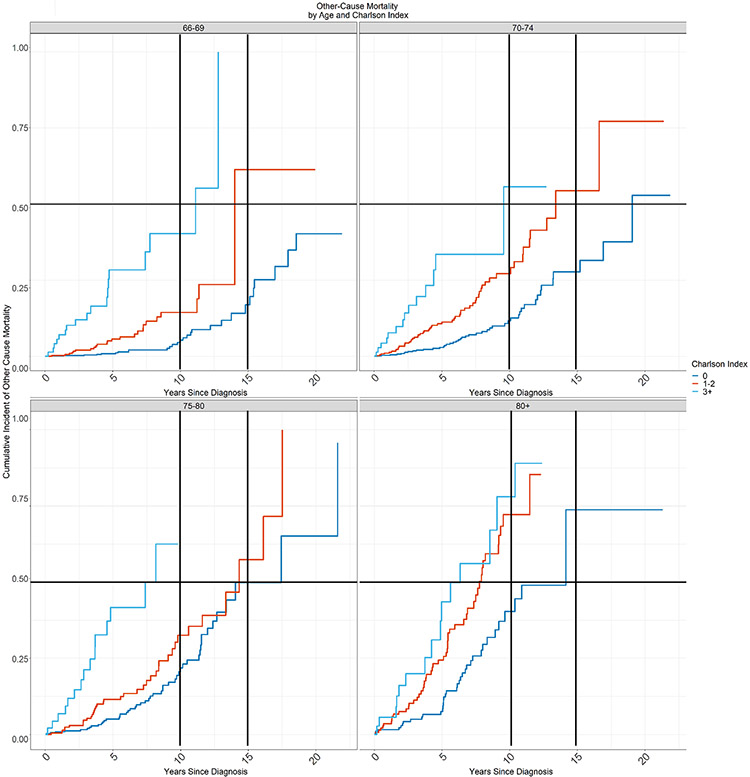
The multivariate competing-risk model demonstrated differences in the cumulative incidence of other-cause mortality by Charlson Comorbidity Score index in the different age groups (Figure 5). From this data we identified groups of patients according to age and comorbidity with life expectancy less than 15 years and less than 10 years due to other cause mortality. In Table 2, the shaded areas correspond to these groups. Life expectancy was less than 15 years for any patient over age 80 regardless of Charlson Comorbidity Score (CCS ≥0), as well as any patient over age 70 with CCS ≥1. Life expectancy was less than 10 years for any patient over age 80 with CCS ≥1, as well as any patient over age 70 with CCS ≥3.
Figure 5.
Cumulative Incidence of Other Cause Mortality
The cumulative incidence of other-cause mortality by Charlson Comorbidity Index score for patients aged (a) 66-69 years, (b) 70-74 years, (c) 75-79 years, and (d) ≥80 years at 10 years and 15 years.
Table 2.
Life Expectancy Based on Age and Comorbidity Status
| Life Expectancy Based on Cumulative Incidence of Other Cause Mortality | ||||
|---|---|---|---|---|
| Age 66-69 | Age 70-74 | Age 75-80 | Age 80+ | |
| CCS 0 | > 20 years | 19 years | 17.5 years | 14 years |
| CCS 1-2 | 14 years | 13.5 years | 14.5 years | 7.8 years |
| CCS 3+ | 11 years | 9.5 years | 7.5 years | 6 years |
| Cumulative Incidence of Other-Cause Mortality at 10 years | ||||
| Age 66-69 | Age 70-74 | Age 75-80 | Age 80+ | |
| CCS 0 | 5% | 12% | 22% | 40% |
| CCS 1-2 | 14% | 27% | 33% | 72% |
| CCS 3+ | 40% | 56% | 100% | 78% |
| Cumulative Incidence of Other-Cause Mortality at 15 years | ||||
| Age 66-69 | Age 70-74 | Age 75-80 | Age 80+ | |
| CCS 0 | 17% | 28% | 49% | 74% |
| CCS 1-2 | 63% | 55% | 58% | 100% |
| CCS 3+ | 100% | 100% | 100% | 100% |
Discussion
The management of low risk PTC is changing, with increasing recognition of patients for whom active surveillance rather than surgery might be a reasonable option. However, the majority of older and sicker patients are still managed with surgery. While older patients are known to have lower rates of tumor progression while on active surveillance, life expectancy is not yet used in thyroid cancer management guidelines regarding active surveillance. Management decisions for low risk thyroid cancer should ideally incorporate both age and comorbidity, which together make up a patient’s life expectancy. Life expectancy has been incorporated into other low risk tumor guidelines including prostate; doing so in thyroid might help to clarify the candidates for whom active surveillance is an obvious choice.
Our analysis provides the first population-level data on life expectancy for patients with low risk PTC based on age and comorbidity, and in so doing, describes groups of patients for which active surveillance should be preferred. Specifically, we identified groups of patients who at the time of thyroid cancer diagnosis had life expectancies of <15 years or <10 years. We found that very few patients in our cohort died of low risk PTC; patients were much more likely to die of other causes. In fact, patients with low risk PTC lived longer than their matched cohorts without cancer suggesting not only that low risk thyroid cancer is not deadly in this group, but that patients seeking medical care for low risk PTC have underlying factors (attentiveness to health and use of the health care system) that have a protective effect. Of note, while there was a statistically significant difference in the DSS between patients with T1a vs T1b disease, this is likely due to chance because of a multiplicity of comparisons, and is not clinically significant due to the overall low rates of mortality in both groups over > than 20 years. Furthermore, there was no difference in thyroid-cancer specific survival based on the extent of surgery.
Literature supporting the idea of differentiated management based on life expectancy in other cancers is abundant. Studies with methodologies similar to the current analysis have been performed for low and intermediate risk prostate cancers and early stage renal cancers.16,17 In turn, the NCCN guidelines for prostate cancer explicitly integrate age, comorbidity status, and life expectancy into the management algorithm of low to moderate risk prostate cancer.11-13
In thyroid, although most patients are still treated with surgery, similar excellent outcomes have been demonstrated by recent series of patients managed with active surveillance with up to 20 years follow up; in fact there have been no thyroid cancer-related deaths among several thousand patients enrolled in active surveillance.6,7,18-20 These same series have also demonstrated low rates of progression while on active surveillance among patients greater than 60 years of age.6,9,19 At the same time, older patients have been found to have a greater risk of complications from thyroidectomy.10,21,22. Finally, older patients have been shown to have high non-thyroid cancer related mortality.23 In regard to cost effectiveness, a study by Lang et al found that for patients with low risk PTC, non-surgical management produced a cost saving in the initial 16 years from the date of diagnosis,24 and remained a cost effective management strategy compared to surgery beyond the 16-year mark, regardless of patient age, complications, or even disease progression.
How might management recommendations and guidelines change based on this analysis? First, we propose that all patients with a relatively shorter life expectancy of less than 10 years (any patient over age 80 with CCS ≥1, as well as any patient over age 70 with CCS ≥3) should be offered active surveillance as the preferred management strategy. Patients with a life expectancy less than 15 years (any patient over age 80 regardless of Charlson Comorbidity Score (CCS ≥0), as well as any patient over age 70 with CCS ≥1) should at least be strongly considered for active surveillance. Second, if surgery is deemed necessary in the appropriately selected patient with limited life expectancy in whom either hemithyroidectomy or total thyroidectomy is acceptable, we propose de-escalation from total thyroidectomy to hemithyroidectomy. In our analysis, survival was nearly identical among patients undergoing hemithyroidectomy compared to those who underwent total thyroidectomy. This is further supported by a large retrospective review of the SEER database performed by Rajjoub et al who found no differences in survival among patients undergoing hemithyroidectomy compared to total thyroidectomy with tumor sizes <2cm.25
Several limitations to our analysis exist. First, there are limitations inherent to the use of large, secondary data sets including possible reporting bias, errors in coding, and errors in sampling. In addition, the mortality estimates based on Charlson comorbidity scores and age may differ from those based on more in-depth chart review. However, studies have shown that chart and claims-based analyses of comorbidities are similar.26 Finally, missing data for tumor grade, family history, and prior history of radiation did not allow us to characterize the tumors in greater detail; these factors could impact on management options. We also did not assess for use of radioactive iodine and could not assess TSH suppression following surgery, both of which may affect disease specific survival and morbidity.
Conclusion
We identified groups of patients based on life expectancy (age and comorbidity), who at the time of papillary thyroid cancer diagnosis were likely to die of other causes within 10 or 15 years. These patients would likely be ideal candidates for active surveillance. At the very least, our findings highlight the need to integrate age, comorbidity, and the risks of harm from surgical management into medical decision making for older patients with low risk papillary thyroid cancer.
Supplementary Material
Acknowledgments
This study was supported in part by the Cancer Center Support Grant P30 CA008748 from the National Institutes of Health/National Cancer Institute.
Abbreviations:
- PTC
papillary thyroid carcinoma
- OS
overall survival
- DSS
disease specific survival
- CCS
Charlson comorbidity score
- AS
active surveillance
- ATA
American thyroid association
- SEER
Surveillance, Epidemiology, and End Results
- NCI
National Cancer Institute
- PEDSF
Patient Entitlement and Diagnosis Summary
- TSH
thyroid stimulating hormone.
Appendix
Appendix Table 1.
Patient Characteristics of Cancer Cohort and Matched Pairs
| Characteristic | Cancer Cohort N = 32801 (100%) |
Non-Cancer Cohort N = 32801 (100%) |
|---|---|---|
| Charlson Comorbidity Score | ||
| 0 | 1910 (58%) | 2854 (87%) |
| 1 | 829 (25%) | 298 (9.1%) |
| 2 | 312 (9.5%) | 79 (2.4%) |
| 3+ | 229 (7.0%) | 49 (1.5%) |
| Sex | ||
| Male | 672 (20%) | 672 (20%) |
| Female | 2608 (80%) | 2608 (80%) |
| Age at Diagnosis | ||
| 71.7 (68.6, 76.1) | 71.7 (68.6, 76.1) | |
| Race | ||
| Caucasian | 2798 (85%) | 2798 (85%) |
| African American | 182 (5.5%) | 182 (5.5%) |
| Other | 300 (9.1%) | 300 (9.1%) |
| Geographic Region | ||
| West | 1326 (40%) | 1129 (34.4%) |
| Northeast | 745 (23%) | 331 (10.1%) |
| Midwest | 376 (11%) | 592 (18%) |
| South | 833 (25%) | 534 (16.3%) |
| Unknown | 0 | 694 (21.2%) |
| Urban-rural Residence | ||
| Non-Urban | 500 (15%) | 527 (19%) |
| Urban | 2780 (85%) | 2289 (81%) |
| Unknown | 0 | 464 |
Statistics presented: n (%); median (IQR)
Footnotes
Publisher's Disclaimer: This is a PDF file of an unedited manuscript that has been accepted for publication. As a service to our customers we are providing this early version of the manuscript. The manuscript will undergo copyediting, typesetting, and review of the resulting proof before it is published in its final form. Please note that during the production process errors may be discovered which could affect the content, and all legal disclaimers that apply to the journal pertain.
The authors report no other financial disclosures.
The authors report no conflicts of interest.
References:
- 1.Davies L, Welch HG. Increasing incidence of thyroid cancer in the United States, 1973-2002. JAMA. 2006;295(18):2164–2167. [DOI] [PubMed] [Google Scholar]
- 2.Morris LG, Tuttle RM, Davies L. Changing Trends in the Incidence of Thyroid Cancer in the United States. JAMA Otolaryngol Head Neck Surg. 2016;142(7):709–711. [DOI] [PMC free article] [PubMed] [Google Scholar]
- 3.Roman BR, Morris LG, Davies L. The thyroid cancer epidemic, 2017 perspective. Curr Opin Endocrinol Diabetes Obes. 2017;24(5):332–336. [DOI] [PMC free article] [PubMed] [Google Scholar]
- 4.Haymart MR, Miller DC, Hawley ST. Active Surveillance for Low-Risk Cancers - A Viable Solution to Overtreatment? N Engl J Med. 2017;377(3):203–206. [DOI] [PMC free article] [PubMed] [Google Scholar]
- 5.Miyauchi A, Ito Y, Oda H. Insights into the Management of Papillary Microcarcinoma of the Thyroid. Thyroid. 2018;28(1):23–31. [DOI] [PMC free article] [PubMed] [Google Scholar]
- 6.Ito Y, Miyauchi A, Kihara M, Higashiyama T, Kobayashi K, Miya A. Patient age is significantly related to the progression of papillary microcarcinoma of the thyroid under observation. Thyroid : official journal of the American Thyroid Association. 2014;24(1):27–34. [DOI] [PMC free article] [PubMed] [Google Scholar]
- 7.Sugitani I, Toda K, Yamada K, Yamamoto N, Ikenaga M, Fujimoto Y. Three distinctly different kinds of papillary thyroid microcarcinoma should be recognized: our treatment strategies and outcomes. World J Surg. 2010;34(6):1222–1231. [DOI] [PubMed] [Google Scholar]
- 8.Haugen BR, Alexander EK, Bible KC, et al. 2015 American Thyroid Association Management Guidelines for Adult Patients with Thyroid Nodules and Differentiated Thyroid Cancer: The American Thyroid Association Guidelines Task Force on Thyroid Nodules and Differentiated Thyroid Cancer. Thyroid : official journal of the American Thyroid Association. 2016;26(1):1–133. [DOI] [PMC free article] [PubMed] [Google Scholar]
- 9.Miyauchi A, Kudo T, Ito Y, et al. Estimation of the lifetime probability of disease progression of papillary microcarcinoma of the thyroid during active surveillance. Surgery. 2018;163(1):48–52. [DOI] [PubMed] [Google Scholar]
- 10.Papaleontiou M, Hughes DT, Guo C, Banerjee M, Haymart MR. Population-Based Assessment of Complications Following Surgery for Thyroid Cancer. J Clin Endocrinol Metab. 2017;102(7):2543–2551. [DOI] [PMC free article] [PubMed] [Google Scholar]
- 11.Heidenreich A, Bastian PJ, Bellmunt J, et al. EAU guidelines on prostate cancer. part 1: screening, diagnosis, and local treatment with curative intent-update 2013. Eur Urol. 2014;65(1):124–137. [DOI] [PubMed] [Google Scholar]
- 12.Mohler J, Bahnson RR, Boston B, et al. NCCN clinical practice guidelines in oncology: prostate cancer. J Natl Compr Canc Netw. 2010;8(2):162–200. [DOI] [PubMed] [Google Scholar]
- 13.Thompson I, Thrasher JB, Aus G, et al. Guideline for the management of clinically localized prostate cancer: 2007 update. J Urol. 2007;177(6):2106–2131. [DOI] [PubMed] [Google Scholar]
- 14.Warren JL, Klabunde CN, Schrag D, Bach PB, Riley GF. Overview of the SEER-Medicare data: content, research applications, and generalizability to the United States elderly population. Med Care. 2002;40(8 Suppl):IV-3–18. [DOI] [PubMed] [Google Scholar]
- 15.Deyo RA, Cherkin DC, Ciol MA. Adapting a clinical comorbidity index for use with ICD-9-CM administrative databases. J Clin Epidemiol. 1992;45(6):613–619. [DOI] [PubMed] [Google Scholar]
- 16.Daskivich TJ, Lai J, Dick AW, et al. Variation in treatment associated with life expectancy in a population-based cohort of men with early-stage prostate cancer. Cancer. 2014;120(23):3642–3650. [DOI] [PMC free article] [PubMed] [Google Scholar]
- 17.Daskivich TJ, Tan HJ, Litwin MS, Hu JC. Life Expectancy and Variation in Treatment for Early Stage Kidney Cancer. J Urol. 2016;196(3):672–677. [DOI] [PubMed] [Google Scholar]
- 18.Miyauchi A Clinical Trials of Active Surveillance of Papillary Microcarcinoma of the Thyroid. World J Surg. 2016;40(3):516–522. [DOI] [PMC free article] [PubMed] [Google Scholar]
- 19.Tuttle RM, Fagin JA, Minkowitz G, et al. Natural History and Tumor Volume Kinetics of Papillary Thyroid Cancers During Active Surveillance. JAMA otolaryngology-- head & neck surgery. 2017;143(10):1015–1020. [DOI] [PMC free article] [PubMed] [Google Scholar]
- 20.Davies L, Welch HG. Thyroid cancer survival in the United States: observational data from 1973 to 2005. Arch Otolaryngol Head Neck Surg. 2010;136(5):440–444. [DOI] [PubMed] [Google Scholar]
- 21.Griffin A, Brito JP, Bahl M, Hoang JK. Applying Criteria of Active Surveillance to Low-Risk Papillary Thyroid Cancer Over a Decade: How Many Surgeries and Complications Can Be Avoided? Thyroid. 2017;27(4):518–523. [DOI] [PubMed] [Google Scholar]
- 22.Oda H, Miyauchi A, Ito Y, et al. Incidences of Unfavorable Events in the Management of Low-Risk Papillary Microcarcinoma of the Thyroid by Active Surveillance Versus Immediate Surgery. Thyroid. 2016;26(1):150–155. [DOI] [PMC free article] [PubMed] [Google Scholar]
- 23.Wang Z, Vyas CM, Van Benschoten O, et al. Quantitative Analysis of the Benefits and Risk of Thyroid Nodule Evaluation in Patients >/=70 Years Old. Thyroid. 2018;28(4):465–471. [DOI] [PubMed] [Google Scholar]
- 24.Lang BH, Wong CK. A cost-effectiveness comparison between early surgery and non-surgical approach for incidental papillary thyroid microcarcinoma. Eur J Endocrinol. 2015;173(3):367–375. [DOI] [PubMed] [Google Scholar]
- 25.Rajjoub SR, Yan H, Calcatera NA, et al. Thyroid lobectomy is not sufficient for T2 papillary thyroid cancers. Surgery. 2018;163(5):1134–1143. [DOI] [PubMed] [Google Scholar]
- 26.Klabunde CN, Harlan LC, Warren JL. Data sources for measuring comorbidity: a comparison of hospital records and medicare claims for cancer patients. Med Care. 2006;44(10):921–928. [DOI] [PubMed] [Google Scholar]
Associated Data
This section collects any data citations, data availability statements, or supplementary materials included in this article.


