

This study used data from a national CDC network to examine trends related to COVID-19 hospitalization, care, and clinical outcomes across the United States.
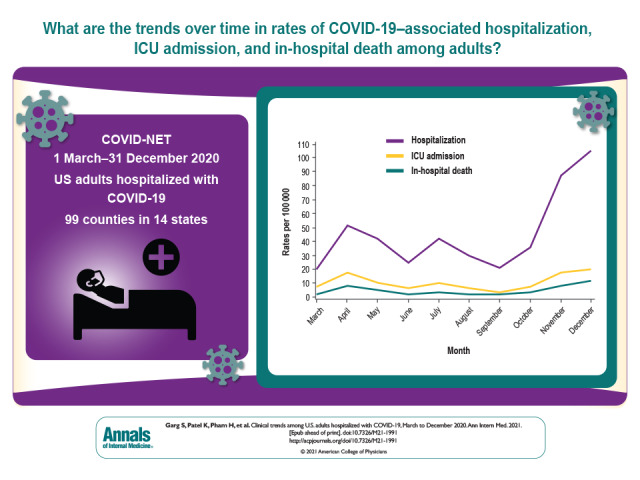
Visual Abstract. Clinical Trends in COVID-19 Hospitalizations.
This study used data from a national CDC network to examine trends related to COVID-19 hospitalization, care, and clinical outcomes across the United States.
Abstract
Background:
The COVID-19 pandemic has caused substantial morbidity and mortality.
Objective:
To describe monthly clinical trends among adults hospitalized with COVID-19.
Design:
Pooled cross-sectional study.
Setting:
99 counties in 14 states participating in the Coronavirus Disease 2019–Associated Hospitalization Surveillance Network (COVID-NET).
Patients:
U.S. adults (aged ≥18 years) hospitalized with laboratory-confirmed COVID-19 during 1 March to 31 December 2020.
Measurements:
Monthly hospitalizations, intensive care unit (ICU) admissions, and in-hospital death rates per 100 000 persons in the population; monthly trends in weighted percentages of interventions, including ICU admission, mechanical ventilation, and vasopressor use, among an age- and site-stratified random sample of hospitalized case patients.
Results:
Among 116 743 hospitalized adults with COVID-19, the median age was 62 years, 50.7% were male, and 40.8% were non-Hispanic White. Monthly rates of hospitalization (105.3 per 100 000 persons), ICU admission (20.2 per 100 000 persons), and death (11.7 per 100 000 persons) peaked during December 2020. Rates of all 3 outcomes were highest among adults aged 65 years or older, males, and Hispanic or non-Hispanic Black persons. Among 18 508 sampled hospitalized adults, use of remdesivir and systemic corticosteroids increased from 1.7% and 18.9%, respectively, in March to 53.8% and 74.2%, respectively, in December. Frequency of ICU admission, mechanical ventilation, and vasopressor use decreased from March (37.8%, 27.8%, and 22.7%, respectively) to December (20.5%, 12.3%, and 12.8%, respectively); use of noninvasive respiratory support increased from March to December.
Limitation:
COVID-NET covers approximately 10% of the U.S. population; findings may not be generalizable to the entire country.
Conclusion:
Rates of COVID-19–associated hospitalization, ICU admission, and death were highest in December 2020, corresponding with the third peak of the U.S. pandemic. The frequency of intensive interventions for management of hospitalized patients decreased over time. These data provide a longitudinal assessment of clinical trends among adults hospitalized with COVID-19 before widespread implementation of COVID-19 vaccines.
Primary Funding Source:
Centers for Disease Control and Prevention.
The Centers for Disease Control and Prevention (CDC) estimates that a total of 114.6 million infections, 97.1 million symptomatic illnesses, and 5.6 million hospitalizations associated with COVID-19 had occurred in the United States as of March 2021 (1–2). The clinical epidemiology of COVID-19 among U.S. adults has been well described, and older age and underlying conditions have been identified as risk factors for hospitalization and death (3–10). However, data on trends in clinical characteristics and outcomes of COVID-19–associated hospitalizations over time are limited (11–15). Trends may be affected by changes in COVID-19 epidemiology (16); implementation of mitigation measures (17, 18); evolving COVID-19 treatments (19–22); and the knowledge, experience, and capacity of health care providers and systems caring for hospitalized patients with COVID-19 (12–15). Using data from CDC's Coronavirus Disease 2019–Associated Hospitalization Surveillance Network (COVID-NET), we describe monthly trends in rates of COVID-19–associated hospitalization, intensive care unit (ICU) admission, and in-hospital death during March to December 2020, before the large-scale availability of COVID-19 vaccines. Among hospitalized patients, we further describe monthly trends in the distribution of clinical characteristics, interventions, and outcomes.
Methods
COVID-NET Description
COVID-NET does population-based surveillance for hospitalizations associated with laboratory-confirmed COVID-19 among persons of all ages in 99 counties in 14 states participating in the Emerging Infections Program (California, Colorado, Connecticut, Georgia, Maryland, Minnesota, New Mexico, New York, Oregon, and Tennessee) or the Influenza Hospitalization Surveillance Project (Iowa, Michigan, Ohio, and Utah). The network covers a catchment population of approximately 32 million persons (about 10% of the U.S. population) and collects data from more than 250 acute care hospitals (5, 23). Staff conduct active surveillance for COVID-19–associated hospitalizations at all hospitals in the COVID-NET catchment areas and identify case patients through systematic review of hospital, laboratory, and reportable disease databases. Hospitalized patients who are residents of the surveillance catchment area and have SARS-CoV-2 infection detected by molecular or rapid antigen testing during hospitalization or within 14 days before admission are included as COVID-NET case patients. Testing for SARS-CoV-2 is done at the discretion of health care providers or according to hospital testing policies.
Data Collected for All COVID-NET Cases
A minimum set of data are collected for all identified case patients, including site, age, sex, race/ethnicity, hospital admission date, and SARS-CoV-2 testing data, to produce hospitalization rates (https://gis.cdc.gov/grasp/covidnet/covid19_3.html). Rates are calculated using 2019 bridged-race postcensal estimates of the population from the National Center for Health Statistics (NCHS) for the counties included in surveillance (24).
Race/ethnicity is categorized using NCHS classifications as follows: non-Hispanic White, non-Hispanic Black, Hispanic or Latino (here called Hispanic), non-Hispanic Asian or Pacific Islander, and non-Hispanic American Indian or Alaska Native. Data are also collected on persons of more than 1 race/ethnicity. If race was unknown but ethnicity was Hispanic, patients were classified as Hispanic. If race was documented but ethnicity was unknown (6.6%), non-Hispanic ethnicity was assumed.
COVID-NET Sampling and Weighting Methodology
Trained surveillance staff collect detailed clinical data on a sample of hospitalized case patients through medical record abstractions using a standardized case report form (Supplement Figure). Data collected for sampled case patients include underlying medical conditions, ICU status, clinical interventions, and in-hospital outcomes.
To produce random samples of hospitalized patients for medical record abstraction, random numbers (1 through 100) are automatically generated and assigned to each case patient on entry into the surveillance database. The CDC provides sites with lists of random numbers associated with sampled case patients, stratified by time period (March to May 2020; June to September 2020; and monthly thereafter for October, November, and December 2020), site, and age group. Sample sizes vary by surveillance time period, site, and age group and are based on the total number of cases identified in each stratum.
For this analysis, sample sizes were generated to allow monthly estimation of the prevalence of clinical variables in 3 adult age groups (18 to 49 years, 50 to 64 years, and ≥65 years), and separately by 3 racial/ethnic groups (non-Hispanic White, non-Hispanic Black, and Hispanic). Because of small sample sizes, we could not generate monthly estimates for other racial/ethnic groups. Sample sizes were generated to produce relative SEs less than 0.3 for clinical variables, with monthly prevalence estimates of at least 10% (all estimates with relative SE >0.3 are noted in the Supplement Tables). Sample weights were applied to reflect the probability of a case being sampled for medical record abstraction within each specified stratum.
Estimation of Population-Based Rates of COVID-19–Associated Hospitalization, ICU Admission, and Death
We calculated unadjusted monthly rates of hospitalization per 100 000 persons in the population by taking the total number of hospitalized case patients in COVID-NET each month, overall and within each age group, sex, and site, as the numerator and dividing by NCHS population estimates as the denominator.
We also calculated unadjusted monthly rates of ICU admission and death per 100 000 persons in the population. Because ICU admission and death statuses were available only for sampled hospitalized patients, we used weighted numbers of sampled case patients with ICU admission or death as the numerator and NCHS population estimates as the denominator.
To produce robust rates of hospitalization, ICU admission, and death stratified by both age and race/ethnicity, we combined data from several months (that is, March to May, June to September, and October to December) and calculated rates as described in the previous paragraphs.
Trends in the Distribution of Clinical Characteristics, Interventions, and Outcomes Among a Weighted Sample of Hospitalized Case Patients With COVID-19
Among the sample of hospitalized case patients with detailed medical record abstractions, we examined monthly trends in the proportion with selected characteristics, interventions, in-hospital outcomes, and median length of hospital stay.
Facility residence at admission was defined as residence in a rehabilitation facility, assisted living or residential care facility, group home, nursing home, skilled-nursing facility, long-term care facility, long-term acute care hospital, alcohol or drug treatment center, or psychiatric facility. Health care workers were defined as all paid and unpaid persons serving in health care settings who have the potential for direct or indirect exposure to patients or infectious materials. Case patients were defined as having 0, 1, 2, or 3 or more underlying condition categories rather than individual conditions (Supplement Figure). Any medication prescribed for treatment of SARS-CoV-2 infection, including investigational agents or treatment through a clinical trial, was classified as a COVID-19–associated treatment. Invasive mechanical ventilation, bilevel positive airway pressure, continuous positive airway pressure, and high-flow nasal cannula were defined on the basis of the highest level of respiratory support received. Vasopressor use was included only if administered as a continuous infusion. Renal replacement therapy during hospitalization was described regardless of its receipt before hospitalization. In-hospital death was defined as death from any cause among case patients hospitalized with COVID-19.
Statistical Analysis
We used data from all case patients who were aged 18 years or older and were hospitalized with COVID-19 during 1 March to 31 December 2020 to describe demographics of hospitalized case patients and hospitalization rates by age, sex, race/ethnicity, and site. All other analyses were limited to sampled hospitalized patients for whom medical record abstractions were completed and a discharge disposition was known. Data for sampled case patients were analyzed using SAS survey procedures to account for sampling weights. We present proportions by month with 95% CIs for binary measures and medians with interquartile ranges for continuous measures. The Taylor series linearization method was used for variance estimation. For analyses using sampled data, unweighted case counts and weighted percentages were presented. All analyses were done using SAS, version 9.4 (SAS Institute).
This activity was reviewed by CDC, and its conduct was consistent with applicable federal law and CDC policy (see, for example, 45 C.F.R. part 46.102(l)(2), 21 C.F.R. part 56, 42 U.S.C. §241(d), 5 U.S.C. §552a, and 44 U.S.C. §3501 et seq.). Sites participating in COVID-NET obtained approval from their state or local institutional review board, as applicable.
Role of the Funding Source
This work was funded by the CDC, which was involved in the design of the study; the collection, analysis, and interpretation of the data; and the decision to approve publication of the finished manuscript.
Results
Demographic Characteristics of All COVID-19–Associated Hospitalizations and Hospitalization Rates
During 1 March to 31 December 2020, a total of 116 743 adults in COVID-NET aged 18 years or older were hospitalized with COVID-19. Among these 116 743 case patients, 26.4% were aged 18 to 49 years, 27.7% were aged 50 to 64 years, and 46.0% were aged 65 years or older (Table 1). Overall, 50.7% were male, 40.8% were non-Hispanic White, 26.9% were non-Hispanic Black, and 20.0% were Hispanic; race/ethnicity was unknown in 6.8% of cases. The distribution of hospitalized case patients varied by site.
Table 1.
Demographic Characteristics of Adults With Laboratory-Confirmed, COVID-19–Associated Hospitalizations

The median age of hospitalized case patients was 62.0 years; median age decreased from 61 years in March to 55 years in June but subsequently increased to 65 years in December (Supplement Table 1).
Monthly rates of COVID-19–associated hospitalization peaked in April, July, and December 2020 (Figure 1, A); overall rates ranged from 20.2 (March) to 105.3 (December) per 100 000 persons in the population (Supplement Table 2 [A]) and were highest among adults aged 65 years or older (Figure 1 [B]; Supplement Table 2 [A]). During most months, hospitalization rates were higher (rate ratio, 1.0 to 1.3) among men than women (Supplement Table 2 [B]). Hospitalization rates varied by site and month; most sites had peak rates in November or December 2020 (Supplement Table 2 [C]).
Figure 1. Rates (with 95% CIs) of COVID-19–associated hospitalization, ICU admission, and in-hospital death, by age group and month.

For hospitalization rate calculations, all identified cases in the Coronavirus Disease 2019–Associated Hospitalization Surveillance Network were used (n = 116 743). Unadjusted hospitalization rates per 100 000 persons in the population were calculated by taking the total number of hospitalized case patients each month, divided by 2019 bridged-race postcensal estimates of the population from the National Center for Health Statistics (NCHS), for the counties included in surveillance. For calculation of ICU admission and in-hospital death rates, a sample of hospitalized case patients with completed medical record review and a discharge disposition was used (n = 18 508). Unadjusted ICU admission and in-hospital death rates per 100 000 persons in the population among hospitalized patients were calculated using the weighted number of sampled case patients per month with each outcome as the numerator, divided by 2019 bridged-race postcensal estimates of the population from the National Center for Health Statistics (NCHS), for the counties included in surveillance. ICU = intensive care unit.
Demographic Characteristics of a Weighted Sample of Adults Hospitalized With COVID-19
Of the 116 743 adults hospitalized with COVID-19 during March to December 2020, we included 18 508 sampled case patients with completed medical record abstractions and a discharge disposition in clinical analyses. Demographic characteristics of sampled patients were similar to those of all hospitalized patients overall (Table 1) and across months (Supplement Table 1).
COVID-19–Associated ICU Admissions and Death Rates Based on a Weighted Sample of Adults Hospitalized With COVID-19
Peaks in monthly rates of ICU admission and in-hospital death associated with COVID-19 mirrored that of hospitalization (Figure 1 [A]; Supplement Table 3 [A]). Although rates of ICU admission and death increased with age, trends over time were similar across all 3 age groups (Figure 1 [C and D]; Supplement Table 3 [A]). Across all months, rates of ICU admission and death were higher for men than women (ICU admission rate ratio, 1.30 to 1.98; death rate ratio, 1.08 to 3.06).
COVID-19–Associated Hospitalization, ICU Admission, and In-Hospital Death Rates, by Race/Ethnicity and Age Group
Rates of hospitalization, ICU admission, and death associated with COVID-19 varied by race/ethnicity and age group (Appendix Figure and Supplement Table 4 [A and B]). Among persons aged 18 to 49 and 50 to 64 years, rates of each outcome were highest for Hispanic persons, followed by non-Hispanic Black persons, for each time period. Among those aged 65 years or older, rates of each outcome were highest among non-Hispanic Black persons during March to May; rates were similar for non-Hispanic Black and Hispanic persons during June to September; and rates were highest for Hispanic persons, followed by non-Hispanic Black persons, during October to December.
Appendix Figure. Rates (with 95% CIs) of COVID-19–associated hospitalization, ICU admission, and in-hospital death, by age and race/ethnicity.

Y-axis scales vary across panels. “Hispanic” indicates Hispanic or Latino. ICU = intensive care unit.
* All hospitalized Coronavirus Disease 2019–Associated Hospitalization Surveillance Network (COVID-NET) case patients with known race/ethnicity who were classified as non-Hispanic White, non-Hispanic Black, or Hispanic were included in this analysis (n = 101 021). Unadjusted hospitalization rates per 100 000 persons in the population were calculated by taking the total number of hospitalized case patients each month, divided by 2019 bridged-race postcensal estimates of the population from the National Center for Health Statistics (NCHS), for the counties included in surveillance.
† A sample of hospitalized COVID-NET case patients with completed medical record review, a discharge disposition, and known race/ethnicity who were classified as non-Hispanic White, non-Hispanic Black, or Hispanic was used in this analysis (n = 16 035). Unadjusted rates of ICU admission and in-hospital death per 100 000 persons in the population among hospitalized patients were calculated using the weighted number of sampled cases per month with each outcome as the numerator, divided by 2019 bridged-race postcensal estimates of the population from the National Center for Health Statistics (NCHS), for the counties included in surveillance.
Monthly Trends in the Distribution of Clinical Characteristics, Interventions, and Outcomes Among a Weighted Sample of Adults Hospitalized With COVID-19
Among the sample of 18 508 patients with detailed clinical data, the percentage hospitalized with COVID-19 who were admitted from a facility increased from 11.3% in March to a peak of 30.1% in April, then decreased to 14.3% in December (Table 2). The percentage of case patients identified as health care workers decreased from 5.7% in March to 1.6% in December. Most case patients had at least 2 underlying condition categories, with small variations over time. However, use of COVID-19–associated treatments varied significantly. From March to December, remdesivir use increased from 1.7% to 53.8% and systemic corticosteroid use from 18.9% to 74.2%. Although at least 40% of case patients received hydroxychloroquine treatment in March and April, 1% or fewer received it after May 2020 (Supplement Table 5). Tocilizumab was used infrequently (2.5% overall); use peaked at 7.8% in April and decreased to 0.4% in December.
Table 2.
Clinical Characteristics of a Sample of Adults With Laboratory-Confirmed, COVID-19–Associated Hospitalization, by Month (n= 18508)

The median length of stay for hospitalized patients (including those discharged alive and those who died in the hospital) decreased from 6.4 days in March to 4.7 days in July, then remained relatively unchanged from July through December (Figure 2 [A]; Supplement Table 6). The percentage of hospitalized patients admitted to the ICU decreased from 37.8% in March to 20.5% in December (Figure 2 [B]; Supplement Table 6), with decreases across all age groups. Vasopressor use similarly decreased from 22.7% in March to 12.8% in December (Figure 2 [C]; Supplement Table 6). Overall, 11.4% of case patients hospitalized with COVID-19 died in the hospital; the percentage of deaths decreased from a high of 17.1% in April to a low of 7.1% in June but remained stable or increased from July through December (Figure 2 [D]; Supplement Table 6). Among case patients who were discharged alive, 3.1% were discharged to hospice (range, 1.2% in March to 4.1% in December) (data not shown). Among adults aged 65 years or older, 6.7% were discharged to hospice.
Figure 2. Trends in median length of stay and percentages of interventions and outcomes among a sample of hospitalized adults with COVID-19, by age group and month.

All percentages are weighted. ICU = intensive care unit.
The percentage of hospitalized case patients receiving invasive mechanical ventilation as the highest level of respiratory support decreased from 27.8% in March to 12.3% in December (Figure 3 [A]; Supplement Table 6); trends were similar across age groups (Figure 3, B). The percentage receiving oxygen via a high-flow nasal cannula increased from 5.6% in March to 8.7% in December (Figure 3, A) but varied over time and across age groups (Figure 3, C). The percentage receiving bilevel positive airway pressure or continuous positive airway pressure similarly increased from 2.5% in March to 7.5% in December (Figure 3, A) and varied across age groups (Figure 3, D).
Figure 3. Trends in highest level of respiratory support received among a sample of hospitalized adults with COVID-19, by age group and month.

All percentages are weighted. BIPAP = bilevel positive airway pressure; CPAP = continuous positive airway pressure; ICU = intensive care unit.
Discussion
Using a large, geographically diverse, population-based surveillance network for COVID-19–associated hospitalizations during March to December 2020, we found that monthly rates of COVID-19–associated hospitalization, ICU admission, and in-hospital death were highest in December, corresponding with the third peak of the U.S. pandemic. Rates of all 3 outcomes were higher among older than younger adults, men than women, and Hispanic and non-Hispanic Black persons than non-Hispanic White persons across the entire surveillance period. Among hospitalized case patients, monthly trends in the percentage receiving clinically effective interventions, such as systemic steroids, remdesivir, and noninvasive respiratory support, increased. Over the same period, the percentage requiring intensive interventions, such as ICU-level care, invasive mechanical ventilation, and vasopressor support, decreased. Although the median age of hospitalized case patients and the percentage of in-hospital deaths decreased during the first 4 months of surveillance, median age subsequently increased, and the percentage of in-hospital deaths remained stable or increased during July through December. These data provide a longitudinal assessment of clinical trends among adults hospitalized with COVID-19 before widespread implementation of COVID-19 vaccines.
Community-level incidence of COVID-19 was likely the largest contributor to observed trends in rates of hospitalization, ICU admission, and in-hospital death associated with COVID-19 (14); monthly changes in COVID-19 incidence (https://covid.cdc.gov/covid-data-tracker/#datatracker-home) corresponded with monthly changes in COVID-NET hospitalization rates. Rates of all 3 outcomes varied by age, sex, and race/ethnicity. Similar to other studies, we found that older age (3–10) and male sex (25–27) were associated with higher rates of severe COVID-19 throughout the surveillance period. Although we did not adjust for such factors as age and underlying conditions, we found that men had up to 2 times the rate of ICU admission and 3 times the rate of in-hospital death of women. A recent global meta-analysis found that although men and women had a similar number of SARS-CoV-2 infections, male sex was associated with increased odds of admission to an intensive therapy unit (odds ratio, 2.84) and death (odds ratio, 1.39) (26). Although potential reasons for the association between male sex and severe COVID-19 are still being elucidated, theories include sex-related differences in adaptive immunity to viral infections; differences in expression of angiotensin-converting enzyme, which facilitates SARS-CoV-2 viral entry; and sex-based differences in the prevalence of comorbid conditions and risk behaviors (such as tobacco and alcohol use) that may be associated with severe COVID-19 (26, 27).
Our analysis also contributes to an expanding body of literature on racial and ethnic disparities related to COVID-19 (5, 8, 28–33). Rates of hospitalization, ICU admission, and in-hospital death were highest among Hispanic persons across all age groups, followed by non-Hispanic Black persons. Possible contributing factors, which we did not account for in this analysis, include geographic differences in COVID-19 incidence and care practices that may correlate with the geographic distribution of racial/ethnic groups. Inequities in social determinants of health with downstream effects on overall health of racial/ethnic minority groups (34) likely also contributed to these disparities. Other studies have similarly found increased morbidity and mortality associated with COVID-19 among non-Hispanic Black (33) and Hispanic (35, 36) persons compared with non-Hispanic White persons.
Despite the increase in rates of hospitalization, ICU admission, and death during the winter peak of the pandemic, the percentage of hospitalized case patients who required intensive interventions decreased substantially over the surveillance period, as in other studies (11, 12, 14, 15). Evolving practices of health care providers, guided by increasing knowledge and experience in managing patients with COVID-19, likely contributed to improved patient outcomes (11, 12, 15). Although the percentage of patients receiving invasive mechanical ventilation decreased over time across all age groups, use of noninvasive respiratory support, such as bilevel positive airway pressure, continuous positive airway pressure, and high-flow nasal cannula, increased. Several studies have shown improved outcomes with prone positioning (37) and use of noninvasive ventilatory support in lieu of invasive mechanical ventilation (11, 15, 38) for patients with acute respiratory failure associated with COVID-19. Decreasing use of invasive mechanical ventilation may have also lessened the need for ICU-level care because other types of respiratory support could be delivered in non-ICU settings (39).
Increasing use of more effective treatments of COVID-19 may also have improved outcomes among patients hospitalized with COVID-19. Dexamethasone has been shown to reduce 28-day mortality among patients requiring supplemental oxygen or invasive mechanical ventilation (20); use of systemic corticosteroids in our analysis increased from less than 20% in March to almost 75% in December 2020. Remdesivir, which has been shown to reduce time to clinical recovery in patients with severe COVID-19 (19), was received by fewer than 2% of patients in March, but this percentage increased to more than 50% by December 2020. Meanwhile, the use of medications found to be ineffective for treatment of COVID-19 (40), such as hydroxychloroquine, decreased substantially by June 2020. Use of other immunomodulatory agents was infrequent during the period covered by our analysis. Recent data among hospitalized patients with COVID-19 pneumonia have shown reduced time to recovery and improved clinical status with baricitinib (41) and reduced likelihood of progression to mechanical ventilation or death with tocilizumab (42); accordingly, use of these agents in combination with dexamethasone alone or dexamethasone plus remdesivir may increase.
Observed trends in clinical interventions and outcomes may in part reflect a complex interplay between COVID-19 incidence and health care system capacity (43). As hospitalization rates peaked in different phases and geographic locations, ICU admission rates likely also increased. However, during peaks, the percentage of hospitalized patients receiving ICU admission, mechanical ventilation, or renal replacement therapy (44) could have decreased or been capped because of the scarcity of resources. An analysis from CDC's National Healthcare Safety Network found that from April to July 2020, many hospitals reported shortages of supplies for ventilators and other resources (43). Changes in timing of discharge and discharge disposition might also be influenced by bed capacity or the ability to discharge patients to subacute or long-term care facilities. In our analysis, almost 7% of patients aged 65 years or older were discharged to hospice. Among all case patients, the percentage discharged to hospice increased from 1% in March to 4% in December 2020. Patterns in mortality might also be influenced by health care system capacity. One study done among 88 Department of Veterans Affairs hospitals found that strains on ICU capacity were correlated with higher ICU mortality associated with COVID-19 (45). Linkage of COVID-NET data to facility-level data could allow for more direct examination of the effect of resource availability on COVID-19–associated interventions and outcomes.
This analysis has several limitations. Because COVID-NET covers approximately 10% of the U.S. population, our findings may not be generalizable to the entire country. This analysis presented data for the entire network and did not account for differences across sites; several factors, including peaks in hospitalization rates and the racial/ethnic distribution of case patients, varied by site. Because SARS-CoV-2 testing was done at the discretion of health care providers, COVID-NET may not have captured all COVID-19–associated hospitalizations. Changes in testing practices over the course of the pandemic may have influenced trends because sicker patients were more likely to be tested early in the pandemic when testing capacity was limited. This analysis included only data on in-hospital outcomes; thus, we could not characterize the burden of COVID-19–associated deaths outside the hospital. The relative SEs for some estimates were greater than 0.3, particularly for interventions or outcomes with low prevalence, such as renal replacement therapy or in-hospital deaths among patients aged 18 to 49 years. Last, sample sizes were not sufficient to fully explore differences in interventions and outcomes by race/ethnicity or to produce estimates for all racial/ethnic groups, including non-Hispanic American Indian or Alaska Native and Asian or Pacific Islander patients.
In this analysis, done during the first 10 months of the U.S. pandemic and before the large-scale availability of COVID-19 vaccines, we found that monthly rates of COVID-19–associated hospitalization, ICU admission, and in-hospital death peaked in December 2020 and were highest among older adults, men, and racial/ethnic minority groups. We saw encouraging trends in the percentage of hospitalized patients receiving effective treatments of COVID-19 and in the percentage requiring intensive interventions. These trends likely reflected increasing knowledge, experience, and tools to combat COVID-19 among health care systems and providers. However, this analysis also highlights ongoing racial and ethnic disparities related to outcomes associated with severe COVID-19. It will be important to follow trends in patient characteristics, interventions, and outcomes over time to monitor the effects of clinical and public health interventions, including vaccination, and to ensure that progress is being made in closing the gap in racial and ethnic disparities related to COVID-19 in the United States.
Supplementary Material
Footnotes
This article was published at Annals.org on 10 August 2021.
References
- 1.Reese H , Iuliano AD , Patel NN , et al. Estimated incidence of coronavirus disease 2019 (COVID-19) illness and hospitalization—United States, February–September 2020. Clin Infect Dis. 2021;72:e1010-e1017. [PMID: ] doi: 10.1093/cid/ciaa1780 [DOI] [PMC free article] [PubMed] [Google Scholar]
- 2.Centers for Disease Control and Prevention. Estimated disease burden of COVID-19. 2020. Accessed at www.cdc.gov/coronavirus/2019-ncov/cases-updates/burden.html on 20 April 2021.
- 3.Bhatraju PK , Ghassemieh BJ , Nichols M , et al. Covid-19 in critically ill patients in the Seattle region — case series. N Engl J Med. 2020;382:2012-2022. [PMID: ] doi: 10.1056/NEJMoa2004500 [DOI] [PMC free article] [PubMed] [Google Scholar]
- 4.Cummings MJ , Baldwin MR , Abrams D , et al. Epidemiology, clinical course, and outcomes of critically ill adults with COVID-19 in New York City: a prospective cohort study. Lancet. 2020;395:1763-1770. [PMID: ] doi: 10.1016/S0140-6736(20)31189-2 [DOI] [PMC free article] [PubMed] [Google Scholar]
- 5.Garg S , Kim L , Whitaker M , et al. Hospitalization rates and characteristics of patients hospitalized with laboratory-confirmed coronavirus disease 2019 — COVID-NET, 14 states, March 1–30, 2020. MMWR Morb Mortal Wkly Rep. 2020;69:458-464. [PMID: ] doi: 10.15585/mmwr.mm6915e3 [DOI] [PMC free article] [PubMed] [Google Scholar]
- 6.Goyal P , Choi JJ , Pinheiro LC , et al. Clinical characteristics of Covid-19 in New York City [Letter]. N Engl J Med. 2020;382:2372-2374. [PMID: ] doi: 10.1056/NEJMc2010419 [DOI] [PMC free article] [PubMed] [Google Scholar]
- 7.Kim L , Garg S , O'Halloran A , et al. Risk factors for intensive care unit admission and in-hospital mortality among hospitalized adults identified through the US Coronavirus Disease 2019 (COVID-19)-Associated Hospitalization Surveillance Network (COVID-NET). Clin Infect Dis. 2021;72:e206-e214. [PMID: ] doi: 10.1093/cid/ciaa1012 [DOI] [PMC free article] [PubMed] [Google Scholar]
- 8.Ko JY , Danielson ML , Town M , et al; COVID-NET Surveillance Team. Risk factors for coronavirus disease 2019 (COVID-19)–associated hospitalization: COVID-19–Associated Hospitalization Surveillance Network and Behavioral Risk Factor Surveillance System. Clin Infect Dis. 2021;72:e695-e703. [PMID: ] doi: 10.1093/cid/ciaa1419 [DOI] [PMC free article] [PubMed] [Google Scholar]
- 9.Petrilli CM , Jones SA , Yang J , et al. Factors associated with hospital admission and critical illness among 5279 people with coronavirus disease 2019 in New York City: prospective cohort study. BMJ. 2020;369:m1966. [PMID: ] doi: 10.1136/bmj.m1966 [DOI] [PMC free article] [PubMed] [Google Scholar]
- 10.Richardson S , Hirsch JS , Narasimhan M , et al; the Northwell COVID-19 Research Consortium. Presenting characteristics, comorbidities, and outcomes among 5700 patients hospitalized with COVID-19 in the New York City area. JAMA. 2020;323:2052-2059. [PMID: ] doi: 10.1001/jama.2020.6775 [DOI] [PMC free article] [PubMed] [Google Scholar]
- 11.Anesi GL , Jablonski J , Harhay MO , et al. Characteristics, outcomes, and trends of patients with COVID-19-related critical illness at a learning health system in the United States. Ann Intern Med. 2021;174:613-621. [PMID: ] doi: 10.7326/M20-5327 [DOI] [PMC free article] [PubMed] [Google Scholar]
- 12.Horwitz LI , Jones SA , Cerfolio RJ , et al. Trends in COVID-19 risk-adjusted mortality rates. J Hosp Med. 2021;16:90-92. [PMID: ] doi: 10.12788/jhm.3552 [DOI] [PubMed] [Google Scholar]
- 13.Armstrong RA , Kane AD , Cook TM . Outcomes from intensive care in patients with COVID-19: a systematic review and meta-analysis of observational studies. Anaesthesia. 2020;75:1340-1349. [PMID: ] doi: 10.1111/anae.15201 [DOI] [PubMed] [Google Scholar]
- 14.Asch DA , Sheils NE , Islam MN , et al. Variation in US hospital mortality rates for patients admitted with COVID-19 during the first 6 months of the pandemic. JAMA Intern Med. 2021;181:471-478. [PMID: ] doi: 10.1001/jamainternmed.2020.8193 [DOI] [PMC free article] [PubMed] [Google Scholar]
- 15.Auld SC , Caridi-Scheible M , Robichaux C , et al; Emory COVID-19 Quality and Clinical Research Collaborative. Declines in mortality over time for critically ill adults with coronavirus disease 2019 [Letter]. Crit Care Med. 2020;48:e1382-e1384. [PMID: ] doi: 10.1097/CCM.0000000000004687 [DOI] [PMC free article] [PubMed] [Google Scholar]
- 16.Boehmer TK , DeVies J , Caruso E , et al. Changing age distribution of the COVID-19 pandemic — United States, May–August 2020. MMWR Morb Mortal Wkly Rep. 2020;69:1404-1409. [PMID: ] doi: 10.15585/mmwr.mm6939e1 [DOI] [PMC free article] [PubMed] [Google Scholar]
- 17.Joo H , Miller GF , Sunshine G , et al. Decline in COVID-19 hospitalization growth rates associated with statewide mask mandates — 10 states, March–October 2020. MMWR Morb Mortal Wkly Rep. 2021;70:212-216. [PMID: ] doi: 10.15585/mmwr.mm7006e2 [DOI] [PMC free article] [PubMed] [Google Scholar]
- 18.Gandhi M , Rutherford GW . Facial masking for Covid-19 — potential for “variolation” as we await a vaccine. N Engl J Med. 2020;383:e101. [PMID: ] doi: 10.1056/NEJMp2026913 [DOI] [PMC free article] [PubMed] [Google Scholar]
- 19.Beigel JH , Tomashek KM , Dodd LE , et al; ACTT-1 Study Group Members. Remdesivir for the treatment of Covid-19 — final report. N Engl J Med. 2020;383:1813-1826. [PMID: ] doi: 10.1056/NEJMoa2007764 [DOI] [PMC free article] [PubMed] [Google Scholar]
- 20.Horby P , Lim WS , Emberson JR , et al; RECOVERY Collaborative Group. Dexamethasone in hospitalized patients with Covid-19. N Engl J Med. 2021;384:693-704. [PMID: ] doi: 10.1056/NEJMoa2021436 [DOI] [PMC free article] [PubMed] [Google Scholar]
- 21.Kalil AC , Patterson TF , Mehta AK , et al; ACTT-2 Study Group Members. Baricitinib plus remdesivir for hospitalized adults with Covid-19. N Engl J Med. 2021;384:795-807. [PMID: ] doi: 10.1056/NEJMoa2031994 [DOI] [PMC free article] [PubMed] [Google Scholar]
- 22.Paranjpe I , Fuster V , Lala A , et al. Association of treatment dose anticoagulation with in-hospital survival among hospitalized patients with COVID-19 [Letter]. J Am Coll Cardiol. 2020;76:122-124. [PMID: ] doi: 10.1016/j.jacc.2020.05.001 [DOI] [PMC free article] [PubMed] [Google Scholar]
- 23.Centers for Disease Control and Prevention. Coronavirus Disease 2019 (COVID-19)-Associated Hospitalization Surveillance Network (COVID-NET). Updated 28 August 2020. Accessed at www.cdc.gov/coronavirus/2019-ncov/covid-data/covid-net/purpose-methods.html on 20 April 2021.
- 24.Centers for Disease Control and Prevention. U.S. Census populations with bridged race categories. National Vital Statistics System. 2019. Accessed at www.cdc.gov/nchs/nvss/bridged_race.htm on 20 April 2021.
- 25.Finelli L , Gupta V , Petigara T , et al. Mortality among US patients hospitalized with SARS-CoV-2 infection in 2020. JAMA Netw Open. 2021;4:e216556. [PMID: ] doi: 10.1001/jamanetworkopen.2021.6556 [DOI] [PMC free article] [PubMed] [Google Scholar]
- 26.Peckham H , de Gruijter NM , Raine C , et al. Male sex identified by global COVID-19 meta-analysis as a risk factor for death and ITU admission. Nat Commun. 2020;11:6317. [PMID: ] doi: 10.1038/s41467-020-19741-6 [DOI] [PMC free article] [PubMed] [Google Scholar]
- 27.Vahidy FS , Pan AP , Ahnstedt H , et al. Sex differences in susceptibility, severity, and outcomes of coronavirus disease 2019: cross-sectional analysis from a diverse US metropolitan area. PLoS One. 2021;16:e0245556. [PMID: ] doi: 10.1371/journal.pone.0245556 [DOI] [PMC free article] [PubMed] [Google Scholar]
- 28.Escobar GJ , Adams AS , Liu VX , et al. Racial disparities in COVID-19 testing and outcomes. Retrospective cohort study in an integrated health system. Ann Intern Med. 2021;174:786-793. [PMID: ] doi: 10.7326/M20-6979 [DOI] [PMC free article] [PubMed] [Google Scholar]
- 29.Gold JAW , Wong KK , Szablewski CM , et al. Characteristics and clinical outcomes of adult patients hospitalized with COVID-19 — Georgia, March 2020. MMWR Morb Mortal Wkly Rep. 2020;69:545-550. [PMID: ] doi: 10.15585/mmwr.mm6918e1 [DOI] [PMC free article] [PubMed] [Google Scholar]
- 30.Karaca-Mandic P , Georgiou A , Sen S . Assessment of COVID-19 hospitalizations by race/ethnicity in 12 states. JAMA Intern Med. 2021;181:131-134. [PMID: ] doi: 10.1001/jamainternmed.2020.3857 [DOI] [PMC free article] [PubMed] [Google Scholar]
- 31.Mackey K , Ayers CK , Kondo KK , et al. Racial and ethnic disparities in COVID-19-related infections, hospitalizations, and deaths. A systematic review. Ann Intern Med. 2021;174:362-373. [PMID: ] doi: 10.7326/M20-6306 [DOI] [PMC free article] [PubMed] [Google Scholar]
- 32.Muñoz-Price LS , Nattinger AB , Rivera F , et al. Racial disparities in incidence and outcomes among patients with COVID-19. JAMA Netw Open. 2020;3:e2021892. [PMID: ] doi: 10.1001/jamanetworkopen.2020.21892 [DOI] [PMC free article] [PubMed] [Google Scholar]
- 33.Price-Haywood EG , Burton J , Fort D , et al. Hospitalization and mortality among black patients and white patients with Covid-19. N Engl J Med. 2020;382:2534-2543. [PMID: ] doi: 10.1056/NEJMsa2011686 [DOI] [PMC free article] [PubMed] [Google Scholar]
- 34.Centers for Disease Control and Prevention. Introduction to COVID-19 racial and ethnic health disparities. Updated 10 December 2020. Accessed at www.cdc.gov/coronavirus/2019-ncov/community/health-equity/racial-ethnic-disparities/index.html on 20 April 2021.
- 35.Dai CL , Kornilov SA , Roper RT , et al. Characteristics and factors associated with COVID-19 infection, hospitalization, and mortality across race and ethnicity. Clin Infect Dis. 2021. [PMID: ] doi: 10.1093/cid/ciab154 [DOI] [PMC free article] [PubMed] [Google Scholar]
- 36.Podewils LJ , Burket TL , Mettenbrink C , et al. Disproportionate incidence of COVID-19 infection, hospitalizations, and deaths among persons identifying as Hispanic or Latino — Denver, Colorado March–October 2020. MMWR Morb Mortal Wkly Rep. 2020;69:1812-1816. [PMID: ] doi: 10.15585/mmwr.mm6948a3 [DOI] [PMC free article] [PubMed] [Google Scholar]
- 37.Mathews KS , Soh H , Shaefi S , et al; STOP-COVID Investigators. Prone positioning and survival in mechanically ventilated patients with coronavirus disease 2019–related respiratory failure. Crit Care Med. 2021;49:1026-1037. [PMID: ] doi: 10.1097/CCM.0000000000004938 [DOI] [PMC free article] [PubMed] [Google Scholar]
- 38.Mellado-Artigas R , Ferreyro BL , Angriman F , et al; COVID-19 Spanish ICU Network. High-flow nasal oxygen in patients with COVID-19-associated acute respiratory failure. Crit Care. 2021;25:58. [PMID: ] doi: 10.1186/s13054-021-03469-w [DOI] [PMC free article] [PubMed] [Google Scholar]
- 39.Coppadoro A , Benini A , Fruscio R , et al. Helmet CPAP to treat hypoxic pneumonia outside the ICU: an observational study during the COVID-19 outbreak. Crit Care. 2021;25:80. [PMID: ] doi: 10.1186/s13054-021-03502-y [DOI] [PMC free article] [PubMed] [Google Scholar]
- 40.National Institutes of Health. COVID-19 treatment guidelines: chloroquine or hydroxychloroquine with or without azithromycin. 2020. Accessed at www.covid19treatmentguidelines.nih.gov/antiviral-therapy/chloroquine-or-hydroxychloroquine-with-or-without-azithromycin on 20 April 2021.
- 41.Kalil AC , Patterson TF , Mehta AK , et al; ACTT-2 Study Group Members. Baricitinib plus remdesivir for hospitalized adults with Covid-19. N Engl J Med. 2021;384:795-807. [PMID: ] doi: 10.1056/NEJMoa2031994 [DOI] [PMC free article] [PubMed] [Google Scholar]
- 42.Salama C , Han J , Yau L , et al. Tocilizumab in patients hospitalized with Covid-19 pneumonia. N Engl J Med. 2021;384:20-30. [PMID: ] doi: 10.1056/NEJMoa2030340 [DOI] [PMC free article] [PubMed] [Google Scholar]
- 43.Wu H , Soe MM , Konnor R , et al; National Healthcare Safety Network. Hospital capacities and shortages of healthcare resources among US hospitals during the coronavirus disease 2019 (COVID-19) pandemic, National Healthcare Safety Network (NHSN), March 27–July 14, 2020. Infect Control Hosp Epidemiol. 2021:1-4. [PMID: ] doi: 10.1017/ice.2021.280 [DOI] [PMC free article] [PubMed] [Google Scholar]
- 44.Reddy YNV , Walensky RP , Mendu ML , et al. Estimating shortages in capacity to deliver continuous kidney replacement therapy during the COVID-19 pandemic in the United States. Am J Kidney Dis. 2020;76:696-709.e1. [PMID: ] doi: 10.1053/j.ajkd.2020.07.005 [DOI] [PMC free article] [PubMed] [Google Scholar]
- 45.Bravata DM , Perkins AJ , Myers LJ , et al. Association of intensive care unit patient load and demand with mortality rates in US Department of Veterans Affairs hospitals during the COVID-19 pandemic. JAMA Netw Open. 2021;4:e2034266. [PMID: ] doi: 10.1001/jamanetworkopen.2020.34266 [DOI] [PMC free article] [PubMed] [Google Scholar]
Associated Data
This section collects any data citations, data availability statements, or supplementary materials included in this article.