Abstract
Background
The comparison between profiles during the commissioning of the treatment planning system is an essential procedure. It is impossible to designate a field size for off-axis, wedged, and FFF beams directly by using the definition of the on-axis symmetric field size. This work proposes the use of different characteristic points as indicators of the field size for commissioning and QA purposes. This work aimed to search for the beam profile’s characteristic points and use them for the TPS commissioning purposes.
Materials and methods
The proposal is to use profile inflection points as the beam profile characteristic points. The usage of dedicated software allowed for comparing distances between inflection points and between points of 50% intensity. For the off-axis, wedged, and FFF fields, comparisons were made to the nominal field sizes.
Results
Distances between inflection points proved to be different by less than 1 mm from nominal field sizes for all kinds of investigated beams.
Conclusions
Inflection points are convenient for comparing the off-axis, wedged, and FFF field sizes because of their independence from profile normalization. With finite accuracy, the inflection points could be used for the above kind of beam sizes designation.
Keywords: TPS verification, beam profile, dose gradient, inflection point
Introduction
The commissioning of the treatment planning system is a very long and sophisticated process. Despite the rich literature [1–6], official Technical Reports [7, 8], and national verification audits [9–11] concerning TPS verification, many questions still remain unanswered.
Our experience in the field of dosimetric verification of the treatment planning systems (TPS) has been recently described [12]. That paper shows a method of designating boundaries between high and low dose gradient regions. It was made only for open symmetric fields without any beam modifiers. For symmetric open fields, several steps executed during data processing led to optimal conditions of comparison between measured and calculated data. First the real size was determined (distance between 50% intensity of the normalized to 100% in axis beam profile). Next, centering (symmetrization) and renormalizing to nominal size was performed. The difference between the raw measurement and nominal field size was calculated. The above actions were needed due to possible uncertainty in the linac’s jaws or MLC setup. That procedure cannot be applied to active sides of wedged fields, open off-axis fields, and a mix of both.
This article presents the extension of the method to modified and off-axis fields. The main aim was to check the possibility of using the same procedure of symmetrization and renormalization for the modified and off-axis fields coming from Elekta Synergy (Elekta Instrument AB, Stockholm, Sweden) with 80 MLCs collimator. The proposed method was also used to compare flattening filter free (FFF) Varian TrueBeam® (Varian Medical Systems, Palo Alto, USA) linac’s beam profile.
The ratio of dynamic plans among all others is still increasing. However, the base of dose calculation, even for VMAT techniques, is a sequence of static fields [13] and proper commissioning of TPS for static beams seems very vital.
This work aimed to search for the beam profile’s characteristic points and use them for the TPS commissioning purposes.
Materials and methods
Data collection
All the measurements were done in 3-D full-scattering water phantoms: BluePhantom by Wellhofer/IBA and CC13 air chamber (IBA Dosimetry GmbH, Schwarzenbruck, Germany) for Elekta profiles and MP3 Water Phantom and Semiflex 0.125 ccc air chamber (or 0.07 cm3 Semiflex 3D chamber) by PTW (PTW, Freiburg, Freiburg, Germany) for Varian. The acquisition of beam data and data analysis was controlled by PTW Mephysto mc2 software. For data collection from Elekta, the continuous mode of measurements was used with a constant resolution of 0.8 mm. Varian beam profiles were measured with a step-by-step method with a resolution of 2 or 5 mm (depending on field size) in the low dose gradient and resolution of 1mm in the penumbra region. Necessary calculations of dose distribution were made in the Oncentra External Beam v. 4.3 with a resolution of 2.0 mm and with the Eclipse v. 13.6 using a resolution of 2.5 mm for data from Elekta and Varian, respectively.
Postprocessing for open symmetric fields
For proper comparison of the measured open symmetric field with the calculated one, centering and renormalization of both were used [12]. For this purpose, the x values for 50% intensity of the normalized to 100% beam profile need to be known. The effect of centering was that the points were symmetrical in relation to the beam axis. However, because of the absolute accuracy of measurements and inevitable uncertainties of jaws and MLC positioning, the distance between those two points may not be exactly equal to the nominal field size. Therefore, to allow for comparing the nominal profile (nominal because of its symmetry and size), the renormalization step was performed.
Postprocessing for asymmetric fields
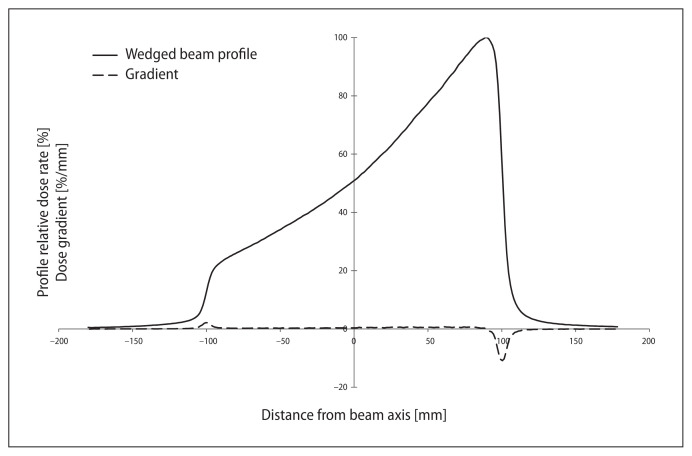
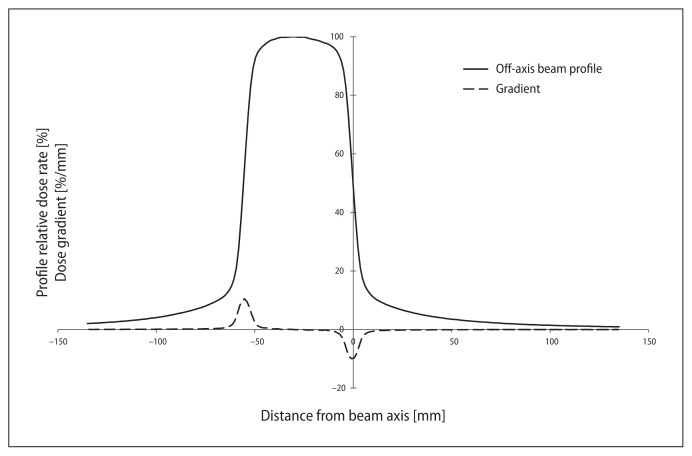
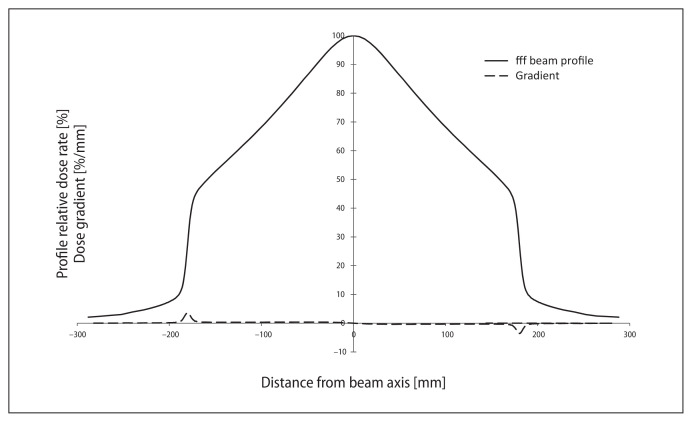
On the other hand, for active sides of wedge fields (Fig. 1), the high dose region for the profile might reach only a few percent assuming normalization to 100% for maximum dose. A similar situation occurs also for off-axis open fields (Fig. 2), when it is hard to find the field edge. For FFF profiles, the traditional way of computing the field size could also be impossible to apply (Fig. 3). This paper presents a different solution.
Figure 1.
Measured wedged beam profile (solid line) and its gradient (dotted line) plots for 18 MV, field size 5 × 20, depth = 10 cm and SSD = 90 cm
Figure 2.
Measured off-axis beam profile (solid line) and its gradient (dotted line) plots for beam 10 × 5 on 20 cm depth and SSD = 90 for 6 MV photons
Figure 3.
Varian TrueBeam® measured profiles of beam without a flattening filter (solid line) and its gradient (dotted line). Field size 30 × 30 cm, depth = 20 cm for 10 MV photons SSD = 100 cm
All characteristic points of the profile, which could be used similarly as 50% intensity points for open symmetrical beams, were looked for. Desired properties were found in the dose profile derivative (inflection of the original curve). For a given 2D curve, the zero of its derivative gives the extreme of the curve. The second derivative’s zeros give the inflection points — points in which the curve changes from concave to convex or vice versa.
Data comparison
Many measured and calculated profiles were examined using dedicated software (by Tadeusz Jedynak: alfard.5v.pl). First, the comparison between the inflection points behavior for open symmetrical beams of various energies and field sizes was made. The purpose of this step was to check if the inflection points could be characteristic points of the beam profile and useful for comparison purposes. Zeros of the first derivative were computed in two ways: using earlier designated boundaries between the high and low gradient [12] and the newly implemented method (fitting the first derivative peak points for the Gauss curve [14].
The Gaussian could be described as:
where:
σ — distance between Gaussian inflection points,
m — the x value of the Gaussian maximum.
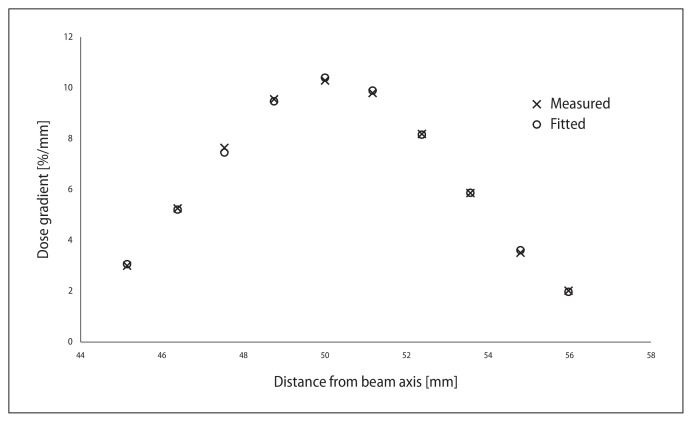
Figure 4 presents the sample of the first derivative peak points and fitted curve and points from Gaussian. The number of points used for fitting was between 7 and 16, depending on plot’s resolution and the height of its steep part. The quality of fitting of experimental points to model was determined by using the coefficient of determination [15]:
Figure 4.
Measured points and points derived from fitted Gaussian
where:
ŷn — n-th theoretical value from the model;
ȳ — the mean value of the observed data;
yn — n-th experimental value.
R2 values from range 0.8 to 0.9 are acknowledged as good, and from range 0.9 to 1.0 as very good in model fit.
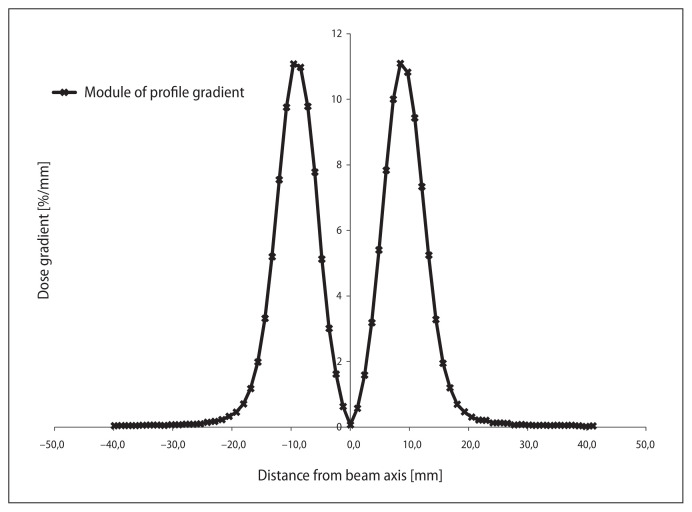
The boundaries abscissas’ mean value was calculated and treated as the maximum peak’s abscissa, assuming that the curve is symmetrical about its maximum. This calculation was quick, but it gave more significant errors, especially for smaller fields. For these fields, the peak’s near-axis part is deformed and becomes non-Gaussian (Figure 5). After the analysis, the method described above was voided, and the emphasis was placed only on the Gaussian fitting.
Figure 5.
Plot of modulus of beam gradient for field with width equals 2 cm. Near-axis part of plot is not Gaussian-like. Original field (not presented on the above plot) was measured for 6 MV, SSD = 90.0 cm and on the depth of 10.0 cm
Results
Method validation
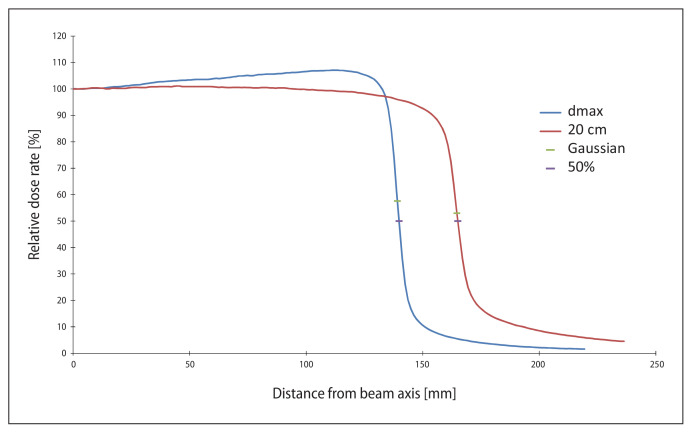
Using Elekta’s data for open symmetric fields, derived values of peak maxima were compared to values coming from the points of 50% intensity of the on-axis dose. The results are presented in Table 1. The results of curve fitting using Gaussian were good (value under 0.9) only in a few cases and for all other cases they were very good. Differences between derived values of inflection points and field size were less than 1 mm for all cases. The process of profile comparison consists of two steps. First, the field size was checked in terms of inflection points (treated as points that determine the field size). In the next step, the renormalized profiles were compared, but the comparison was relative — the same parts of profiles using terms of the high and low dose gradient were compared [12]. To show the differences, two profiles for dmax and 20 cm depth with marked 50% intensity points and inflection points are presented in Figure 6.
Table 1.
Comparison of field edges designed by 50% intensity and inflection points for open symmetric beams. M — measurement, C — calculation from Gaussian, D — difference between C and M, R2 — coefficient of determination. The worst delta results for each case are in bold
| Depth [mm] |
Field edge position | R2 | Δ [mm] |
|
|---|---|---|---|---|
| M | C | |||
| [mm] | [mm] | |||
| 6 MV, 5 × 5 | ||||
| 16 | −22.3 | −22.2 | 0.979 | 0.1 |
| 22.5 | 22.4 | 0.996 | −0.1 | |
| 50 | −23.1 | −23.0 | 0.997 | 0.1 |
| 23.4 | 23.2 | 0.982 | −0.1 | |
| 100 | −24.4 | −24.2 | 0.992 | 0.2 |
| 24.6 | 24.4 | 0.984 | −0.2 | |
| 200 | −26.9 | −26.6 | 0.963 | 0.3 |
| 27.2 | 26.8 | 0.986 | −0.3 | |
| 16 | −23.0 | −22.9 | 0.972 | 0.1 |
| 22.8 | 22.7 | 0.992 | −0.1 | |
| 50 | −23.9 | −23.8 | 0.994 | 0.1 |
| 23.6 | 23.5 | 0.990 | −0.1 | |
| 100 | −25.1 | −24.9 | 0.993 | 0.2 |
| 25.2 | 25.0 | 0.994 | −0.2 | |
| 200 | −27.9 | −27.6 | 0.989 | 0.3 |
| 27.3 | 27.0 | 0.988 | −0.3 | |
| 6 MV, 10 × 10 | ||||
| 16 | −45.0 | −44.8 | 0.985 | 0.2 |
| 45.5 | 45.2 | 0.984 | −0.3 | |
| 50 | −46.6 | −46.4 | 0.988 | 0.2 |
| 47.1 | 46.9 | 0.989 | −0.3 | |
| 100 | −49.1 | −48.8 | 0.975 | 0.3 |
| 49.6 | 49.3 | 0.955 | −0.3 | |
| 200 | −54.2 | −53.8 | 0.950 | 0.4 |
| 54.6 | 54.2 | 0.960 | −0.5 | |
| 16 | −46.0 | −45.8 | 0.981 | 0.2 |
| 45.9 | 45.7 | 0.974 | −0.2 | |
| 50 | −47.6 | −47.4 | 0.996 | 0.2 |
| 47.8 | 47.5 | 0.973 | −0.2 | |
| 100 | −50.4 | −50.1 | 1.000 | 0.3 |
| 50.6 | 50.3 | 0.986 | −0.3 | |
| 200 | −55.5 | −55.0 | 0.987 | 0.4 |
| 55.3 | 54.9 | 0.996 | −0.4 | |
| 18 MV, 5 × 5 | ||||
| 29 | −22.4 | −22.3 | 0.948 | 0.2 |
| 23.0 | 22.9 | 0.945 | −0.1 | |
| 50 | −22.9 | −22.7 | 0.950 | 0.2 |
| 23.6 | 23.4 | 0.953 | −0.2 | |
| 100 | −24.2 | −23.9 | 0.935 | 0.2 |
| 24.8 | 24.6 | 0.947 | −0.2 | |
| 200 | −26.5 | −26.3 | 0.921 | 0.3 |
| 27.3 | 27.0 | 0.952 | −0.3 | |
| 29 | −23.4 | −23.3 | 0.906 | 0.1 |
| 23.2 | 23.0 | 0.963 | −0.2 | |
| 50 | −24.0 | −23.9 | 0.971 | 0.1 |
| 23.6 | 23.5 | 0.900 | −0.1 | |
| 100 | −24.9 | −24.7 | 0.916 | 0.2 |
| 25.3 | 25.2 | 0.920 | −0.2 | |
| 200 | −28.0 | −27.8 | 0.910 | 0.2 |
| 27.1 | 26.9 | 0.872 | −0.2 | |
| 18 MV, 10 × 10 | ||||
| 29 | −45.6 | −45.2 | 0.916 | 0.4 |
| 46.5 | 46.1 | 0.911 | −0.3 | |
| 50 | −46.5 | −46.2 | 0.908 | 0.3 |
| 47.4 | 47.0 | 0.926 | −0.4 | |
| 100 | −48.9 | −48.5 | 0.947 | 0.4 |
| 49.9 | 49.6 | 0.941 | −0.3 | |
| 200 | −53.8 | −53.4 | 0.921 | 0.5 |
| 54.8 | 54.4 | 0.937 | −0.4 | |
| 29 | −46.8 | −46.5 | 0.920 | 0.3 |
| 46.6 | 46.3 | 0.937 | −0.3 | |
| 50 | −47.9 | −47.7 | 0.912 | 0.2 |
| 47.5 | 47.3 | 0.912 | −0.2 | |
| 100 | −50.2 | −49.9 | 0.919 | 0.3 |
| 50.6 | 50.4 | 0.915 | −0.3 | |
| 200 | −55.8 | −55.4 | 0.912 | 0.3 |
| 54.9 | 54.6 | 0.899 | −0.3 | |
| 6 MV, 30 × 30 | ||||
| 16 | −136.6 | −136.0 | 0.989 | 0.5 |
| 137.1 | 136.5 | 0.991 | −0.5 | |
| 50 | −141.5 | −141.0 | 0.999 | 0.6 |
| 142.1 | 141.6 | 0.984 | −0.5 | |
| 100 | −148.9 | −148.4 | 0.975 | 0.5 |
| 149.5 | 149.0 | 0.969 | −0.5 | |
| 200 | −163.6 | −163.2 | 0.965 | 0.4 |
| 164.1 | 163.8 | 0.964 | −0.4 | |
| 16 | −138.0 | −137.6 | 0.996 | 0.4 |
| 137.8 | 137.3 | 0.974 | −0.5 | |
| 50 | −143.1 | −142.6 | 0.972 | 0.5 |
| 142.9 | 142.4 | 0.977 | −0.5 | |
| 100 | −150.6 | −150.1 | 0.992 | 0.5 |
| 151.0 | 150.5 | 0.999 | −0.4 | |
| 200 | −165.8 | −165.5 | 0.957 | 0.3 |
| 165.0 | 164.7 | 0.987 | −0.3 | |
| 18 MV, 30 × 30 | ||||
| 29 | −138.5 | −137.8 | 0.945 | 0.7 |
| 139.4 | 138.6 | 0.963 | −0.7 | |
| 50 | −141.5 | −140.8 | 0.917 | 0.7 |
| 142.5 | 141.8 | 0.982 | −0.7 | |
| 100 | −148.9 | −148.3 | 0.959 | 0.7 |
| 149.9 | 149.2 | 0.905 | −0.7 | |
| 200 | −163.5 | −163.0 | 0.908 | 0.5 |
| 164.5 | 164.1 | 0.944 | −0.4 | |
| 29 | −140.3 | −139.6 | 0.961 | 0.7 |
| 139.8 | 139.1 | 0.959 | −0.7 | |
| 50 | −143.4 | −142.9 | 0.930 | 0.5 |
| 143.0 | 142.4 | 0.927 | −0.7 | |
| 100 | −150.7 | −150.1 | 0.951 | 0.5 |
| 151.1 | 150.5 | 0.965 | −0.6 | |
| 200 | −166.0 | −165.6 | 0.964 | 0.4 |
| 165.1 | 164.7 | 0.939 | −0.4 | |
Figure 6.
Comparison of inflection points and points of 50% intensity for square field of side 30 cm for depth 2.9 and 20.0 cm of 18 MV photons, measured data, SSD = 90.0 cm
Practical examples
The above-described method was applied for off-axis open fields, measured on the Elekta linac (Tab. 2). These profiles were normalized to 100% for maximum dose points, but the positions of inflection points are independent of the way of profile normalization. The designation of points was similar to the open symmetric fields. As a characteristic parameter, the difference between abscissas of inflection points for a single beam profile was calculated. It was done for the asymmetric side of 10 × 2 cm2, two sides of the asymmetric field 5 × 5 cm2, both for 6 MV. Obtained results were compared with the nominal field size, calculated for given depth (D parameter in Table 2) and with differences between measured and nominal field sizes for open symmetric fields acquired in the same measuring series (D1 parameter in Table 2).
Table 2.
Results obtained for off-axis beams. C — values calculated from Gaussian fitting, R2 — coefficient of determination, delta — difference between profile points of inflection and nominal field size for given depth, delta1 – differences for open symmetrical fields between theoretical beam size and measurement from the same measurement series
| Depth [mm] |
C [mm] |
R2 | Field size calculated [mm] |
Δ [mm] |
Δ1 [mm] |
|---|---|---|---|---|---|
| 6 MV, X1 = −100, X2 = 0, Y1 = −10, Y2 = 10, O | |||||
| 16 | −91.1 | 0.959 | 90.8 | 0.8 | 0.5 |
| −0.2 | 0.977 | ||||
| 50 | −94.4 | 0.983 | 94.1 | 0.9 | 0.8 |
| −0.2 | 0.980 | ||||
| 100 | −99.4 | 0.993 | 99.1 | 0.9 | 0.7 |
| −0.2 | 0.976 | ||||
| 200 | −109.6 | 0.967 | 109.3 | 0.7 | 0.9 |
| −0.2 | 0.969 | ||||
| 6 MV, X1 = 0, X2 = 50, Y1 = −50, Y2 = 0, O | |||||
| 16 | 0.8 | 0.989 | 44.8 | 1.0 | 1.0 |
| 45.6 | 0.986 | ||||
| 50 | 0.8 | 0.955 | 46.4 | 1.1 | 1.0 |
| 47.2 | 0.996 | ||||
| 100 | 0.8 | 0.979 | 48.8 | 1.2 | 0.9 |
| 49.6 | 0.970 | ||||
| 200 | 0.8 | 0.967 | 53.7 | 1.3 | 0.9 |
| 54.5 | 0.962 | ||||
| 16 | −45.9 | 0.976 | 45.5 | 0.3 | 0.0 |
| −0.4 | 0.966 | ||||
| 50 | −47.6 | 0.992 | 47.1 | 0.4 | 0.0 |
| −0.5 | 0.976 | ||||
| 100 | −50.1 | 0.981 | 49.7 | 0.3 | −0.3 |
| −0.4 | 0.979 | ||||
| 200 | −55.1 | 0.994 | 54.6 | 0.4 | −0.2 |
| −0.5 | 0.995 | ||||
A similar comparison was made for a few wedged fields of the Elekta linac. The nominal field size was compared with the distance between abscissas of inflection points (calculated by Gaussian fitting). Examples of obtained results are shown in Table 3. Presented calculations were carried out for two square fields 10 × 10 cm2 for 6 and 18 MV and rectangular field 20 × 5 cm2 for 18 MV. The delta parameter is the difference between the above-defined inflection points distance and the nominal field size, recalculated to the given depth. All obtained results were smaller than 0.5 mm.
Table 3.
Results for wedged fields. C — calculated positions of inflection points using Gaussian fitting, delta — difference obtained for distance between calculated nominal field size and inflection points
| Depth [mm] |
C [mm] |
R2 | Field size calculated [mm] |
Δ [mm] |
|---|---|---|---|---|
| 6 MV, 10 × 10 | ||||
| 16 | −45.8 | 0.994 | 91.8 | −0.2 |
| 46.0 | 0.993 | |||
| 50 | −47.6 | 1.000 | 95.2 | −0.2 |
| 47.7 | 0.993 | |||
| 100 | −50.2 | 0.998 | 100.3 | −0.3 |
| 50.1 | 0.980 | |||
| 200 | −55.3 | 0.987 | 110.4 | −0.4 |
| 55.0 | 0.986 | |||
| 18 MV, 20 × 5 | ||||
| 16 | −92.9 | 0.995 | 186.2 | −0.4 |
| 93.2 | 0.989 | |||
| 50 | −95.0 | 0.983 | 190.3 | −0.3 |
| 95.3 | 0.902 | |||
| 100 | −99.9 | 0.977 | 200.3 | −0.3 |
| 100.4 | 0.938 | |||
| 200 | −110.1 | 0.990 | 220.6 | −0.6 |
| 110.5 | 0.956 | |||
| 18 MV, 10 × 10 | ||||
| 16 | −46.7 | 0.971 | 93.2 | −0.3 |
| 46.5 | 0.985 | |||
| 50 | −47.7 | 0.975 | 95.3 | −0.3 |
| 47.5 | 0.934 | |||
| 100 | −50.5 | 0.998 | 100.4 | −0.4 |
| 49.9 | 0.944 | |||
| 200 | −55.6 | 0.975 | 110.4 | −0.4 |
| 54.8 | 0.947 | |||
The method for FFF Varian TrueBeam® profiles was applied. The same procedure as for wedged fields was used for this case. A similar application of the inflection points for the commissioning purposes had been reported [16, 17]. Our results are given in Table 4. It was impossible to compare these results with the symmetrical open field, because of the lack of measurements from the same series. Despite this, all errors were smaller than 1.0 millimeters, and for the most extensive field, the obtained error was smaller than 0.5 mm.
Table 4.
Results obtained from calculation of inflection points applied to FFF beams. Delta — difference calculated for distance between nominal field size and inflection points
| Depth [mm] |
C [mm] |
R2 | Field size calculated [mm] |
Δ [mm] |
|---|---|---|---|---|
| 10 MV, 4 × 4 | ||||
| 23 | −20.1 | 0.975 | 40.2 | 0.7 |
| 20.1 | 0.975 | |||
| 50 | −20.7 | 0.933 | 41.3 | 0.7 |
| 20.7 | 0.933 | |||
| 100 | −21.7 | 0.959 | 43.4 | 0.6 |
| 21.7 | 0.959 | |||
| 200 | −23.7 | 0.935 | 47.4 | 0.6 |
| 23.7 | 0.935 | |||
| 10 MV, 10 × 10 | ||||
| 23 | −50.9 | 0.986 | 101.8 | 0.5 |
| 50.9 | 0.986 | |||
| 50 | −52.2 | 0.947 | 104.5 | 0.5 |
| 52.2 | 0.947 | |||
| 100 | −54.7 | 0.952 | 109.4 | 0.6 |
| 54.7 | 0.952 | |||
| 200 | −59.7 | 0.943 | 119.4 | 0.6 |
| 59.7 | 0.943 | |||
| 10 MV, 30 × 30 | ||||
| 23 | −153.5 | 0.989 | 307.1 | −0.2 |
| 153.5 | 0.979 | |||
| 50 | −157.6 | 0.967 | 315.2 | −0.2 |
| 157.6 | 0.967 | |||
| 100 | −165.1 | 0.991 | 330.3 | −0.3 |
| 165.1 | 0.991 | |||
| 200 | −180.2 | 0.991 | 360.4 | −0.4 |
| 180.2 | 0.991 | |||
Discussion
Method validation
The obtained results, given in Table 1, show the differences between field size defined by 50% intensity and by inflection one-millimeter points. The values are smaller than 1.0 mm, and the biggest difference was observed for the largest 18 MV field. The difference was 0.7 mm for a few profile depths. For the same field size in the case of 6 MV beam, the maximal difference was 0.6 mm for the 50 mm profile depth. All of the other comparisons showed 0.5 mm or smaller difference. On the other hand, the one-millimeter distance is the standard resolution of the numerical comparisons we made. Therefore, the gradient method for deriving the inflection points and treating them as characteristic profile points was used for the comparison process.
The positions of 50% intensity points are independent of the profile shape, and the profile shape does not have to be concave or convex in its near-axis region because of on-axis normalization to 100%. Positions of inflection points depend on the near-edge region of the beam profile, because of their origin from the profile curve’s mathematical description. The background level’s influence was also investigated, and the obtained results were the same for the inflection points.
Practical examples
The method was applied for off-axis beams (Table 2), wedged beams (Table 3) and FFF beams (Tab. 4). The maximal difference was 1.0 mm and was observed only for two comparisons for off-axis fields. It is hard to say what is the real reason of these differences. It could be a proper value for a field different than open symmetric one. On the other hand, it could be caused by one of the mechanical or physical factors. Another possible explanation is the imprecision of the linac’s jaws positioning. For the wedged fields, the X-ray attenuation may change the properties of the field edge. As a support of the above hypothesis, all differences (Δ column in Table 3) are negative. For non-wedged fields, the differences have both positive and negative signs.
The main algorithm for off-axis and wedged beam profiles comparison remained similar to the case of open symmetrical fields [12]: normalization (to 100% for the point of maximum dose), computing the inflection points, designating differences between their abscissas and nominal field sizes for theoretical beam, centering and renormalization to nominal sizes and, finally, finding the boundary between regions of high and low gradient. Technical details of the comparison process are presented in [12].
Conclusions
The described method allows characteristic points to be designed based on the beam profile’s high dose region. These points are convenient for commissioning and regular use in periodic QA tests. Points of the curve inflection are independent of profile normalization and can be used to compare off-axis, wedged, and FFF beams. The comparison between measured and calculated off-axis and wedged fields and the inflection points, as the characteristic profile points, could be applied using a procedure similar to open symmetric fields. The whole comparison process was relatively straightforward using dedicated software, which allowed to quickly find the inflection points (Gaussian fitting), boundaries between high and low gradient and other above-described steps (centering and renormalizing). It does not matter which point is chosen for comparison. In some cases, the inflection point is just more convenient for the comparison of the dose profiles.
Acknowledgements
To Tadeusz Jedynak for sharing his software (alfard.5v.pl).
Footnotes
Conflicts of interests
K.Ś. acts as Scientific Consultant to Varian Medical Systems Poland. All other co-authors have no conflicts of interest.
Funding
None declared.
References
- 1.Ling C, Zhang P, Archambault Y, et al. Commissioning and Quality Assurance of RapidArc Radiotherapy Delivery System. Int J Radiat Oncol Biol Phys. 2008;72(2):575–581. doi: 10.1016/j.ijrobp.2008.05.060. [DOI] [PubMed] [Google Scholar]
- 2.Dyk J, Barnett RB, Cygler JE, et al. Commissioning and quality assurance of treatment planning computers. Int J Radiat Oncol Biol Phys. 1993;26(2):261–273. doi: 10.1016/0360-3016(93)90206-b. [DOI] [PubMed] [Google Scholar]
- 3.Bedford JL, Childs PJ, Nordmark Ha, et al. Commissioning and quality assurance of the Pinnacle radiotherapy treatment planning system for external beam photons. Br J Radiol. 2003;76(903):163–176. doi: 10.1259/bjr/42085182. [DOI] [PubMed] [Google Scholar]
- 4.Deng J, Ma CM, Hai J, et al. Commissioning 6 MV photon beams of a stereotactic radiosurgery system for Monte Carlo treatment planning. Med Phys. 2003;30(12):3124–3134. doi: 10.1118/1.1624753. [DOI] [PubMed] [Google Scholar]
- 5.Xing L, Curran B, Hill R, et al. Dosimetric verification of a commercial inverse treatment planning system. Phys Med Biol. 1999;44(2):463–478. doi: 10.1088/0031-9155/44/2/013. [DOI] [PubMed] [Google Scholar]
- 6.Özgüven Y, Yaray K, Alkaya F, et al. An institutional experience of quality assurance of a treatment planning system on photon beam. Rep Prac Oncol Radiother. 2014;19(3):195–205. doi: 10.1016/j.rpor.2013.10.008.. [DOI] [PMC free article] [PubMed] [Google Scholar]
- 7.Commissioning and Quality Assurance of Computerized Planning Systems for Radiation Treatment of Cancer. IAEA; Vienna: 2004. (Technical Reports Series no 430). [Google Scholar]
- 8.Commissioning of Radiotherapy Treatment Planning Systems: Testing for Typical External Beam Treatment Techniques; IAEA TECDOC — 1583; Vienna. 2008. [Google Scholar]
- 9.Rutonjski L, Petrović B, Baucal M, et al. Dosimetric verification of radiotherapy treatment planning systems in Serbia: national audit. Radiat Oncol. 2012;7:155. doi: 10.1186/1748-717X-7-155. [DOI] [PMC free article] [PubMed] [Google Scholar]
- 10.Lopes M, Ca AJK, Madureira LG, et al. Treatment planning systems dosimetry auditing project in Portugal. Phys Med. 2014;30(1):96–103. doi: 10.1016/j.ejmp.2013.03.008. [DOI] [PubMed] [Google Scholar]
- 11.Gershkevitsh E, Pesznyak C, Petrovic B, et al. Dosimetric inter-institutional comparison in European radiotherapy centres: Results of IAEA supported treatment planning system audit. Acta Oncol. 2014;53(5):628–636. doi: 10.3109/0284186X.2013.840742. [DOI] [PubMed] [Google Scholar]
- 12.Wendykier J, Bieniasiewicz M, Grządziel A, et al. Determination of boundaries between ranges of high and low gradient of beam profile. Rep Pract Oncol Radiother. 2016;21(3):168–173. doi: 10.1016/j.rpor.2015.12.007. [DOI] [PMC free article] [PubMed] [Google Scholar]
- 13.Eclipse Photon and Electron Algorithms Reference Guide, P1008611-002-B. Varian Medical Systems; 2014. [Google Scholar]
- 14.Mitchell R, Madey R. Least-square fitting of a Gaussian function and evaluation of the errors of the coefficients radiation laboratory. University of California; Berkeley: 1954. [Google Scholar]
- 15.Mańczak K. Experiment Design Techniques (Polish version). Wydawnicta Naukowo-Techniczne, Warszawa. Warsaw: 1979. [Google Scholar]
- 16.Poenisch F, Titt U, Vassiliev O, et al. SU-FF-T-371: Properties of Unflattened Photon Beams Shaped by a Multi Leaf Collimator. Med Phys. 2006;33(6):1738–1746. doi: 10.1118/1.2241289.. [DOI] [PubMed] [Google Scholar]
- 17.Hrbacek J, Lang S, Kloeck S. Commissioning of photon beams of a flattering filter-free linear accelerator and the accuracy of beam modeling using the anisotropic analytical algorithm. Int J Radiat Oncol Biol Phys. 2011;80(4):1228–1237. doi: 10.1016/j.ijrobp.2010.09.050. [DOI] [PubMed] [Google Scholar]


