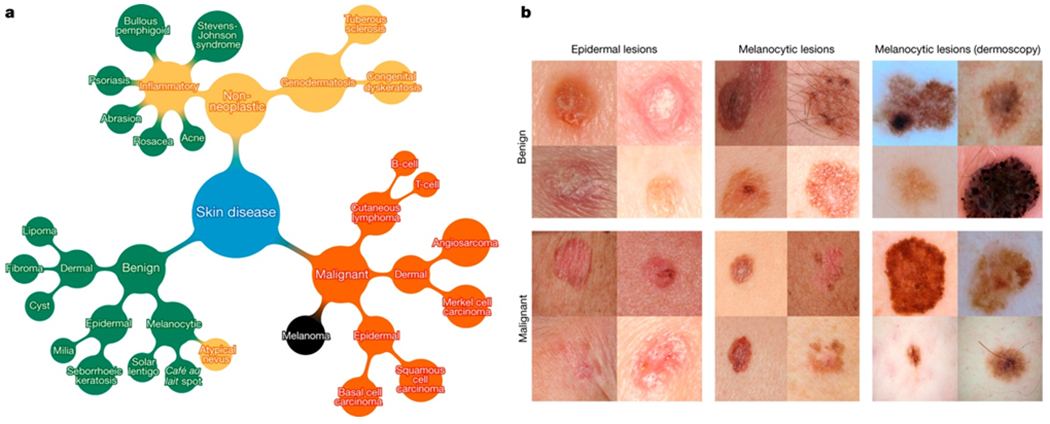
Figure 2 |. A schematic illustration of the taxonomy and example test set images.

a, A subset of the top of the tree-structured taxonomy of skin disease. The full taxonomy contains 2,032 diseases and is organized based on visual and clinical similarity of diseases. Red indicates malignant, green indicates benign, and orange indicates conditions that can be either. Black indicates melanoma. The first two levels of the taxonomy are used in validation. Testing is restricted to the tasks of b. b, Malignant and benign example images from two disease classes. These test images highlight the difficulty of malignant versus benign discernment for the three medically critical classification tasks we consider: epidermal lesions, melanocytic lesions and melanocytic lesions visualized with a dermoscope. Example images reprinted with permission from the Edinburgh Dermofit Library (https://licensing.eri.ed.ac.uk/i/software/dermofit-image-library.html).
