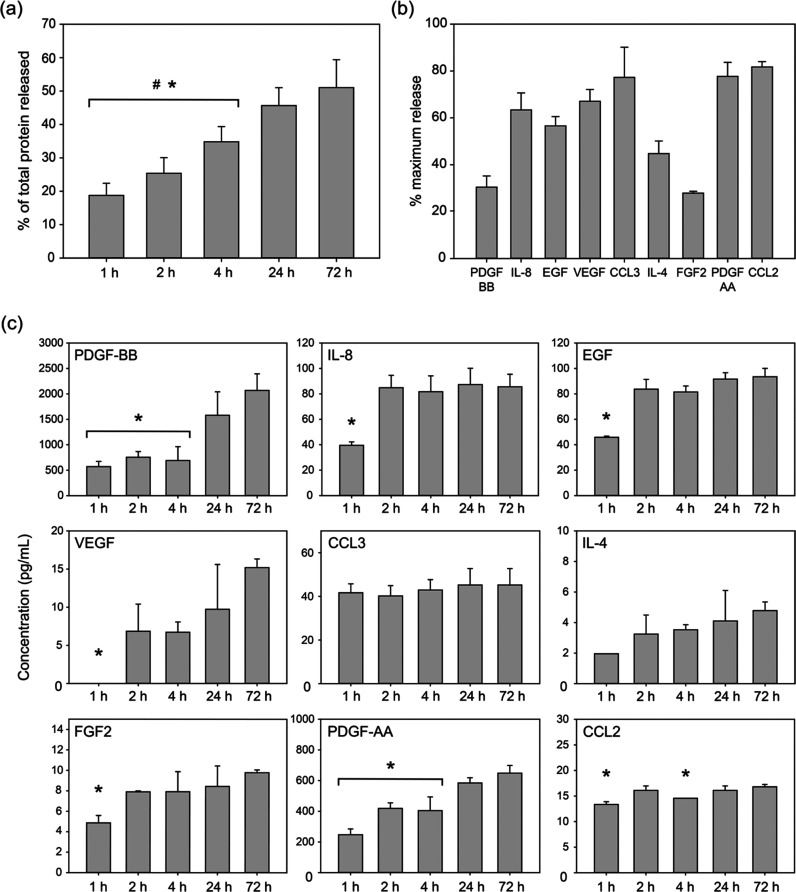
Figure 2.
Protein and GF release profiles from PL-loaded PEG hydrogels. All analytes were measured at 1, 2, 4, 24, and 72 h. All data sets are plotted as mean ± SD. (a) Total protein released from PL-loaded PEG hydrogels over the course of 72 h. (n = 6). (b) Percentage of GFs released from PL-PEG hydrogels at 72 h (n = 3). (c) Concentrations of analytes of interest over the course of 72 h (n = 3). # indicates significance compared to samples at 24 h, and * indicates significance compared to samples at 72 h (p ≤ 0.05).

