

Summary
Cells communicate with their environment via surface proteins and secreted factors. Unconventional protein secretion (UPS) is an evolutionarily conserved process, via which distinct cargo proteins are secreted upon stress. Most UPS types depend upon the Golgi-associated GRASP55 protein. However, its regulation and biological role remain poorly understood. Here, we show that the mechanistic target of rapamycin complex 1 (mTORC1) directly phosphorylates GRASP55 to maintain its Golgi localization, thus revealing a physiological role for mTORC1 at this organelle. Stimuli that inhibit mTORC1 cause GRASP55 dephosphorylation and relocalization to UPS compartments. Through multiple, unbiased, proteomic analyses, we identify numerous cargoes that follow this unconventional secretory route to reshape the cellular secretome and surfactome. Using MMP2 secretion as a proxy for UPS, we provide important insights on its regulation and physiological role. Collectively, our findings reveal the mTORC1-GRASP55 signaling hub as the integration point in stress signaling upstream of UPS and as a key coordinator of the cellular adaptation to stress.
Keywords: mTORC1, Tuberous Sclerosis Complex (TSC), unconventional protein secretion (UPS), GRASP55, GORASP2, cellular stress response, Golgi, Rapamycin, ECM, MMP2
Graphical abstract
Highlights
-
•
mTORC1 phosphorylates GRASP55 directly at the Golgi in non-stressed cells
-
•
mTORC1 inactivation by stress leads to GRASP55 dephosphorylation and relocalization
-
•
GRASP55 relocalization to autophagosomes and MVBs drives UPS of selected cargo
-
•
mTORC1-GRASP55 link cellular stress to changes in the extracellular proteome via UPS
Cells adapt to stress stimuli by qualitatively and quantitatively reshaping their extracellular proteome. Nüchel et al. highlight the biological role of unconventional protein secretion (UPS) and reveal TSC-mTORC1-GRASP55 as a key signaling pathway in this process, thus linking physiological stress signaling and nutrient sensing to the cellular stress response.
Introduction
Cells interact with their environment in a reciprocal manner via proteins on their surface or secreted factors. On one hand, stimuli from the cellular milieu regulate the activity of signaling pathways to influence cellular physiology. On the other hand, cells respond to intra- and extracellular cues by modifying the set of proteins that are actively transported to their surface or secreted into the extracellular space. These proteins mediate key cellular functions, such as signaling, intercellular communication, adhesion, migration, and survival (Farhan and Rabouille, 2011).
The mechanistic target of rapamycin complex 1 (mTORC1) functions as a cellular sensor for virtually all intra- and extracellular stimuli to control the vast majority of cellular processes, including growth, metabolism, and autophagy (González and Hall, 2017; Kennedy and Lamming, 2016; Liu and Sabatini, 2020; Rabanal-Ruiz and Korolchuk, 2018). The main upstream negative regulator of mTORC1 is the heterotrimeric tuberous sclerosis complex (TSC), composed of the TSC2, TSC1, and TBC1D7 proteins (Dibble et al., 2012; Inoki et al., 2003a; Tee et al., 2003). Nearly all stimuli that regulate mTORC1, including amino acids (AAs), signal at least in part via the TSC (Carroll et al., 2016; Demetriades et al., 2014, 2016; Plescher et al., 2015; Valvezan and Manning, 2019). Therefore, the TSC/mTORC1 signaling hub functions as an integration point for cellular stress signaling and coordinates the cellular stress response (Brugarolas et al., 2004; Choo et al., 2010; Demetriades et al., 2014, 2016; DeYoung et al., 2008; Inoki et al., 2003b).
Unconventional protein secretion (UPS) is an evolutionarily conserved alternative route, via which a number of cargo proteins are transported to the plasma membrane or the extracellular matrix (ECM) in response to cellular stress (reviewed in Rabouille, 2017). These proteins do not—or only partially—depend on the classical bulk secretion pathway and include mitogens, cytokines, and other factors that play important roles in cancer, inflammation, and angiogenesis (Cleyrat et al., 2014; Dupont et al., 2011; Son et al., 2016; Zhang et al., 2015). Based on the underlying mechanisms of cargo selection and delivery, four distinct UPS types (designated I–IV) have been described in eukaryotic cells to date, one of which (type II) is yeast specific (Dimou and Nickel, 2018; Rabouille, 2017). At the molecular level, the Golgi re-assembly and stacking protein 55 (GRASP55; also referred to as GORASP2) is a crucial mediator of type III and type IV UPS (Ahat et al., 2019; Giuliani et al., 2011). GRASP55 and the closely related GRASP65 were identified as important players in the assembly and membrane stacking of the Golgi, as well as in maintaining the overall Golgi structure (Barr et al., 1997; Grond et al., 2020; Jarvela and Linstedt, 2014; Shorter et al., 1999; Truschel et al., 2012; Zhang and Wang, 2016); however, their involvement in Golgi stacking has been challenged by more recent studies (Grond et al., 2020; Zhang and Seemann, 2021). The N-terminal 212-AA residues of GRASP55 are highly homologous to those of GRASP65, whereas the C-terminal 240 AAs differ substantially between the two proteins (Shorter et al., 1999). The conserved region is known as the GRASP domain and contains two PDZ domains, whereas the C-terminal part is called the serine-proline rich (SPR) region and contains multiple putative phosphorylation sites (Zhang and Wang, 2016), raising the possibility that GRASP55 function may be regulated by upstream signaling cues. Indeed, previous work from our group and others suggested that GRASP55 facilitates the unconventional secretion of distinct cargo proteins, and this may involve its post-translational modification (PTM) and redistribution to other organelles, such as autophagosomes (Kim et al., 2016; Nüchel et al., 2018; Zhang et al., 2018). The identity of the few proteins that have been shown so far to be secreted via UPS highlights it as an emerging crucial physiological process with potential implications to human disease (e.g., cystic fibrosis) (Gee et al., 2011; Kim et al., 2016). Importantly, however, several key aspects of its regulation and its biological significance remain poorly understood (Giuliani et al., 2011).
Here, we identify UPS as a cellular function regulated by mTORC1. Furthermore, we establish GRASP55 as a downstream effector of mTORC1 signaling and a key factor that links mTORC1 activity and UPS, thereby controlling the cellular adaptation to stress stimuli. Mechanistically, we show that mTORC1 directly phosphorylates GRASP55 at its C-terminal SPR region to regulate its localization in cells. Downregulation of mTORC1 activity by a variety of cellular stresses, pharmacological inhibitors, or genetic perturbations drives the relocalization of GRASP55 from the Golgi surface to autophagosomes and multivesicular bodies (MVBs) to stimulate UPS. In cells lacking proper TSC function, which maintain active mTORC1 even under stress conditions, the aforementioned GRASP55 response is blunted. Using proximity-based biotinylation assays, we identify novel GRASP55 interaction partners and proximal proteins, both at the Golgi and non-Golgi organelles, and reveal how mTORC1 activity modifies the proximal GRASP55 interactome (hereafter referred to as “proximome”; Valerius et al., 2019). Importantly, by SILAC-based proteomic analyses, we provide an unbiased, comprehensive description of the GRASP55-dependent secretome and surfactome, revealing numerous, previously unknown, secretory cargoes that depend on these unconventional pathways for their delivery to the extracellular space or the cell surface, respectively. Focusing on selected cargo proteins, such as MMP2 (matrix metallopeptidase 2), we reveal an important role for the mTORC1-GRASP55 signaling axis on ECM degradation, a crucial process for tumor growth and metastasis, and in reshaping the extracellular proteome. Because we show UPS is dysregulated in cells with aberrant mTORC1 activity, our work raises the plausible hypothesis that UPS may be contributing to the pathology of various mTOR-opathies, such as TSC, setting the ground for future studies in this direction.
Results
mTORC1 regulates GRASP55 phosphorylation and localization
UPS is part of the cellular stress response and may involve PTM-dependent changes in the subcellular localization of GRASP55. The growth-related protein kinase mTOR, as part of mTORC1, is a key regulator of nearly all cellular processes in response to intra- and extra-cellular cues. We thus investigated whether stimuli that influence mTORC1 activity also affect GRASP55 phosphorylation and subcellular localization, as a proxy for the activation of UPS, in WI-26 human diploid fibroblasts. In Phos-tag gels, GRASP55 protein migrates as a doublet, with the upper band representing a phosphorylated form (Lane 1 in Figures 1A and S1A). Interestingly, physiological (growth factor deprivation, −FBS; AA starvation, −AA) or pharmacological (rapamycin; Torin1) inhibition of mTOR correlated with a profound dephosphorylation of GRASP55 without affecting its protein levels (Figures 1A, 1B, S1A, and S1B). In contrast, phosphorylation of the closely related GRASP65 protein was not affected by AA starvation or rapamycin (Figure S1A), showing that the effect of mTORC1 inhibition is specific for GRASP55. Because some of these stimuli (e.g., AA starvation, short-term rapamycin treatment) downregulate specifically mTORC1—as demonstrated by reduced phosphorylation of the ribosomal protein S6 (RpS6, hereafter S6) and increased electrophoretic mobility of 4E-BP1 (eukaryotic initiation factor 4E-binding protein 1)—but not mTORC2 (see Akt [Ser473] phosphorylation; Figure 1A), these data suggest that GRASP55 phosphorylation is regulated downstream of mTORC1. Indeed, transient knockdown of mTOR itself or of the mTORC1-specific component RAPTOR led to a significant drop in GRASP55 phosphorylation, whereas knockdown of the mTORC2-specific component RICTOR did not have an effect (Figures S1C and S1D). The S6 kinase (S6K) is a direct target and a downstream effector of mTORC1. Unlike mTORC1 inhibition, pharmacological inhibition of S6K (S6Ki) (Pearce et al., 2010) had no effect on GRASP55 phosphorylation (Figure 1A, lane 5), further supporting that its regulation takes place at the level of mTORC1.
Figure 1.

mTORC1 activity regulates GRASP55 phosphorylation and localization
(A and Β) Immunoblots with lysates from WI-26 cells treated with media or inhibitors as shown, using indicated antibodies. GRASP55 phosphorylation analyzed with Phos-tag gels. Asterisk indicates p-GRASP55. Quantification of GRASP55 phosphorylation is shown in (B).
(C–H) Colocalization analysis of GRASP55 with GM130 (Golgi) (C and D), LC3B (autophagosomes) (E and F), and CHMP2A (MVBs) (G and H) in WI-26 cells. Quantification of colocalization is shown in (D), (F), and (H). Scale bars: 10 μm.
(I–L) Same as in (C)–(H), but using immuno-EM for GRASP55 (10 nm gold) and the Golgi 58K protein, LC3B, or CHMP2A (5 nm gold) (I). Scale bars: 200 nm. Quantification of gold particles for GRASP55 and markers shown per Golgi stack (J), autophagosome (K), or MVB (L).
Data in graphs shown as mean ± SD. ∗p < 0.05, ∗∗∗p < 0.005. See also Figures S1–S3.
In basal (stress-free, nutrient-replete) cell culture conditions, when mTORC1 is active, endogenous GRASP55 demonstrated a clear localization at the Golgi, colocalizing with the Golgi marker GM130 in immunofluorescence (IF)/confocal microscopy experiments (Figure 1B). Strikingly, mTORC1 inhibition using rapamycin decreased GRASP55 localization at the Golgi (Figures 1C and 1D) and markedly increased its colocalization with LC3B-positive autophagosomal structures (Figures 1E and 1F) and CHMP2A-positive MVBs (Figures 1G and 1H). The relocalization of GRASP55 from the Golgi to autophagosomes and MVBs in response to rapamycin was further verified at the ultrastructural level, using immuno-gold electron microscopy (immuno-EM) (Figures 1I–1L). Consistent with our GRASP55 phosphorylation data, GRASP55 localization was affected by knockdown of mTOR or RAPTOR, but not RICTOR (Figures S1E–S1J). Moreover, any stimulus that downregulates mTORC1 (growth factor deprivation, AA starvation, rapamycin, Torin), but not S6K inhibition, relocalized GRASP55 from the Golgi (Figures S2A and S2D) to autophagosomes (Figures S2B and S2E) and MVBs (Figures S2C and S2F). Importantly, this effect is specific for GRASP55, as the localization of the closely related GRASP65 protein was not affected by rapamycin in wild-type (WT) (Figure S2G) or GRASP55 knockout (KO) cells (Figures S2H and S2I). Similar to our observations in WI-26 cells, mTORC1 inhibition led to the dephosphorylation and subcellular relocalization of GRASP55 also in the osteosarcoma Saos-2 cell line (Figures S3A and S3B) and in human foreskin fibroblasts (HFF-1) (Figures S3C and S3D), underscoring that this mechanism is not cell-type specific. Moreover, GRASP55 phosphorylation and protein levels were unaffected in cells treated with bafilomycin A1 (BafA1), where degradative autophagic flux is blocked (Figures S3A and S3C). Taken together, these data show that the phosphorylation and relocalization of GRASP55 from the Golgi to cellular compartments that participate in unconventional secretion processes, such as secretory autophagosomes and MVBs, depend on mTORC1 and respond to stimuli that regulate its activity.
TSC loss and aberrant mTORC1 activation prevent dephosphorylation and relocalization of GRASP55 upon stress
The heterotrimeric TSC protein complex is the main negative regulator of mTORC1, integrating information from the majority of upstream stimuli that influence mTORC1 activity. Consequently, TSC-null cells maintain active mTORC1 even under AA starvation or other stress conditions (Brugarolas et al., 2004; Choo et al., 2010; Demetriades et al., 2014, 2016; DeYoung et al., 2008; Inoki et al., 2003b). To test if the TSC affects GRASP55 phosphorylation and subcellular localization, we generated TSC2 KO WI-26 cells (Figures 2A and S4A). Whereas AA starvation readily caused dephosphorylation of GRASP55 in WT cells, its phosphorylation was largely unaffected by this nutrient stress in TSC2 KO cells (Figures 2A, 2B, S4B, and S4C). Beyond AA starvation, energetic stress (by inhibiting glycolysis with 2-DG in low-glucose media), hyperosmotic stress (by increasing the osmolality of the culture media with NaCl), or hypoxia (by culturing the cells in 1% O2) also inactivated mTORC1 and caused GRASP55 dephosphorylation in WT, but not in TSC2 KO, cells (Figures S4B and S4C), further supporting that GRASP55 phosphorylation depends on mTORC1 activity. Unlike the other stress signals, rapamycin, a mTORC1 inhibitor that functions downstream of the TSC, induced GRASP55 dephosphorylation in both WT and TSC2 KO cells (Figures 2A, 2B, S4B, and S4C).
Figure 2.

Aberrant mTORC1 activation in TSC2 KO cells prevents dephosphorylation and relocalization of GRASP55 upon stress
(A and B) Immunoblots with lysates from WT or TSC2 KO WI-26 cells treated with −AA medium or rapamycin (Rapa) using the indicated antibodies. GRASP55 phosphorylation analyzed with Phos-tag gels. Asterisk indicates p-GRASP55. Quantification of GRASP55 phosphorylation is shown in (B).
(C–H) Colocalization analysis of GRASP55 with the GM130 (C), LC3B (E), and CHMP2A (G) organelle markers in WT and TSC2 KO WI-26 cells, treated as in (A). Quantification of colocalization is shown in (D), (F), and (H). Scale bars: 5 μm.
Data in graphs shown as mean ± SD. ∗p < 0.05, ∗∗∗p < 0.005. See also Figure S4.
In line with our data on GRASP55 phosphorylation, AA starvation, energetic stress, hyperosmotic stress, or hypoxia, even when applied singly to cells, decreased the association of GRASP55 with the Golgi (Figures 2C, 2D, S4D, and S4G) while increasing GRASP55 localization to autophagosomes (Figures 2E, 2F, S4E, and S4H) and MVBs (Figures 2G, 2H, S4F, and S4I) in control cells, but not in cells lacking TSC2. Unlike the other stress stimuli that signal to mTORC1 via the TSC, rapamycin induced relocalization of GRASP55 from the Golgi to autophagosomes and MVBs in both WT and TSC2-null cells (Figures 2C–2H and S4D–S4I). These data show that GRASP55 phosphorylation and subcellular localization are regulated downstream of the TSC-mTORC1 signaling axis in response to multiple stress stimuli, and this response is dysregulated in cells that lack proper TSC function.
GRASP55 is phosphorylated directly by mTOR at residues in its SPR region
The inactivation of mTORC1 in response to AA starvation is a rapid and reversible process (Carroll et al., 2016; Demetriades et al., 2014; Hara et al., 1998). Phosphorylation of downstream substrates, such as S6 and 4E-BP1, dramatically drops in response to specific removal of AA for 1–2 h, whereas it rapidly and gradually recovers within 10–60 min upon re-stimulation with AA-replete media (Figures 3A and 3B). Interestingly, the phosphorylation kinetics of GRASP55 followed closely those of S6 and 4E-BP1 (Figure 3A), raising the intriguing hypothesis that GRASP55 may be a direct mTORC1 target. Indeed, in vitro kinase assays, using bacterially expressed GST-GRASP55 (or GST-4E-BP1 as a positive control) and immunopurified mTORC1, confirmed that GRASP55 can be phosphorylated directly and specifically by mTOR, as this phosphorylation was abolished when Torin1 was added to the reaction (Figure 3C). Furthermore, immuno-EM studies revealed a strong colocalization of mTOR and GRASP55 at the Golgi in non-stressed cells, suggesting that a Golgi-based mTORC1 pool phosphorylates GRASP55 directly at this subcellular location (Figure 3D).
Figure 3.

Direct GRASP55 phosphorylation by mTOR at the Golgi controls its localization
(A and B) Immunoblots from WI-26 cells cultured in AA-containing media (+AA), treated with AA-starvation media (−AA), or first starved for 2 h and then re-supplemented with +AA media (AA readdition) using the indicated antibodies. GRASP55 phosphorylation analyzed with Phos-tag gels. Asterisk indicates p-GRASP55. Quantification of GRASP55 phosphorylation is shown in (B).
(C) In vitro mTORC1 kinase assay with GST-GRASP55, GST-4E-BP1 (positive control), or GST (negative control) ± Torin. Substrate phosphorylation detected by autoradiography. Equal loading shown by Coomassie staining. Number sign (#) indicates immunoglobulin G (IgG) bands.
(D) Immuno-EM for endogenous GRASP55 (10-nm gold particles) and mTOR (5-nm gold particles) in WI-26 cells showing colocalization at the Golgi. Scale bar: 200 nm.
(E) Phosphorylation of GRASP55 (55), GRASP65 (65) and chimeric proteins (55–65, 65–55) analyzed with Phos-tag gels in reconstituted GRASP55 KO WI-26 cells ± Rapa. Asterisks indicate phosphorylated proteins. Total protein levels analyzed by immunoblotting as indicated.
(F and G) Phosphorylation of WT or mutant GRASP55 (5TA, T264A) analyzed with Phos-tag gels in reconstituted GRASP55 KO WI-26 cells ± Rapa. Asterisk indicates p-GRASP55 (G). Schematic representation of GRASP55 showing the residues mutated in 5TA is shown in (F).
(H and I) As in (G), but for GRASP55 colocalization with GM130 and LC3B.
Data in (B) are shown as mean ± SD. ∗p < 0.05, ∗∗∗p < 0.005. See also Figure S5.
Unlike GRASP55, GRASP65 is not dephosphorylated (Figure S1A) and not dissociating from the Golgi (Figures S2G and S2I) when mTORC1 is inhibited. Thus, we took advantage of this differential behavior of the two closely related proteins to study further the properties of GRASP55 relocalization and to investigate the domains needed for its regulation by mTORC1. To achieve this, we generated GRASP55-65 and GRASP65-55 chimeric expression constructs by combining the N-terminal GRASP55 PDZ domains with the C-terminal GRASP65 SPR region, and vice versa (Figure S5A), and expressed them in GRASP55 KO cells. Phosphorylation of both GRASP55 and GRASP65 WT proteins, when expressed exogenously, recapitulated the phosphorylation dynamics of endogenous proteins: whereas GRASP55 phosphorylation disappeared in rapamycin-treated cells, the phosphorylation of GRASP65 was unaffected by rapamycin (Figure 3E), showing that it does not depend on mTORC1. Interestingly, phosphorylation (Figure 3E) and subcellular localization (Figures S5B–S5D) of the GRASP65-55 chimera resembled that of WT GRASP55. In contrast, the GRASP55-65 chimera, containing the GRASP65 SPR region, showed only traces of phosphorylation (Figure 3E) and was detected on LC3- and CHMP2A-positive vesicles in both control and rapamycin-treated cells (Figures S5B–S5D). Next, using sequential alanine mutagenesis and Phos-tag gel analyses, we identified a quintuple GRASP55 mutant (GRASP55-5TA; Figure 3F) that lacks mTORC1-mediated phosphorylation, with Thr264 seemingly playing a key role (Figures 3F and 3G). Importantly, localization of the non-phosphorylatable GRASP55-5TA or GRASP55-T264A mutant in control conditions largely resembles the localization pattern of WT GRASP55 in rapamycin-treated cells (Figures 3H and 3I), suggesting that phosphorylation of GRASP55 at these residues by mTORC1 is necessary for its Golgi localization, while its dephosphorylation is sufficient to relocalize it to organelles that participate in unconventional secretion processes.
The mTORC1-dependent GRASP55 proximome
GRASP55 is essential for stress-induced UPS, and we show here that its localization changes in response to stimuli that inactivate mTORC1. To investigate how the molecular environment of GRASP55 is affected by mTORC1 inhibition, and to better understand the role of GRASP55 in UPS through the autophagosomal/MVB route, we performed an ascorbate peroxidase 2 (APEX2)- and mass spectrometry (MS)-based analysis of the GRASP55 proximome in control or rapamycin-treated cells, stably expressing GRASP55-APEX2 or GFP-APEX2 chimeric proteins (Figure 4A; see also Method details). Pull-down assays, using streptavidin beads, showed enhanced protein biotinylation only upon APEX2 activation with both biotin-phenol and H2O2 (Figures S6A and S6B). Confocal microscopy confirmed the rapamycin-induced relocalization of GRASP55-APEX2 from the Golgi to LC3B- and CHMP2A-positive structures, whereas GFP-APEX2 localization was unaffected (Figures S6C–S6E). Furthermore, ultrastructural analyses confirmed the specific association of GRASP55-APEX2 with the Golgi or with MVBs, in control or rapamycin-treated cells, respectively, similar to the behavior of endogenous GRASP55 (Figure S6F).
Figure 4.

The mTORC1-dependent GRASP55 proximome
(A) Experimental outline of the APEX2-based GRASP55 proximome assay (details in text).
(B) CC GO analysis using proteins enriched in the GRASP55 proximome in DMSO-treated WI-26 cells. The color of each box represents fold change values for each protein in rapamycin- versus DMSO-treated cells. The number of proteins in the selected dataset for each term is shown on the right side of each bar.
(C) Volcano plot showing all proteins identified in the GRASP55 proximome experiment (gray dots). Proteins used in (B) are shown in blue. Proteins within this subset that belong to the CC GO term “Golgi membrane” are shown with black outline.
(D) As in (B), but for proteins enriched in the GRASP55 proximome in rapamycin-treated cells.
(E–G) Volcano plots as in (C), but for proteins used in (D) (red dots). Proteins that belong to the CC GO terms “membrane-bounded vesicle” (E), “actin cytoskeleton” (F), or “anchoring junction” (G) are shown with black outline.
(H) CoIP experiments in WI-26 cells ± Rapa confirm interaction of GRASP55 with selected proteins from the proximome assays.
(I–M) Colocalization analysis of GRASP55 with TMF1 (I), USO1 (J), GOLGIN-45 (K), SCAMP3 (L), and TMEM59-Myc (M) in WI-26 cells ± Rapa. Scale bars: 10 μm.
Demonstrating the power of our approach, purification of the biotinylated proteins from control or rapamycin-treated GRASP55-APEX2- (or GFP-APEX2)-expressing cells, and subsequent protein identification by liquid chromatography (LC)-MS, yielded more than 600 putative novel GRASP55-interacting and GRASP55-proximal proteins (Table S1). To investigate how mTORC1 inhibition influences the GRASP55 proximome, we then focused on proteins that are found differentially enriched when comparing control and rapamycin-treated cells and identified 219 high-confidence hits (106 in control conditions; 113 in rapamycin-treated cells) (Table S1). Gene ontology (GO) analysis revealed a strong enrichment of Golgi-membrane-related (e.g., COG5/7, GOLGA2/A5/B1, GOPC) and endoplasmic reticulum (ER)-Golgi-transport-related (e.g., COPA/B1/B2/G1/G2/E, SEC13/16A/23B/23IP/24D/31A) proteins in the GRASP55 proximome in control conditions (Figures 4B and 4C; Table S2), a result that is in line with GRASP55 localization in non-stressed cells and suggests a role for GRASP55 in cargo and vesicle trafficking. In contrast, closely resembling its involvement in secretory pathways, rapamycin treatment markedly increased the presence of proteins related to secretory compartments in the GRASP55 proximome (Figure 4D; Table S3), with vesicle- (e.g., CHMP4B, SCAMP3, SQSTM1, ARF6) (Figures 4D and 4E) and cytoskeleton-related GO terms (e.g., VCL, DST, CNN3, TWF1, CAPZA1/B, CORO2A/2B, SYNPO) (Figures 4D and 4F) found highly enriched in this dataset. Interestingly, we also observed enhanced proximity of GRASP55 to proteins related to anchoring junctions (e.g., ITGA3/A5/B1, TWF1/2, ANXA1) (Figures 4D and 4G), suggesting that cell adhesion proteins may be secreted via GRASP55-dependent routes.
The binding of GRASP55 to selected interacting proteins was verified by cross-linking/co-immunoprecipitation (coIP) experiments. IP of endogenous GRASP55 confirmed its interaction with the Golgi-localized TMF1 (TATA element modulatory factor 1) (Fridmann-Sirkis et al., 2004) and USO1 (USO1 vesicle transport factor) (Shorter and Warren, 1999) proteins, primarily in control conditions; whereas interaction with the secretory-pathway-related SCAMP3 (secretory carrier-associated membrane protein 3) (Singleton et al., 1997) and the autophagy-related TMEM59 (transmembrane protein 59) (Boada-Romero et al., 2013) proteins was primarily detected in rapamycin-treated cells (Figure 4H). Interestingly, binding of GRASP55 to GOLGIN-45 (also known as BLZF1), a well-known GRASP55 interaction partner at the Golgi membrane (Short et al., 2001), was unaffected by rapamycin (Figure 4H), suggesting that GOLGIN-45 may also relocalize away from the Golgi in a complex with GRASP55. Indeed, this was readily evident in IF experiments, staining cells for endogenous GRASP55 and GOLGIN-45 proteins (Figure 4K). Consistent with our coIP data, colocalization of endogenous GRASP55 with TMF1 or USO1 was observed in Golgi-resembling structures in control conditions and was largely abrogated by rapamycin treatment (Figures 4I and 4J), whereas GRASP55 colocalized with SCAMP3 and Myc-tagged TMEM59 in vesicle-resembling structures only in rapamycin-treated cells (Figures 4L and 4M). Collectively, our findings from the mTORC1-dependent GRASP55 proximome confirm the changes in its subcellular localization and reveal putative novel players and cargoes in the UPS pathway.
EM-related and cell-surface proteins are secreted in a GRASP55-dependent manner
Although the role of GRASP55 in UPS is well established, only a handful of proteins that are secreted via this pathway have been identified to date. To shed light on the GRASP55-dependent secretome, we performed SILAC/MS-based analysis in WT and GRASP55 KO cells (Figure 5A). This approach revealed 63 proteins that strongly and significantly depend on GRASP55 for their secretion into the extracellular space (Table S4). Intriguingly, GO term analysis revealed a strong enrichment of extracellular-region- and cell-adhesion-related proteins among the proteins that are secreted in a GRASP55-dependent manner (e.g., MMP2, COL6A1-3, CDH13, BCAM, CADM1) (Figures 5B–5E; Table S5), suggesting that GRASP55 influences ECM composition and cell adhesion by controlling unconventional cargo secretion. Of note, nearly half of the GRASP55-dependent secretome proteins harbor a signal peptide (Figure 5F), in line with previous reports showing that cargoes that either contain or lack a signal peptide can be secreted via UPS routes (Bugatti et al., 2020; Gee et al., 2011; Nüchel et al., 2018; Schotman et al., 2008).
Figure 5.

The GRASP55-dependent secretome
(A) Experimental outline of the SILAC-based GRASP55-dependent secretome assay in WI-26 cells (details in text).
(B) CC GO term analysis reveals an enrichment of extracellular-region-related terms among the GRASP55-dependent secretome proteins. Cell plot labeled as in Figure 4B.
(C) Volcano plot showing all proteins identified in the GRASP55-dependent secretome (gray dots). Proteins used for the GO analysis in (B) are shown in blue. Proteins within this subset that belong to the CC GO term “extracellular region part” are shown with black outline.
(D) BP GO term analysis reveals enrichment of cell-adhesion-related terms among the GRASP55-dependent secretome proteins. Cell plot labeled as in Figure 4B.
(E) Volcano plot showing proteins as in (C), but with outlined dots corresponding to the BP GO term “cell adhesion.”
(F) Percentage of proteins in the GRASP55-dependent secretome that contain or lack a signal peptide.
(G and H) MMP2 activity and secretion assayed in the supernatant of WT and GRASP55 KO WI-26 cells (2 lanes/genotype) by zymography and immunoblotting, respectively (G). Intracellular MMP2, GRASP55, and actin are used as controls. Quantification of MMP2 activity is shown in (H).
(I and J) Fluorescent gelatin degradation assay with WT and GRASP55 KO WI-26 cells. Degraded gelatin is shown as black spots. F-actin staining used as cytoskeleton marker. Quantification of relative gelatin degradation is shown in (J). Scale bars: 10 μm.
Data in (H) and (J) are shown as mean ± SD. ∗∗∗p < 0.005. See also Figure S6 and Tables S4 and S5.
The top protein that depends on GRASP55 for its secretion was MMP2 (Figure 5C), an enzyme that can cleave multiple ECM components and signaling molecules (Overall, 2002) and plays significant roles in cell physiology (e.g., migration, adhesion, signaling) (Fernandez-Patron et al., 2016) and pathology (e.g., metastasis) (Henriet and Emonard, 2019). Confirming our secretome data, MMP2 was readily detected by immunoblotting in the culture medium of WT WI-26 cells (Figure 5G). In stark contrast to WT cells, MMP2 secretion—but not intracellular MMP2 levels—was blunted in two independent GRASP55 KO clones (Figure 5G). Following reduced extracellular protein levels, MMP2 activity, as detected by zymography, was severely compromised in the medium of GRASP55 KO cells, as compared to WT cells (Figures 5G and 5H). Similarly, in gelatin degradation assays, WT cells that secrete MMP2 can degrade a fluorescently labeled gelatin substrate, which was not seen with GRASP55 KO cells (Figures 5I and 5J). Similar data were obtained from cells where we transiently knocked down GRASP55, which secreted less MMP2 (Figure S7A) and showed decreased MMP2 activity in zymography (Figures S7A and S7B) and gelatin degradation assays (Figures S7C and S7D).
Besides secreted factors, proteins that localize at the cell surface (e.g., integral plasma membrane and surface proteins) can also be delivered via unconventional secretory routes (Rabouille, 2017). Aiming to identify the GRASP55-dependent surfactome, we established a SILAC-based, cell-surface protein biotinylation assay and combined it with MS analysis, using GRASP55 KO and WT cells (Figure 6A). This approach allowed us to identify numerous cell-surface, ECM, cell junction, and plasma membrane proteins, 41 of which were found to strongly and significantly depend on GRASP55 for their delivery to the surface (Table S6). Subsequent GO term analysis using cellular component (CC), biological process (BP), and molecular function (MF) categories revealed a strong overrepresentation of terms that correspond to the respective cell compartments (i.e., focal adhesion, cell junction, plasma membrane, extracellular region) and of proteins involved in cell adhesion, motility, and cell adhesion molecule binding functions (e.g., integrins, TGM2, CDH13, TGFBI, CADM1, GJA1, SEMA7A) (Figures 6B–6G; Table S7). Similar to the secretome data, approximately 40% of the GRASP55-dependent surfactome proteins harbor a signal peptide (Figure 6H), showing that not only signal-less cargoes use UPS pathways for their delivery to the surface.
Figure 6.

The GRASP55-dependent surfactome
(A) Experimental outline of the SILAC-based GRASP55-dependent surfactome assay in WI-26 cells (details in text).
(B) CC GO term analysis reveals enrichment of cell-junction-related terms among the GRASP55-dependent surfactome proteins. Cell plot labeled as in Figure 4B.
(C) Volcano plot showing all proteins identified in the GRASP55-dependent surfactome (gray dots). Proteins used in (B) are shown in blue. Proteins within this subset that belong to the CC GO term “cell junction” are shown in blue with black outline.
(D) BP GO term analysis reveals enrichment of cell-motility-related terms among the GRASP55-dependent surfactome proteins. Cell plot labeled as in Figure 4B.
(E) Volcano plot showing proteins as in (C), but with outlined blue dots corresponding to the BP GO term “cell motility.”
(F) MF GO term analysis reveals enrichment of cell-adhesion-molecule-binding-related terms among the GRASP55-dependent surfactome proteins. Cell plot labeled as in Figure 4B.
(G) Volcano plot showing proteins as in (C), but with outlined blue dots corresponding to the MF GO term “cell adhesion molecule binding.”
(H) Percentage of proteins in the GRASP55-dependent surfactome that contain or lack a signal peptide.
(I) TGM2 levels at the cell surface tested by surface protein biotinylation assays and immunoblotting in WT and GRASP55 KO WI-26 cells. Intracellular TGM2, GRASP55, and actin are used as controls.
One of the proteins whose delivery to the cell surface strongly depends on GRASP55 is transglutaminase 2 (TGM2; or tissue transglutaminase [tTG]), an enzyme involved in cell adhesion, growth, differentiation, and cell death (reviewed in Tatsukawa et al., 2016) (Figure 6C). Although TGM2 is known to be secreted to the ECM and the plasma membrane, it does not contain a hydrophobic signal peptide at its N terminus (Hatsuzawa et al., 1997; Santhanam et al., 2011; Zemskov et al., 2011). Nonetheless, the properties of TGM2 secretion and whether this depends on GRASP55 remained so far unknown. Validating our surfactome data, TGM2 surface levels, but not total levels, were strongly decreased in two independent GRASP55 KO clones (Figure 6I).
Overall, our data suggest that GRASP55 regulates the composition of the cell surface and ECM proteomes, and therefore crucial cellular functions, by mediating the delivery of MMP2, TGM2, and other key proteins at the cell surface and into the extracellular space. Furthermore, we provide a comprehensive characterization of the GRASP55-dependent secretome and surfactome, which sets the basis for future work on UPS and improves our understanding on the biological relevance of this important cellular function.
TSC-mTORC1 regulate the secretion and activity of MMP2 at the extracellular space via GRASP55
Hypoxia is a stress condition that inhibits mTORC1, largely via activating the TSC, and we show here that it drives the dephosphorylation (Figures S4B and S4C) and relocalization of GRASP55 to secretory vesicles (Figures S4D–S4I). Using MMP2 secretion as a proxy for GRASP55-mediated cargo delivery to the extracellular space (Figures 5G–5J, S7A, and S7B), we next sought to investigate how perturbations in mTORC1 activity influence this process. Interestingly, hypoxia stimulated MMP2 secretion above basal levels in WT cells (Figures 7A, 7B, S7E, and S7F), accompanied by increased enzymatic activity in the culture medium (Figures 7A, 7C, S7E, and S7G), and by increased degradation of a fluorescent gelatin substrate (Figures S7H and S7I). Consistent with a model where hypoxia acts upstream of GRASP55, MMP2 secretion, activity, and gelatin degradation were blunted in GRASP55-null cells grown in normoxic or hypoxic conditions (Figures S7E–S7I). Further confirming a role for mTORC1 in the GRASP55-dependent secretion of MMP2, mTORC1 hyperactivation by transient TSC2 knockdown compromised MMP2 secretion and activity (Figures 7A–7C). Unlike in control cells, hypoxia did not induce MMP2 secretion further in TSC2 knockdown cells that do not properly inactivate mTORC1 in response to stress (Figures 7A–7C). In contrast, Torin treatment inhibited mTORC1 and induced MMP2 secretion in both control and TSC2 knockdown cells (Figures 7A–7C).
Figure 7.

mTORC1 regulates MMP2 secretion and activity at the extracellular space via GRASP55 relocalization
(A–C) Zymography assay for MMP2 activity and immunoblotting for MMP2 levels in the supernatant of control (siCtrl), TSC2 (siTSC2), or GRASP55 (siGR55) knockdown WI-26 cells, treated in basal conditions (Ctrl), hypoxia (H), or with torin (T). Control intracellular proteins were analyzed with indicated antibodies. GRASP55 phosphorylation was analyzed with Phos-tag gels (A). Quantification of MMP2 secretion is shown in (B), and MMP2 activity is shown in (C).
(D) Schematic representation of the GRASP55ΔG2-Giantin-CT fusion protein (55-Giantin). The C-terminal coiled-coil and the TM of Giantin are shown.
(E) Colocalization of 55-Giantin with GM130, LC3B, and CHMP2A in WI-26 cells ± Rapa.
(F–H) Zymography assay for MMP2 activity in the supernatant of cells expressing WT GRASP55 (55 WT), 55-Giantin, or transfected with empty vector (EV) in normoxia (N) or hypoxia (H). Levels of secreted MMP2 and control proteins in cells analyzed by immunoblotting (F). Quantification of MMP2 secretion is shown in (G), and MMP2 activity is shown in (H).
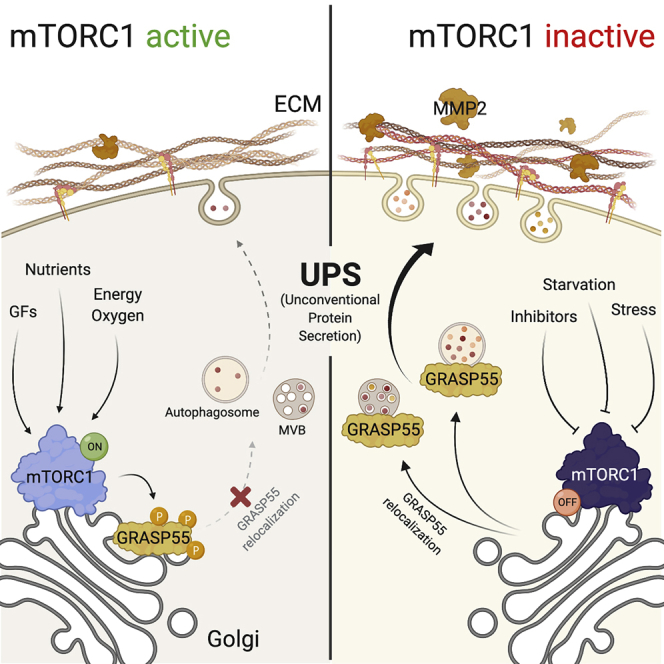
(I) Working model for the role of mTORC1 and GRASP55 relocalization in UPS. See main text for details. Created with https://biorender.com.
Data in graphs are shown as mean ± SD. ∗p < 0.05, ∗∗p < 0.01, ∗∗∗p < 0.005. See also Figure S7.
We next asked if the relocalization of GRASP55 to secretory vesicles is necessary for MMP2 secretion. To address this question, we artificially tethered GRASP55 to the Golgi membrane by fusing it to a heterologous transmembrane domain. Because the glycine residue in position 2 of GRASP55 is necessary for its myristoylation, a GRASP55 mutant lacking this glycine (GRASP55ΔG2) cannot localize at the Golgi (Shorter et al., 1999). We then fused the Golgi-targeting domain of human Giantin (also known as GOLGB1) (Misumi et al., 2001), an integral Golgi protein (Barr, 1999), to the C terminus of GRASP55ΔG2 (hereafter GRASP55ΔG2-Giantin-CT) (Figure 7D) to tether it to the Golgi membrane—thus bypassing the need for its myristoylation signal—and expressed it in GRASP55 KO cells. As expected, the GRASP55ΔG2-Giantin-CT fusion protein remained associated with the Golgi and did not relocalize to secretory vesicles in response to mTORC1 inhibition (Figure 7E). Strikingly, cells expressing GRASP55ΔG2-Giantin-CT demonstrated diminished MMP2 secretion and activity in culture media and in normoxic or hypoxic conditions (Figures 7F–7H), proving that the relocalization of GRASP55 in response to stress is a strict requirement for unconventional secretion of MMP2.
While the phosphorylation and subcellular localization of GRASP55 or GRASP65-55 responds to changes in mTORC1 activity, GRASP65 and GRASP55-65 do not seem to be regulated by mTORC1 (Figures 3E and S5). Consequently, expression of WT GRASP55 or GRASP65-55, but not WT GRASP65, in GRASP55 KO cells rescued MMP2 levels and activity in the culture medium (Figures S7J–S7L). Surprisingly, the GRASP55-65 chimera that is present on secretory vesicles in both control and rapamycin-treated cells (Figures S6B–S6D) was not able to rescue MMP2 secretion in GRASP55-null cells (Figures S7J–S7L), indicating that additional sequences in the GRASP55 C terminus are required to fulfill its role in promoting UPS. Furthermore, cells expressing the non-phosphorylatable GRASP55-5TA or GRASP55-T264A mutants, which already localize at secretory compartments of UPS even in cells with active mTORC1, showed enhanced MMP2 secretion (Figures S7M and S7N) and activity at the extracellular space (Figures S7M and S7O).
Discussion
Cellular stress promotes UPS via a previously uncharacterized TSC-mTORC1-GRASP55 signaling axis
The findings presented here demonstrate that UPS is a cellular process regulated downstream of mTORC1 and identify GRASP55 as a direct mTORC1 target and downstream effector to control this process. Although GRASP55 is a well-known player in most UPS types in mammalian cells, several aspects of its function remain elusive. We show here that active mTORC1 phosphorylates GRASP55 to maintain it at the Golgi, whereas mTORC1 inhibition by physiological, pharmacological, or genetic means leads to the dephosphorylation and subsequent subcellular relocalization of GRASP55 to stimulate unconventional secretion of ECM-related proteins, such as MMP2, to modify the extracellular proteome (Figure 7I).
GRASP55, and the closely related GRASP65, reside at Golgi cisternae and were originally shown to facilitate the formation of the Golgi ribbon through their membrane-tethering ability. A role for GRASP55 in UPS was initially described in Dictyostelium, where the GRASP homolog GrpA is required for the secretion of the acyl-coenzyme A (CoA) binding protein AcbA in development (Kinseth et al., 2007; Levi and Glick, 2007). Similarly, the yeast Acb1 (acyl-CoA-binding protein) and Sod1 (superoxide dismutase 1) proteins were also shown to be secreted upon starvation via unconventional routes that require Grh1, the yeast GRASP homolog (Cruz-Garcia et al., 2018). Recent studies indicated that GRASP55 can also leave the Golgi and is involved in the unconventional secretion of specific cargo proteins. ER stress was shown to induce GRASP55 phosphorylation at residues near its C terminus and its relocalization from the Golgi to the ER to facilitate the unconventional secretion of a conventional-secretion-deficient CFTR (cystic fibrosis transmembrane conductance regulator) mutant (Gee et al., 2011; Kim et al., 2016). Moreover, GRASP55 controls the aggregation and secretion of interleukin (IL)-1β in macrophages via regulating an ER-associated stress pathway (Chiritoiu et al., 2019). Besides ER stress, glucose deprivation has been suggested to reduce GRASP55 O-GlcNAcylation, which in turn drives its relocalization away from the Golgi to facilitate autophagy by bridging and fusing autophagosomes and lysosomes (Zhang et al., 2018). Of note, in our hands, ER stress induction using tunicamycin failed to increase GRASP55 phosphorylation or to relocalize it to the ER. Moreover, pharmacological inhibition of O-GlcNAc transferase (OGT) or O-GlcNAcase (OGA), or exogenous supplementation of UDP-GlcNAc, had no effect on GRASP55 subcellular localization in our system (data not shown), suggesting that the mTORC1-mediated phosphorylation is the primary modification regulating GRASP55 localization and UPS in response to a multitude of stimuli that regulate mTOR signaling.
Cell biological aspects of GRASP55 regulation and cargo selection in UPS
Although mTORC1 activation primarily takes place at the lysosomal surface, where it is recruited by the heterodimeric Rag GTPases when AAs are abundant (Sancak et al., 2010), its regulators (e.g., Rheb, Arf1) (Angarola and Ferguson, 2019; Buerger et al., 2006; Gosavi et al., 2018; Hanker et al., 2010; Hao et al., 2018; Jewell et al., 2015; Yadav et al., 2013), its substrates (Ahmed et al., 2019; Holz et al., 2005; Zhou et al., 2015), and mTOR itself (Gosavi et al., 2018; Liu and Zheng, 2007; Tsokanos et al., 2016; Yadav et al., 2013; Zhou et al., 2015) were also described to localize and to be regulated at multiple subcellular locations, including the Golgi (summarized in Betz and Hall, 2013). We demonstrate here that when mTORC1 is active, phosphorylated GRASP55 resides exclusively at the Golgi, where it colocalizes with mTOR. Because both the kinase (i.e., mTOR) (Gosavi et al., 2018) and the substrate (i.e., GRASP55) are at the Golgi under basal culture conditions, our data support a model where the Golgi pool of mTORC1 phosphorylates GRASP55 directly at Golgi cisternae, thereby highlighting GRASP55 as the first Golgi-based mTORC1 substrate and revealing a key role for mTORC1 at this subcellular location.
Different types of UPS utilize autophagosomal and endolysosomal/MVB structures for the secretion of cargo upon stress. For this reason, UPS has also been referred to as “exophagy” or “secretory autophagy.” Because mTORC1 inhibition induces both degradative autophagy and, as we show here, secretory autophagy, both processes can take place simultaneously in cells treated with rapamycin. Of note, secretory autophagosomes qualitatively and functionally differ from degradative autophagosomes, being decorated with Rab8A or Rab8B proteins, respectively, despite both types being LC3 positive (Chen et al., 2017; Dupont et al., 2011; Jiang et al., 2013; Nüchel et al., 2018; Rabouille, 2017; Zhang et al., 2015). The specifics of cargo selection for secretion or degradation are not clear yet; however, our data exclude the possibility of autophagic GRASP55 degradation and show that its relocalization to these organelles is part of the UPS induction process, as its levels do not change in response to mTOR inhibition or BafA1 treatment.
Our secretome and surfactome studies highlight another important mechanistic aspect of UPS: although the presence of a signal peptide is indeed necessary for bulk protein secretion, proteins that either harbor or lack a signal peptide can be secreted via UPS. Our findings are in line with recent examples from the literature showing that proteins such as transforming growth factor (TGF)-β1 (Nüchel et al., 2018), TGF-α (Kuo et al., 2000), vWF (von Willebrand factor) (Bugatti et al., 2020), the ΔF508-CFTR mutant (Gee et al., 2011), or Drosophila integrins (Schotman et al., 2008)—all of which contain signal peptides—require GRASP55 and/or UPS routes for their delivery to the cell surface, at least under certain conditions (e.g., cellular stress). Future work will be necessary to qualitatively and quantitatively characterize the differences between secretory and degradative autophagosomes and to mechanistically explain how cargo selection happens.
Proximome studies identify putative functional interactions for GRASP55 in UPS
Our GRASP55-dependent proximome analysis reveals the molecular environment of GRASP55 at the Golgi and at secretory vesicles and shows how this is changing when mTORC1 is inhibited (Figure 4; Tables S1, S2, and S3). Genetic interaction experiments in yeast previously showed that the GRASP55/65 homolog (Grh1) may be regulating vesicle tethering in cooperation with the tethering factor Uso1 (Behnia et al., 2007). We identify here the mammalian USO1 protein as a GRASP55 binding partner at the Golgi, with the interaction disappearing in rapamycin-treated cells (Figures 4H and 4J; Tables S1 and S2). These data suggest that mTORC1 inhibition may be influencing ER-to-Golgi vesicle trafficking via the regulation of the GRASP55-USO1 interaction.
A recent paper described the ERGIC (ER-Golgi intermediate compartment)-localized TMED10 (transmembrane emp24 domain-containing protein 10) as a protein channel that facilitates the unconventional secretion of cytosolic proteins lacking a signal peptide by mediating their entry into this secretory compartment (Zhang et al., 2020). Interestingly, we identify TMED10 as a novel GRASP55 partner in our proximome assay, with the interaction being detected predominantly in control conditions (Figure 4C; Tables S1 and S2). This raises the intriguing possibility that GRASP55 may be cooperating with TMED10 to regulate UPS and that the TMED10-dependent cargo secretion may be executed by GRASP55-dependent routes. Therefore, we provide important insights into the role of GRASP55 at the Golgi and other locations and identify proteins that interact with GRASP55 directly or indirectly to mediate or modulate its function.
Potential implications of GRASP55/UPS dysregulation in disease
Our work highlights the TSC/mTORC1 complexes as critical points of signal integration in the regulation of UPS. Inactivating mutations in the genes that encode TSC1 (or hamartin) or TSC2 (or tuberin) cause TSC, a disease characterized by benign tumors in multiple organs; and neurological disorders, such as seizures, mental challenge, and autism. Most of the symptoms associated with TSC are ascribed to the hyperactivation of mTORC1, and rapamycin analogs are considered a promising treatment strategy to fight TSC (Henske et al., 2016). We find that in cells lacking proper TSC function, which maintain active mTORC1 even under stress conditions, the aforementioned GRASP55 response is blunted. Investigating the role of GRASP55 hyperphosphorylation, UPS dysregulation, compromised MMP2 secretion, and defective remodeling of the extracellular proteome—all caused by TSC loss-of-function—in the development of TSC or other mTOR-opathies will be an important avenue toward a better understanding of the TSC pathology in the future. Furthermore, because of the important role of MMP2 in signaling, motility, and cancer (Henriet and Emonard, 2019), follow-up work should aim to investigate whether ECM remodeling is an important disease-related aspect downstream of mTORC1.
Limitations of the study
Our proteomic analyses identify a large number of proteins that are delivered to the cell surface or the extracellular space via GRASP55-dependent unconventional secretory pathways. However, our findings do not exclude that some of these proteins may also be secreted via conventional routes, in the absence of cellular stress. According to this model, upon stress, when bulk secretion of most proteins is blocked (van Leeuwen et al., 2018; Zacharogianni et al., 2011, 2014), UPS could take over to maintain secretion of selected cargos to facilitate cellular stress adaptation. Similarly, although our work supports the well-established role of GRASP55 in stress-induced UPS, it does not exclude possible additional functions for GRASP55 at the Golgi, some of which may relate to additional secretory pathways.
Are the proteins identified in the GRASP55 proximome novel interactors, cargo proteins, or both? Although we could detect physical interaction between GRASP55 and most selected proteins by coIP, given the estimated radius of APEX2-mediated protein biotinylation and the properties of its activity (Hung et al., 2016; Martell et al., 2012; Valerius et al., 2019), we speculate that a portion of the GRASP55 proximome may represent cargo proteins rather than GRASP55 interactors. Supporting this hypothesis, some of the proteins that we identify in the GRASP55 proximome in rapamycin-treated cells are also delivered to the cell surface or the extracellular space in a GRASP55-dependent manner, as shown in the secretome and surfactome experiments (Tables S4 and S6). Of note, in Drosophila development, dGRASP55 was shown to regulate integrin delivery to the plasma membrane via non-canonical secretory pathways to control epithelial remodeling (Schotman et al., 2008). Suggesting that a similar mechanism may also operate in mammalian cells, we observed a strong enrichment of integrins and integrin-related proteins both in the GRASP55 proximome in rapamycin-treated cells and in the GRASP55-dependent surfactome (Tables S1, S2, S6, and S7).
Why would mTORC1 inhibition induce UPS in response to cellular stress? What is the cellular “teleonomy” for the existence of the mechanism that we describe here? With the TSC/mTORC1 signaling hub integrating information from both nutritional and non-nutritional cues, these complexes are perfectly positioned as regulators of most important cellular processes, including—as we now show—UPS. Hence, altering the phosphorylation status of GRASP55 downstream of TSC/mTORC1 ensures that UPS pathways are activated in response to any stimulus that requires enhanced remodeling of the extracellular proteome. The physiological consequences of this remodeling are less clear at the moment, matching our limited understanding about the role and importance of UPS per se. Here, we reveal important mechanistic aspects of how UPS is regulated and shed light on the nature of the cargoes that follow this secretory path to reach the plasma membrane and the extracellular space. Future research in this direction will be necessary to unravel the full spectrum of the cellular functions that are regulated via this mechanism, but we can already speculate that these might involve the cellular response to starvation (e.g., via the degradation of ECM proteins to replenish intracellular AA pools; Muranen et al., 2017; Palm et al., 2015), food-seeking (e.g., via altering cell adhesion, motility, and migration; Liu et al., 2019; Van Haastert and Bosgraaf, 2009), or intercellular communication (e.g., via the secretion of signaling molecules; Denef, 2008; Püschel et al., 2020).
STAR★Methods
Key resources table
| REAGENT or RESOURCE | SOURCE | IDENTIFIER |
|---|---|---|
| Antibodies | ||
| Rabbit monoclonal anti-4E-BP1 (53H11) | Cell Signaling Technology | Cat#9644; RRID: AB_2097841 |
| Mouse monoclonal 58K Golgi protein (58K-9) | Abcam | Cat#ab27043; RRID: AB_2107005 |
| Rabbit monoclonal anti-AMPKα (D5A2) | Cell Signaling Technology | Cat#5831; RRID: AB_10622186 |
| Rabbit monoclonal anti-Phospho-AMPKα (Thr172) (40H9) | Cell Signaling Technology | Cat#2535; RRID: AB_331250 |
| Mouse monoclonal anti-Actin (C4) | BD Transduction Laboratories | Cat#612656; RRID: AB_2289199 |
| Rabbit monoclonal anti-AKT (C67E7) | Cell Signaling Technology | Cat#4691; RRID: AB_915783 |
| Rabbit monoclonal anti-Phospho-AKT (Ser473) (D9E) | Cell Signaling Technology | Cat#4060; RRID: AB_2315049 |
| Rabbit polyclonal anti-CHMP2A | Proteintech | Cat#10477-1-AP; RRID: AB_2079470 |
| Mouse monoclonal anti-FLAG (M2) | Sigma-Aldrich | Cat#F1804; RRID: AB_262044 |
| Rabbit polyclonal anti-FLAG (DYKDDDDK tag) | Proteintech | Cat#20543-1-AP; RRID: AB_11232216 |
| Mouse monoclonal anti-GM130 (35/GM130) | BD Transduction Laboratories | Cat#610823; RRID: AB_398141 |
| Rabbit polyclonal anti-GM130/GOLGA2 | Proteintech | Cat#11308-1-AP; RRID: AB_2115327 |
| Rabbit polyclonal anti-GOLGIN-45/BLZF1 | Genetex | Cat#GTX116434; RRID: AB_11168554 |
| Rabbit polyclonal anti-GRASP55/GORASP2 | Proteintech | Cat#10598-1-AP; RRID: AB_2113473 |
| Mouse monoclonal anti-GRASP55/GORASP2 (1C9A3) | Proteintech | Cat#66627-1-Ig; RRID: AB_2881987 |
| Mouse monoclonal anti-GRASP65 (OTI5G8) | Novus Biologicals | Cat#NBP2-02665; RRID: AB_2724399 |
| Rabbit polyclonal anti-HIF1α | Genetex | Cat#GTX127309-25; RRID: AB_2616089 |
| Rabbit polyclonal anti-LC3B | Sigma-Aldrich | Cat#L7543; RRID: AB_796155 |
| Rabbit polyclonal anti-mTOR (for WB) | Cell Signaling Technology | Cat#2972; RRID: AB_330978 |
| Rabbit monoclonal anti-mTOR (7C10) (for Immuno-EM) | Cell Signaling Technology | Cat#2983; RRID: AB_2105622 |
| Rabbit monoclonal anti-p38 MAPK (D13E1) | Cell Signaling Technology | Cat#8690; RRID: AB_10999090 |
| Rabbit monoclonal anti-Phospho-p38 MAPK (Thr180/Tyr182) (D3F9) | Cell Signaling Technology | Cat#4511; RRID: AB_2139682 |
| Rabbit monoclonal anti-MMP2 (D4M2N) | Cell Signaling Technology | Cat#40994; RRID: AB_2799191 |
| Mouse monoclonal anti-Myc (9E10) | Santa Cruz Biotechnology | Cat#sc-40; RRID: AB_2857941 |
| Rabbit monoclonal anti-Myc-Tag (71D10) | Cell Signaling Technology | Cat#2278 RRID: AB_490778 |
| Rabbit monoclonal anti-Raptor (24C12) | Cell Signaling Technology | Cat#2280; RRID: AB_561245 |
| Rabbit monoclonal anti-Rictor (53A2) | Cell Signaling Technology | Cat#2114; RRID: AB_2179963 |
| Rabbit monoclonal anti-S6 Ribosomal Protein (5G10) | Cell Signaling Technology | Cat#2217; RRID: AB_331355 |
| Rabbit monoclonal anti-Phospho-S6 Ribosomal Protein (Ser235/S236) (D57.2.2E) | Cell Signaling Technology | Cat#4858; RRID: AB_916156 |
| Rabbit polyclonal anti-SCAMP3 | Genetex | Cat#GTX102216-25; RRID: AB_1241293 |
| Mouse monoclonal anti-TGM2 (CUB 7402) | Thermo Fisher Scientific | Cat#MA5-12739; RRID: AB_10985077 |
| Rabbit polyclonal anti-TMEM59 | Proteintech | Cat#24134-1-AP; RRID: AB_2879439 |
| Rabbit polyclonal anti-TMF1 | Proteintech | Cat#19728-1-AP; RRID: AB_10667009 |
| Rabbit monoclonal anti-TSC2 (D93F12) | Cell Signaling Technology | Cat#4308; RRID: AB_10547134 |
| Rabbit polyclonal anti-USO1/p115 | Proteintech | Cat#13509-1-AP; RRID: AB_2257094 |
| Goat anti-mouse Alexa 488 | Thermo Fisher Scientific | Cat#A-11001; RRID: AB_2534069 |
| Goat anti-mouse Alexa 555 | Thermo Fisher Scientific | Cat#A-21424; RRID: AB_141780 |
| Goat anti-mouse Alexa 647 | Thermo Fisher Scientific | Cat#A-21235; RRID: AB_2535804 |
| Goat anti-rabbit Alexa 488 | Thermo Fisher Scientific | Cat#A-11034; RRID: AB_2576217 |
| Goat anti-rabbit Alexa 555 | Thermo Fisher Scientific | Cat#A-21428; RRID: AB_141784 |
| Goat anti-rabbit Alexa 647 | Thermo Fisher Scientific | Cat#A-21245; RRID: AB_2535813 |
| Swine anti-rabbit HRP | Agilent/Dako | Cat#P0399; RRID: AB_2617141 |
| Rabbit anti-mouse HRP | Agilent/Dako | Cat#P0260; RRID: AB_2636929 |
| Bacterial and virus strains | ||
| One Shot TOP10/P3 Chemically Competent E. coli | Thermo Fisher Scientific | Cat#C505003 |
| BL21(DE3) Competent Cells | Thermo Fisher Scientific | Cat#EC0114 |
| Chemicals, peptides, and recombinant proteins | ||
| 2-Deoxy-D-glucose | Sigma-Aldrich | Cat#D8375 |
| Alkyne Agarose | Jena Bioscience | Cat#CLK-1032-2 |
| 13C L-Arginine hydrochloride (Arg-6) | Silantes | Cat#201203902 |
| 13C 15N L-Arginine hydrochloride (Arg-10) | Silantes | Cat#201603902 |
| Azidohomoalanine (AHA) | Anaspec | Cat#AS-63669 |
| [gamma-32P]ATP | Hartmann Analytic | Cat#FP-301 |
| Bafilomycin A1 | Alfa Aesar | Cat#J61835 CAS: 88899-55-2 |
| Biotin-Phenol | Iris Biotech | Cat#LS-3500 CAS: 41994-02-9 |
| Fluorescence mounting medium | Agilent/Dako | Cat#S3023 |
| DAPI | Sigma-Aldrich | Cat#D9542 CAS: 28718-90-3 |
| DMEM/F12 amino acid free | US Biologicals | Cat#D9811-01 |
| DSP | Thermo Fisher Scientific | Cat#22585 CAS: 57757-57-0 |
| Dialyzed FBS (for AA starvation) | Sigma-Aldrich | Cat#F0392 |
| Dialyzed FBS (for SILAC) | Athenaes | Cat#AES-0427 |
| Anti-FLAG M2 Affinity Gel | Sigma-Aldrich | Cat#A2220 |
| Gelatin, Oregon Green 488 conjugate | Thermo Fisher Scientific | Cat#G13186 |
| Lambda Protein Phosphatase | New England BioLabs | Cat#P0753 |
| 2H 4.4’.5.5′-D4-L-Lysine dihydrochloride (Lys-4) | Silantes | Cat#211103913 |
| 13C 15N L-Lysine hydrochloride (Lys-8) | Silantes | Cat#211603902 |
| Alexa Fluor 647 Phalloidin | Thermo Fisher Scientific | Cat#A22287 |
| PF-4798671 (S6Ki) | Selleckchem | Cat#S2163 CAS: 1255517-76-0 |
| PhosSTOP | Sigma-Aldrich | Cat#4906837001 |
| Protease inhibitor cocktail | Sigma-Aldrich | Cat#P8340 |
| Phos-tag acrylamide | FUJIFILM Wako Chemicals | Cat#AAL-107 |
| Rapamycin | Alfa Aesar | Cat#J62473.MF CAS: 53123-88-9 |
| SILAC DMEM/F12 | Athenaes | Cat#AES-0423 |
| iFluor 555-streptavidin conjugate | AAT Bioquest | Cat#16959 |
| Streptavidin HRP | Biorad | Cat#STAR5B |
| Streptavidin Sepharose | Sigma-Aldrich | Cat#GE17-5113-01 |
| Sulfo-NHS-LC-Biotin | ApexBio | Cat#A8003 CAS: 127062-22-0 |
| EZ-Link Sulfo-NHS-SS-Biotin | Thermo Fisher Scientific | Cat#21331 |
| Torin 1 | Cayman Chemical | Cat#Cay10997-10 CAS: 1222998-36-8 |
| XtremeGENE HP DNA transfection reagent | Sigma-Aldrich | 06366236001 |
| Critical commercial assays | ||
| Click Chemistry Capture kit | Jena Bioscience | Cat#CLK-1065 |
| Deposited data | ||
| GRASP55-APEX2 Proximome | This paper; ProteomeXchange Consortium/PRIDE | Table S1; PXD020331 |
| GRASP55 KO Secretome | This paper; ProteomeXchange Consortium/PRIDE | Table S4; PXD020331 |
| GRASP55 KO Surfactome | This paper; ProteomeXchange Consortium/PRIDE | Table S6; PXD020331 |
| Experimental models: Cell lines | ||
| Human: HEK293FT cells | Thermo Fisher Scientific | Cat#R70007; RRID: CVCL_6911 |
| Human: HFF-1 cells | ATCC | Cat#SCRC-1041; RRID: CVCL_3285 |
| Human: Saos-2 cells | ATCC | Cat#HTB-85; RRID: CVCL_0548 |
| Human: WI-26 SV40 cells | ATCC | Cat#CCL-95.1; RRID: CVCL_2758 |
| Oligonucleotides | ||
| See Table S9 | N/A | |
| Recombinant DNA | ||
| GeneArt Strings, custom DNA fragments | Thermo Fisher Scientific | Cat#815020DE |
| Plasmid: pcDNA4/TO/Myc-His | Thermo Fisher Scientific | Cat#V103020 |
| Plasmid: pITR-TTP | Kowarz et al., 2015; Huyghe et al., 2020; Wang et al., 2018 | N/A |
| Plasmid: pGEX-6P-2 | Cytiva | Cat#28954650 |
| Plasmid: pSpCas9(BB)-2A-Puro 2.0 (pX459) | Ran et al., 2013 | Addgene Plasmid #62988 |
| Plasmid: pX459-hGRASP55-ex3 | This paper | N/A |
| Plasmid: pX459-hTSC2-ex5 | This paper | N/A |
| Plasmid: pcDNA6-5HT6-APEX2 | Kohli et al., 2017 | N/A |
| Plasmid: pGEX6P2-hEIF4EBP1 | This paper | N/A |
| Plasmid: pGEX6P2-hGRASP55 | Nüchel et al., 2018 | N/A |
| Plasmid: pcDNA4/TO/Myc-His-hGRASP55 | Nüchel et al., 2018 | N/A |
| Plasmid: pcDNA4/TO/Myc-His-hGRASP65 | This paper | N/A |
| Plasmid: pcDNA4/TO/Myc-His-hTMEM59 | This paper | N/A |
| Plasmid: pcDNA4/TO/Myc-His-hGRASP55ΔG2-FLAG-Giantin-CT | This paper | N/A |
| Plasmid: pcDNA4/TO/Myc-His-GFP-APEX2 | This paper | N/A |
| Plasmid: pcDNA4/TO/Myc-His-hGRASP55-APEX2 | This paper | N/A |
| Plasmid: pcDNA4/TO/Myc-His-hGRASP55-65 | This paper | N/A |
| Plasmid: pcDNA4/TO/Myc-His-hGRASP65-55 | This paper | N/A |
| Plasmid: pcDNA4/TO/Myc-His-hGRASP55 T264A | This paper | N/A |
| Plasmid: pcDNA4/TO/Myc-His-hGRASP55 T232/249/250/257/264A (5TA) | This paper | N/A |
| Plasmid: pITR-TPP-GFP-APEX2-Myc-His | This paper | N/A |
| Plasmid: pITR-TPP-hGRASP55-APEX2-Myc-His | This paper | N/A |
| Plasmid: pcDNA3-FLAG-mTOR | Vilella-Bach et al., 1999 | Addgene Plasmid Cat#26603 |
| Plasmid: pRK5-HA-RAPTOR | Kim et al., 2002 | Addgene Plasmid #8513 |
| Software and algorithms | ||
| ImageJ | Schneider et al., 2012 | https://imagej.nih.gov/ij/ |
| JaCoP plugin for ImageJ | Bolte and Cordelières, 2006 | https://imagej.nih.gov/ij/plugins/track/jacop.html |
| MaxQuant version 1.5.3.8 | Cox et al., 2011 | https://maxquant.net/maxquant/ |
| Perseus (version 1.6.5) | Tyanova et al., 2016 | https://maxquant.net/perseus/ |
| Prism Graph Pad | Graphpad Software | https://www.graphpad.com/ |
Resource availability
Lead contact
Further information and reasonable requests for resources and reagents should be directed to and will be fulfilled by the Lead Contact, Dr. Constantinos Demetriades (Demetriades@age.mpg.de).
Materials availability
All unique plasmids and cell lines generated in this study are available from the Lead Contact with a completed material transfer agreement.
Data and code availability
The mass spectrometry proteomics data have been deposited to the ProteomeXchange Consortium via the PRIDE (Perez-Riverol et al., 2019) partner repository with the dataset identifier PXD020331 and are publicly available as of the date of publication. Accession numbers are listed in the Key Resources Table.
This paper does not report original code.
Any additional information required to reanalyze the data reported in this paper is available from the lead contact upon request.
Experimental model and subject details
Cell culture
All cell lines were grown at 37°C, 5% CO2. Human male diploid lung WI-26 SV40 fibroblasts (WI-26 cells; #CCL-95.1, ATCC; RRID: CVCL_2758) were cultured in DMEM/F12 GlutaMAX medium (#31331093, Thermo Fisher Scientific), containing 10% FBS (#F7524, Sigma-Aldrich) and 1% Pen/Strep (#15140-130, Thermo Fisher Scientific). Normal human male foreskin fibroblasts HFF-1 (#SCRC-1041, ATCC; RRID: CVCL_3285), and human female embryonic kidney HEK293FT (#R70007, Invitrogen; RRID: CVCL_6911) cells were cultured in DMEM GlutaMAX (#31966047, Thermo Fisher), containing 10% FBS and 1% Pen/Strep. Human female bone osteosarcoma Saos-2 cells (#HTB-85, ATCC; RRID: CVCL_0548) were cultured in McCoy’s 5A medium (#16600082, Thermo Fisher Scientific), containing 10% FBS and 1% Pen/Strep.
The HEK293FT cells were purchased from Invitrogen, whereas HFF-1 and Saos-2 were purchased from ATCC at the initiation of the project. The identity of the WI-26 cells was validated using the Short Tandem Repeat (STR) profiling service, provided by Multiplexion GmbH. The identity of the human embryonic kidney HEK293FT cells was validated by the Multiplex human Cell Line Authentication test (Multiplexion GmbH), which uses a single nucleotide polymorphism (SNP) typing approach, and was performed as described at https://www.multiplexion.de/. All cell lines were regularly tested for Mycoplasma contamination, using a PCR-based approach and were confirmed to be Mycoplasma-free.
Transient DNA transfections
Plasmid DNA transfections were performed using the X-tremeGENE HP DNA transfection reagent (#06366236001, Roche) in a 2:1 DNA/transfection reagent ratio when the cells reached approx. 70% confluency, according to the manufacturer’s protocol. Twenty-four hours post-transfection, cells were treated as indicated in the figures with 100 nM Rapamycin and either lysed for immunoblotting or fixed for immunofluorescence.
Generation of stable cell lines
Stable cell lines were generated using a doxycycline-inducible sleeping beauty-based transposon system (Kowarz et al., 2015), transfecting WI-26 cells with the transposon-flanked GFP-APEX2 and GRASP55-APEX2 constructs (into the pITR-TTP vector; see ‘Plasmid’ section below) in a 10:1 ratio together with the transposase expressing pCMV-Trp vector. Twenty-four hours post-transfection, puromycin (2 μg/ml) was added to the medium and cells were selected for 5 days. Single cell colonies were picked using cloning cylinders (#CLS31668, Sigma-Aldrich) and expanded. Doxycycline-induced expression of recombinant proteins (1 μg/ml Doxycyclin, 24 h) was validated by immunoblotting, using an anti-Myc antibody.
Generation of knock-out cell lines
Knock-out cell lines were generated using the CRISPR/Cas9 system developed by the Zhang lab (Ran et al., 2013). In brief, double-stranded DNA oligos that encode guide RNAs (gRNAs) against target genes were cloned into the BbsI restriction sites of the PX459 vector. The oligo sequences used for the sgRNA expression plasmids to generate the GRASP55 and TSC2 CRISPR/Cas9 KO lines are provided in Table S9.
Cells were transfected with the resulting vectors and selected with puromycin (2 μg/ml) for 5 days. Single cell clones were picked using cloning cylinders (#CLS31668, Sigma-Aldrich) and knock-out clones were validated by genomic DNA sequencing and immunoblotting. The respective control cell lines were generated by using the empty vector and following the same procedure described above for the knock-out cell lines.
Gene silencing experiments
Transient knock-down of target genes was achieved by transfecting cells with double-stranded, target-specific Stealth RNAi siRNA complexes (Thermo Fisher Scientific) for human GRASP55 (hGRASP55-T2: 5′ CAACAGUACCGUUAUUGCCACCACA 3′), Silencer Select siRNAs (Ambion) for mTOR (#4390824, siRNA ID: s603), RAPTOR (#4392420, siRNA ID: s33214) and RICTOR (#4392420, siRNA ID: s226001), siGENOME set of 4 siRNA reagents for TSC2 (MQ-003029-03-0002, Horizon Discovery), or Stealth RNAi Med GC negative control siRNA (#12935-113, Thermo Fisher Scientific). In brief, 105 cells per well were seeded in 6-well plates and transfected with siRNAs (final concentration 60 nM; diluted in 100 μL DMEM), using 8 μL HiPerFect transfection reagent (#301705, QIAGEN) per well. For the mTOR, RAPTOR, RICTOR knock-downs, the final siRNA concentration was adjusted to 80 nM. The siRNA-HiPerFect complexes were formed by 15 min incubation at room temperature and the mix was added to cells drop-wise. Cells were harvested or fixed 72 to 96 h post-transfection. Knock-down efficiency was verified by immunoblotting.
Method details
Cell treatments
For pharmacological inhibition of mTOR, cells were treated with 100 nM Rapamycin (J62473.MF, Alfa Aesar) or 250 nM Torin1 (Cay10997-10, Cayman Chemical) for 4 h, except for the MMP2 secretion/activity experiment (Figure 7) where cells were treated with Torin for 24h. For S6K inhibition (S6Ki), cells were treated with 20 μM PF-4798671 (S2163, Selleckchem) for 6 h. The treatments were performed by replacing the culture media with drug-containing media. For amino acid starvation experiments, culture media were replaced with amino-acid-free DMEM/F12 (D9811-01, US Biologicals) containing dialyzed FBS (F0392, Sigma-Aldrich) for 4 h. For serum starvation, cells were cultured in FBS-free DMEM/F12 for 6 h. To induce hyperosmotic stress, 5 M NaCl solution was added to the culture media to increase NaCl concentration by 100 mM. Increasing the NaCl concentration by 100 mM to full, serum-containing media raises osmolality from 320-360 mOsm kg-1 to ca. 500 mOsm kg-1 (Demetriades et al., 2016; Plescher et al., 2015). Cells were kept in hyperosmotic media for 1 h. Energetic stress was induced by first incubating cells in low-glucose DMEM (10567014, Thermo Fisher Scientific) containing dialyzed FBS (F0392, Sigma-Aldrich) for 1h, followed by 1h treatment with 40 mM 2-deoxyglucose (2-DG; D8375, Sigma-Aldrich) in low-glucose DMEM containing dialyzed FBS. For hypoxia experiments, cells were incubated in a hypoxic cell culture incubator (1% O2, 5% CO2, 37°C) for 16 h. For microscopy experiments visualizing autophagosomes, cells were also treated with 100 nM BafA (#88899-55-2, Alfa Aesar) to inhibit autophagosomal fusion with lysosomes and facilitate imaging.
Plasmid constructs
Plasmid expression vectors were generated by cloning PCR-amplified cDNAs, using appropriate primers. All primer sequences are listed in Table S9. For cDNA generation, total RNA was isolated from mouse wild-type brain or from human WI-26 fibroblasts using a standard Trizol/chloroform-based extraction (15596018, Thermo Fisher Scientific), and converted to cDNA using Superscript II (#18064014, Thermo Fisher Scientific). For bacterial expression of GST-tagged 4E-BP1, human EIF4EBP1 (4E-BP1; NM_004095.4) was amplified from WI-26 cDNA using the Q5 high-fidelity DNA polymerase (M0491, NEB) and cloned into the EcoRI/XhoI restriction sites of a pGEX-6P-2 vector system. For the construction of the TMEM59 expression vector, human TMEM59 (NM_001305043.2) was amplified from WI-26 cDNA and cloned into the EcoRI/XhoI restriction sites of the pcDNA4/TO/Myc-His plasmid (V103020, Invitrogen). The pcDNA4/TO-hGRASP55-Myc-His and pGEX6P2-hGRASP55 plasmid constructs were described previously (Nüchel et al., 2018). The Myc-tagged human GRASP65 expression construct (pcDNA4/TO-GRASP65-Myc-His) was generated by PCR amplification of the human GRASP65 sequence from WI-26 cDNA using the Q5 high-fidelity DNA polymerase (M0491, NEB) and cloned as an EcoRI/SalI fragment into the EcoRI/XhoI restriction sites of the pcDNA4/TO-Myc-His plasmid (V103020, Invitrogen).
The pcDNA3-FLAG-mTOR WT plasmid was provided by Jie Chen via Addgene (plasmid #26603) and described in Vilella-Bach et al. (1999), whereas the pRK5-HA-RAPTOR plasmid was provided by David Sabatini via Addgene (plasmid #8513) and described in Kim et al. (2002). The pSpCas9(BB)-2A-Puro (PX459) V2.0 plasmid was provided by Feng Zhang via Addgene (plasmid #62988) and described in Ran et al. (2013).
The GRASP55-APEX2 fusion construct was generated by cloning the APEX2 sequence from a pcDNA6-5HT6-APEX2 plasmid (kind gift of Bernhard Schermer; described in Kohli et al., 2017) in-frame with the C terminus of GRASP55, using the XhoI/XbaI cloning sites of pcDNA4/TO-GRASP55-Myc-His. The GRASP55-APEX2-Myc-His sequence was then subcloned into the sleeping-beauty-based, doxycycline-inducible pITR-TTP vector (kind gift of Manuel Koch and Rolf Marschalek; described in Kowarz et al., 2015; Huyghe et al., 2020; Wang et al., 2018) using the SfiI/NotI restriction sites. Similarly, the GFP-APEX2 fusion construct was generated by first cloning the GFP coding sequence into the BamHI/XhoI restriction sites of the pcDNA4/TO/Myc-His vector, and the APEX2 sequence into the XhoI/XbaI sites. The GFP-APEX2-Myc-His fragment was then subcloned into the SfiI/NotI restriction sites of the doxycycline-inducible pITR-TTP vector.
The GRASP55ΔG2-FLAG-Giantin-CT fusion construct was generated by first removing the glycine residue in position 2 by PCR amplification of human GRASP55 from the pcDNA4/TO-hGRASP55-Myc-His and cloning the modified fragment back into the EcoRI/XhoI restriction sites of the pcDNA4/TO/Myc-His vector. The essential domain for Golgi localization of human Giantin (aa 2881-3225; Misumi et al., 2001) was PCR-amplified from human cDNA and cloned into the XhoI/XbaI restriction sites of the pcDNA4/TO-GRASP55ΔG2-Myc-His, with a FLAG tag at its N terminus and with a stop codon at its C terminus, thus lacking the Myc-His C-terminal tag.
The GRASP55-GRASP65 chimeric expression constructs were generated by combining the GRASP55 PDZ domains with GRASP65 SPR, and vice versa, using GeneArt strings (Thermo Fisher Scientific). For the GRASP55-65 chimeric construct, the C-terminal half (aa 205-452) of human GRASP55 was exchanged with the C-terminal half of human GRASP65 (aa 205-440) using the internal BsrGI restriction site and the XhoI cloning site of the pcDNA4/TO-GRASP55-Myc-His construct. For the GRASP65-55 chimeric construct, the C-terminal half of human GRASP65 (aa 205-440) was exchanged with the C-terminal half of human GRASP55 (aa 205-452) using the internal NaeI restriction site and the NotI cloning site of the pcDNA4/TO-GRASP55-Myc-His plasmid.
To identify the mTORC1 phosphorylation sites on GRASP55, we sequentially generated non-phosphorylatable alanine mutants, starting from mutating all threonine or all serine residues in the GRASP55 SPR region, and gradually narrowing down the sites, using Phos-tag gel analysis to assess GRASP55 phosphorylation. This approach identified a quintuple GRASP55 mutant (containing T232/249/250/257/264A, namely GRASP55-5TA) that lacks mTORC1-mediated GRASP55 phosphorylation, with Thr-264 (GRASP55-T264A) seemingly playing a key role. All GRASP55 alanine mutant expression constructs were generated using GeneArt Strings (Thermo Fisher Scientific) and cloned into the pcDNA4/TO-GRASP55-Myc-His vector using the BsrGI and the XhoI restriction sites.
All restriction enzymes were purchased from New England Biolabs. The integrity of all constructs was verified by sequencing.
Antibodies
Antibodies against total AMPK (#5831, RRID: AB_10622186), phospho-AMPK T172 (#2535, RRID: AB_331250), total AKT (#4691, RRID: AB_915783), phospho-AKT S473 (#4060, RRID: AB_2315049), total p38 MAPK (#8690, RRID: AB_10999090), phospho-p38 MAPK T180/Y182 (#4511, RRID: AB_2139682), Myc-tag (#2278, RRID: AB_490778; rabbit monoclonal, used for co-stainings of the Myc-tagged GRASP55/65 chimeras with GM130), MMP2 (#40994, RRID: AB_2799191), mTOR (#2972, RRID: AB_330978, used for immunoblotting; #2983, RRID: AB_2105622, used for immuno-EM), Raptor (#2280, RRID: AB_561245), Rictor (#2114, RRID: AB_2179963), 4E-BP1 (#9644, RRID: AB_2097841), total S6 (#2217, RRID: AB_331355), phospho-S6 S235/S236 (#4858, RRID: AB_916156), and TSC2 (#4308, RRID: AB_10547134) proteins were purchased from Cell Signaling Technology. A mouse monoclonal antibody against 58K Golgi protein (ab27043, RRID: AB_2107005; used for immuno-EM) was obtained from Abcam. The mouse monoclonal ACTB/actin (#612656, RRID: AB_2289199), and mouse monoclonal GM130 (#610823, RRID: AB_398141; used for co-stainings with endogenous GRASP55 and the Myc-tagged GRASP55/65 chimeras) antibodies were purchased from BD Transduction Laboratories. The mouse anti-FLAG M2 (#F1804, RRID: AB_262044; used in the GRASP55ΔG2-FLAG-Giantin-CT co-staining experiments with LC3B and CHMP2A), and the anti-LC3B (#L7543, RRID: AB_796155) antibodies were purchased from Sigma-Aldrich. The rabbit polyclonal anti-FLAG (#20543-1-AP, RRID: AB_11232216; used in the GRASP55ΔG2-FLAG-Giantin-CT co-staining experiments with GM130), rabbit polyclonal anti-GRASP55 (#10598-1-AP, RRID: AB_2113473), mouse monoclonal anti-GRASP55 (#66627-1-Ig, RRID: AB_2881987), rabbit polyclonal anti-GM130 (#11308-1-AP, RRID: AB_2115327; used for co-staining experiments with the Myc-tagged GRASP55 alanine mutants), anti-CHMP2A (#10477-1-AP, RRID: AB_2079470), anti-TMF1 (#19728-1-AP, RRID: AB_10667009), anti-TMEM59 (#24134-1-AP, RRID: AB_2879439), and anti-USO1 (#13509-1-AP, RRID: AB_2257094) antibodies were purchased from Proteintech. The mouse monoclonal Myc-tag antibody (clone 9E10, #sc-40, RRID: AB_2857941) used in immunoblotting and IFs (for the Myc-tagged GRASP55 alanine mutants) was obtained from Santa Cruz Biotechnology. Antibodies against BLZF1/GOLGIN-45 (#GTX116434, RRID: AB_11168554), SCAMP3 (#GTX102216-25, RRID: AB_1241293), and HIF1α (#GTX127309-25, RRID: AB_2616089) were obtained from Genetex. The anti-GRASP65 antibody (#NBP2-02665, RRID: AB_2724399) was purchased from Novus Biologicals, whereas the anti-TGM2 antibody (#MA5-12739, RRID: AB_10985077) was purchased from Thermo Fisher Scientific. F-actin was visualized with Alexa Fluor 647-conjugated phalloidin (#A22287, Life Technologies). Nuclei were stained with DAPI (#D9542, Sigma-Aldrich). For all immunofluorescence experiments, highly cross-adsorbed Alexa Fluor 488, 555 or 647 secondary antibodies were used (#A-11001, RRID: AB_2534069; #A-21424, RRID: AB_141780; #A-21235, RRID: AB_2535804; #A-11034, RRID: AB_2576217; #A-21428, RRID: AB_141784; #A-21245, RRID: AB_2535813, from Life Technologies). For immunoblotting experiments, secondary antibodies coupled to horseradish peroxidase (HRP) (#P0399, RRID: AB_2617141; #P0260, RRID: AB_2636929) were purchased from Agilent/Dako.
Immunoblotting, Phos-tag and detection assays
For SDS-PAGE and immunoblotting experiments, cells from a well of a 6-well plate, at approximately 90% confluence, were lysed in-well with 300 μL of ice-cold Triton lysis buffer (50 mM Tris-HCl (pH 7.5), 0.5% Triton X-100, 150 mM NaCl, 0.1% SDS), supplemented with protease inhibitor (#P8340, Sigma-Aldrich) and phosphatase inhibitor (#4906837001, Sigma-Aldrich) cocktails, and sonicated (4 s, 30% amplitude, 4°C) using a Vibra-Cell sonicator (#75115, Fisher Scientific). Samples were clarified by centrifugation (15 min, 12,000 x g, 4°C) to remove debris and subjected to SDS-PAGE. Proteins were transferred to a PVDF membrane (IPVH00010, Merck Millipore), and membranes were stained with Ponceau S, blocked with 5% nonfat dry milk in TBS-T buffer (50 mM Tris-HCl (pH 7.4), 150 mM NaCl, 0.1% Tween-20) for total protein immunoblots or Roti-Block (#A151.4, Roth) for phospho-protein immunoblots, and incubated with primary antibodies diluted in TBS-T, for 1 h at RT or overnight at 4°C, followed by incubation with appropriate HRP-conjugated secondary antibodies (Agilent/Dako) for 1 h at RT. Signals were detected by enhanced chemiluminescence (ECL). Quantification of immunoblots was performed by densitometric analysis of the band intensities, using the Gel analysis tool of the ImageJ software (Schneider et al., 2012).
For protein secretion experiments, serum-free supernatants were centrifuged (5 min, 2000 x g, 4°C) to remove dead cells and debris. Cleared culture supernatants were concentrated using 3 kDa cut-off concentrator tubes (#516-0227P, VWR) according to the manufacturer’s instructions, Laemmli loading buffer (1x final concentration; 4x Laemmli sample buffer composition: 250 mM Tris-HCl pH 6.8, 8% SDS, 40% glycerol, 200 mM DTT, 0.02% bromophenol blue) was added to the concentrated supernatants, and samples were analyzed by immunoblotting as described above.
Phos-tag gels were produced by adding 20 μM Phos-tag reagent (#AAL-107, FUJIFILM Wako Chemicals) and 40 μM MnCl2 to the separating gel solution prior to polymerization. MnCl2 was also added to the samples at a final concentration of 1 mM prior to boiling. Before blotting, the gel was soaked in blotting buffer (50 mM boric acid/NaOH pH 8.5, 10% MeOH) containing 1 mM EDTA for 10 min to remove the manganese ions from the gel, followed by a 10 min incubation in blotting buffer to remove EDTA. Quantification of GRASP55 phosphorylation was performed by densitometric analysis of the band intensities, using the Gel analysis tool of the ImageJ software, and normalized to total GRASP55 levels.
Lambda-phosphatase treatment assays
Lambda-phosphatase (λ-PPase) treatment experiments were performed to assess the phosphorylation status of the GRASP55 bands, running as a doublet in Phos-tag gels. These data clearly show that the upper GRASP55 band in Phos-tag gels corresponds to a phosphorylated GRASP55 form, as it disappears upon λ-PPase treatment, whereas the lower band corresponds to non-phosphorylated GRASP55, as it is unaffected (i.e., does not migrate further down) by λ-PPase treatment. We note that GRASP55 phosphorylation (i.e., the upper GRASP55 band in Phos-tag gels) is only present under basal, non-stressed conditions, when mTORC1 is active. Any treatment that inhibits mTORC1 (starvation, pharmacological, stress) leads to GRASP55 dephosphorylation, i.e., loss of the upper phospho-GRASP55 band that collapses to the lower-migrating non-phospho-GRASP55 band. Therefore, we could only assess the effect of λ-PPase on GRASP55 phosphorylation and migration in Phos-tag gels under basal culture conditions.
In brief, for λ-phosphatase experiments, cells were lysed in 300 μL ice-cold Triton lysis buffer (50 mM Tris-HCl (pH 7.5), 0.5% Triton X-100, 150 mM NaCl, 0.1% SDS), supplemented with protease inhibitors (#P8340, Sigma-Aldrich), as described above, and 100 units of λ-phosphatase (#P0753, New England Biolabs) were added to the lysates, followed by 30 min incubation at 30°C. Laemmli loading buffer (1x final concentration) was added to the reactions and samples were analyzed by immunoblotting as described above.
Data shown in figures are representative of at least 3 replicate experiments and are presented in graphs as mean ± SD. ∗ p < 0.05, ∗∗ p < 0.01, ∗∗∗ p < 0.005.
Production of GST-tagged recombinant proteins in bacteria
GST fusion proteins were produced from pGEX-6P vectors containing the cDNA of interest (see above) in E. coli BL21 bacteria according to standard procedures. In brief, expression of GST and GST-4E-BP1 proteins was induced with IPTG (3 h, 30°C), whereas GST-GRASP55-expressing bacteria were collected 16 h post-IPTG induction at 28°C. GST fusion proteins were purified using glutathione Sepharose (#17075601, GE Healthcare) and eluted with 40 mM reduced glutathione (#G4251, Sigma-Aldrich).
In vitro kinase assay
For the mTORC1 in vitro kinase assays, kinase complexes purified from HEK293FT cells were mixed with bacterially purified GST-GRASP55, GST-4E-BP1 or GST substrates. In brief, two 10 cm dishes were transiently transfected at 80% confluency with FLAG-mTOR and HA-RAPTOR expressing plasmids, using X-tremeGENE HP (#06366236001, Roche) in a 2:1 DNA/transfection reagent ratio, according to the manufacturer’s protocol. Twenty-four hours post-transfection, cells were stimulated with 100 mM insulin (#I9278, Sigma-Aldrich) for 2 h and harvested in mTOR lysis buffer (40 mM HEPES/KOH (pH 7.4), 2 mM EDTA, 0.3% CHAPS, 1x protease, 1x phosphatase inhibitors), with 20 strokes using a glass Dounce homogenizer at 4°C. The lysates were incubated on ice for 15 min, and cleared by centrifugation (8 min, 16.200 x g, 4°C). The supernatant was transferred to a new tube and incubated with 60 μL FLAG M2 affinity gel (#A2220, Sigma-Aldrich) (pre-washed three times with lysis buffer), rotating for 2 h at 4°C. The mTORC1 immunoprecipitates were then washed 1x with low-salt wash buffer (40 mM HEPES/KOH (pH 7.4), 150 mM NaCl, 2 mM EDTA, 0.3% CHAPS, 1x protease inhibitors, 10 mM β-glycerophosphate), 2x with high-salt buffer (40 mM HEPES/KOH (pH 7.4), 400 mM NaCl, 2 mM EDTA, 0.3% CHAPS, 1x protease inhibitors, 10 mM β-glycerophosphate), and 2x with KCl wash buffer (25 mM HEPES/KOH (pH 7.4), 20 mM KCl). The CHAPS detergent (3% stock solution in water, kept at 4°C), protease and phosphatase inhibitors were added fresh to the lysis and wash buffers, shortly before use. Equal amounts of the immunoprecipitates were diluted in 3x kinase assay buffer (75 mM HEPES/KOH (pH 7.4), 60 mM KCl, 30 mM MgCl2) and 500 ng of either GST, GST-4E-BP1 or GST-GRASP55 purified protein was added to the reaction. The kinase reaction was initiated by adding 125 μM ATP and 0.2 MBq [32P]-ATP (stock concentration 0.37 MBq/μl; #FP-301, Hartmann Analytics) in start buffer (25 mM HEPES/KOH (pH 7.4), 140 mM KCl, 10 mM MgCl2), in the presence of 100 nM Torin or DMSO. Samples were incubated for 60 min at 30°C, with gentle mixing every 10 min. The kinase reaction was stopped by boiling the samples in 1x Laemmli buffer (containing 50 mM DTT), for 5 min. Samples were then subjected to SDS-PAGE. After Coomassie staining, the gel was dried and bands were visualized by autoradiography.
Co-immunoprecipitation (with cross-linking)
Co-immunoprecipitation experiments were performed with WI-26 cells treated for 4h with Rapamycin or DMSO as control. Cells were washed twice with ice-cold PBS and proteins were cross-linked using 2 mM dithiobis[succinimidylpropionate] (DSP; #22585, Thermo Scientific) in PBS for 2 h in the cold room. The reaction was quenched by adding 50 mM Tris-HCl pH 7.5, cells were lysed in 500 μL Triton lysis buffer (50 mM Tris-HCl (pH 7.5), 0.5% Triton X-100, 150 mM NaCl, 0.1% SDS, 1x protease, 1x phosphatase inhibitors) using a glass Dounce homogenizer and incubated for 30 min on ice. Homogenates were clarified by centrifugation (10 min, 12,000 x g) and pre-cleared with 30 μL protein G agarose beads (#11719416001, Sigma-Aldrich) for 1 h at 4°C, prior to incubation with 2 μg of anti-GRASP55 monoclonal antibody or 1 μL of crude mouse serum as negative control for 3-4 h at 4°C, under constant agitation. Complexes were incubated overnight with 40 μL protein G agarose beads, washed 4x with lysis buffer, boiled in 1x Laemmli sample buffer (5 min, 95°C) to reverse cross-links, and separated by SDS-PAGE. Input samples (50 μl) were collected before pre-clearing, 1x Laemmli loading buffer was added to the lysates, samples were boiled and analyzed by immunoblotting.
Immunofluorescence and confocal microscopy
For confocal microscopy experiments, cells were grown on glass coverslips and treated as described in the figure legends. All samples are co-treated with 100 nM Bafilomycin A1 (BafA1) to block autophagic flux. Cells were fixed for 10 min at RT with 4% formaldehyde in PBS or for 5 min at −20°C with 100% ice-cold methanol (for LC3B staining only), permeabilized with 0.5% NP-40 (I8896, Sigma-Aldrich) in PBS for 10 min, blocked with 1% FBS in PBS for 30 min, and incubated with primary antibodies diluted in 1% FBS in PBS for 1 h at RT, washed 3x with blocking buffer, and incubated with appropriate highly cross-adsorbed secondary antibodies conjugated to Alexa Fluor 488, 555 or 647 (Thermo Fisher Scientific) and DAPI (0.1 μg/ml; Sigma-Aldrich) for 1 h at RT. Samples were mounted with Dako fluorescent mounting medium (#S3023, Agilent/Dako). Images were acquired by confocal microscopy using a Leica SP5 system controlled by the LAS AF 3 software (Leica Microsystems). Image and colocalization analysis were performed using ImageJ. The Pearson’s correlation coefficient was calculated with the JACoP plugin for ImageJ (Bolte and Cordelières, 2006) as described previously (Nüchel et al., 2018), using 50 individual cells per condition per replicate. Data shown are representative of at least 3 replicate experiments. Data are presented as mean ± SD. ∗ p < 0.05, ∗∗ p < 0.01, ∗∗∗ p < 0.005.
Immunoelectron microscopy
For immuno-EM experiments, WI-26 cells were treated with DMSO or 100 nM Rapamycin for 4h, in the presence of 100 nM BafA1 and harvested by centrifugation (5 min, 250 x g). Each sample (5x10⁶ cells) was gently transferred into a 1 mL sample tube and centrifuged at 2,500 x g for 20 min. Pellets were fixed in 2.5% glutaraldehyde in 0.1 M sodium cacodylate (pH 7.2) for 2 h at 4°C and subsequently washed with 0.15 M cacodylate (pH 7.2). Samples were then post-fixed with 1% osmium tetroxide and 0.15 M sodium cacodylate (pH 7.2) for 1 h at 4°C, washed 3x with 1 mL 0.15 M sodium cacodylate (pH 7.2), and further processed for transmission electron microscopy according to standard protocols. Briefly, the fixed and washed samples were dehydrated in ethanol and further processed for routine Epon embedding. Sections were cut with an LKB ultratome equipped with a diamond knife and mounted on Formvar-coated nickel grids.
Prior to immunostaining, grids were subjected to antigen unmasking with sodium metaperiodate as described previously (Stirling and Graff, 1995). Grids were incubated in a humidified chamber on 100 μL drops of a saturated sodium metaperiodate aqueous solution for 1 h at RT. For immunostaining, the grids were floated on 100 μL drops of immune reagents displayed on a sheet of Parafilm in a humidified chamber. Free aldehyde groups were blocked with 50 mM glycine, and the grids were then incubated with 5% donkey serum (ab7475, Abcam) in incubation buffer (0.2% BSA-c (#900.022, Aurion) in PBS, pH 7.6) for 15 min. The blocking procedure was followed by overnight incubation with the following primary antibodies at 4°C: mouse monoclonal anti-GRASP55 antibody (#66627-1-Ig, Proteintech; dilution 1:80), rabbit polyclonal anti-GRASP55 (#10598-1-AP, Proteintech; dilution 1:80; for co-stainings with 58K Golgi protein), mouse monoclonal antibody against 58K Golgi protein (ab27043, Abcam; dilution 1:80), rabbit polyclonal antibody against CHMP2A (#10477-1-AP, Proteintech; dilution 1:80), a rabbit polyclonal antibody specific for LC3B (#L7543, Sigma-Aldrich; dilution 1:50), or rabbit monoclonal antibody against mTOR (#2983, CST, dilution 1:80). After washing the grids in a large volume (200 ml) of incubation buffer, staining with the gold-particle-conjugated antibodies was performed by floating the grids on drops containing the gold conjugate reagents (diluted 1:20 in incubation buffer) for 60 min at RT. After additional washes (3x in 50 mL incubation buffer each), the sections were post-fixed in 2% glutaraldehyde. Finally, sections were washed with distilled water and post-stained with uranyl acetate and lead citrate. Specimens were observed in a Philips/FEI CM100 transmission electron microscope (Philips/FEI) operated at 80 kV accelerating voltage, and images were recorded with a side-mounted Olympus Veleta camera (Olympus) with a resolution of 2048 × 2048 pixels.
Quantifications of gold particles are derived from 50 cellular profiles (50 μm2 each) per experimental condition. For this purpose, randomly selected areas from 5 different ultrathin sections were assessed. On each area, 1-5 different organelles were evaluated.
APEX2-based proximity biotin ligation assay (proximome)
To also capture weak or transient protein-protein interactions—in addition to more stable interactions—we utilized a H2O2-inducible, APEX2 proximity-based biotinylation system, adapted from Kohli et al. (2017) (Figure 4A). This assay is based on APEX2 catalyzing the H2O2-dependent protein oxidation and can be used in combination with phenol-biotin labeling to biotinylate proximal proteins in live cells (Hung et al., 2016). Although the labeling radius of APEX2 has not been determined precisely, it is estimated to be in the range of 20 nm (Martell et al., 2012). Therefore, this technique allows us to interrogate not only the direct interactome but also the molecular environment of GRASP55, and how this is modulated by mTORC1 inhibition. To describe the full set of GRASP55 proximal proteins—regardless of whether these interact directly with GRASP55 or not—we here use a new term, the ‘proximome’ (Valerius et al., 2019). To determine how the GRASP55 proximome is modified in response to Rapamycin, we generated stable cell lines that express C-terminally fused GRASP55 (GRASP55-APEX2) or GFP (GFP-APEX2) proteins to APEX2. Three independent biological replicates were used per condition and the full dataset is provided in Table S1.
In brief, expression of the fusion proteins was induced by doxycycline treatment (24 h, 1 μg/ml), and the GFP-APEX2- or GRASP55-APEX2-expressing cells were treated with DMSO or 100 nM Rapamycin for 3.5 h before labeling. Cells were labeled by the addition of 500 μM biotin-phenol (#LS-3500, Iris Biotech) to the medium for 30 min, followed by addition of 1 mM H2O2 for 1 min to induce the biotinylation reaction (biotin labels shown as blue marks on the plates in Figure 4A). Cells were then washed 3x with quenching buffer (1x PBS, 10 mM sodium azide, 10 mM sodium ascorbate, 5 mM Trolox (6-hydroxy-2,5,7,8-tetramethylchroman-2-carboxylic acid) (#238813, Sigma-Aldrich)). After washes, cells were either fixed for immunofluorescence analysis or lysed for immunoblotting or mass spectrometry.
For proteomic analysis of the GRASP55 proximome, cells were lysed in 1 mL Triton lysis buffer (see above), supplemented with 10 mM sodium azide, 10 mM sodium ascorbate and 5 mM Trolox (#238813, Sigma-Aldrich). Crude lysates were sonicated (2 × 4 s, 30% amplitude), incubated on ice for 20 min, and clarified by centrifugation (15 min, 12.000 x g, 4°C). The supernatant was incubated with 60 μL streptavidin Sepharose beads (GE17-5113-01, Sigma-Aldrich) overnight at 4°C. The beads were then washed sequentially 2x with 1 mL lysis buffer; 1x with 1 mL 10 mM Tris-HCl pH 7.5, 2 M urea; 2x with 1ml lysis buffer; and 1x with 1 mL PBS. Between washes, beads were spun down (5 min, 2300 x g, 4°C) and wash buffer was removed. Biotinylated proteins were eluted by incubating the beads (30 min, 56°C) in 1x Laemmli buffer, containing 50 mM DTT. For mass spectrometry, samples were alkylated using 40 mM chloracetamide (CAA) and run on a stacking gel. When the sample was completely inside the stacking gel, each lane was excised and fixed with 10% acetic acid / 20% methanol for 1 h at room temperature. Samples were then dehydrated and in-gel digested overnight with trypsin (#37286, Serva) / lysyl endopeptidaseR (LysC) (#129-02541, FUJIFILM Wako Chemicals). Digestion was stopped by adding 0.5% formic acid to the reaction and the peptides were subjected to StageTip purification, before injection into the mass spectrometer.
Although we validate several of the proximome hits as GRASP55 interactors with co-IP and colocalization/IF experiments, which suggests that the majority of the proteins identified are true hits, such proteomics experiments can often miss a number of true interactors (false negatives) or identify false positives. In proximity biotin-ligation-based proteomics, in particular, false positives may include proteins that bind non-specifically to beads, endogenously biotinylated proteins, or other highly abundant bystanders (Walzthoeni et al., 2012). In fact, several mitochondrial proteins are known to be endogenously biotinylated (Tong, 2013). Therefore, we cannot exclude that some false positives may also exist in our proximome hit list.
DAB staining and transmission electron microscopy
The 3,3′-diaminobenzidine (DAB) staining experiments were performed as described in Martell et al. (2017), with minor modifications. Briefly, GRASP55-APEX2-expressing cells were cultivated on Aclar foil (Plano) in 6-well dishes and treated with 100 nM Rapamycin or DMSO for 4 h before fixing with DAB fixation solution (2% glutaraldehyde, 2% sucrose, in PBS pH 7.4) for 1 h at RT. Samples were then washed 2x 5 min at RT with 0.1 M cacodylic acid (Applichem). To quench glutaraldehyde, samples were washed 2x 20 min with quenching buffer (100 mM glycine, 0.1 M cacodylic acid) at RT. For the DAB staining, samples were incubated with DAB in 0.1 M cacodylic acid (0.5 mg/ml) for 30 min at RT. After three washes with 0.1 M cacodylic acid for 5 min at RT, samples were post-fixed for 30 min at 4°C with 1% osmium tetroxide / 1.5% potassium hexacyanoferrate in HPLC-water. Following 3x 5 min washes with ddH2O at 4°C, samples were dehydrated sequentially for 5 min in 50% EtOH, 5 min in 70% EtOH, 10 min in 90% EtOH and 3x 5 min in 100% EtOH (with molecular sieve), followed by overnight incubation in 50% Epon (#45345, Sigma-Aldrich) in EtOH at 4°C. On the next day, samples were incubated in pure Epon for 2 h at 4°C, and transferred to fresh pure Epon for an additional 2 h at RT. Samples were embedded into TAAB capsules (Plano) and cured for 48 h at 60°C. Ultrathin sections (70 nm) were cut using a Leica EM UC6 ultramicrotome and post-stained with 1.5% uranyl acetate. Images were acquired using a OneView 4K camera (Gatan) mounted on a Jem-2100Plus (Jeol) transmission electron microscope operating at 80kV.
SILAC secretome analysis
For the quantitative analysis of the GRASP55-dependent secretome, SILAC (stable isotope labeling by amino acids in cell culture) experiments were performed with four independent biological replicates, including two independent GRASP55 KO clones and swapping labeling of WT and KO cells with heavy and medium isotopes (or vice versa) to control for labeling bias (see also below). Note that, in secretome (or MMP secretion/activity) studies, full FBS-containing culture media were replaced with media lacking serum for 24h before sample collection, thus removing the highly abundant serum proteins from the medium before protein identification to increase the possibility of detection for lowly abundant secreted proteins.
In brief, wild-type and GRASP55 knock-out cells were pulse-labeled at 70% confluency. Cells were pre-incubated in SILAC medium (Met/Arg/Lys-free DMEM/F12; #AES-0423, Athenaes), supplemented with 1 mM sodium pyruvate (11360070, Thermo Fisher Scientific), 200 mg/L L-proline (#P0380, Sigma-Aldrich), and 10% dialyzed FBS (dFBS; #AES-0427, Athenaes) for 30 min, to deplete intracellular Methionine, Arginine, and Lysine. Cells were then labeled for 6 h in SILAC medium supplemented with 1 mM sodium pyruvate (11360070, Thermo Fisher Scientific), 200 mg/L L-proline (#P0380, Sigma-Aldrich), 10% dFBS, 100 μM azide-group-containing methionine analog azidohomoalanine (AHA; 63669AS, Anaspec), and either heavy (146 μg/ml Lys-8 (13C6,15N2) / 84 μg/ml Arg-10 (13C6, 15N4)) or medium isotopes (146 μg/ml Lys-4 (2H) / 84 μg/ml Arg-6 (13C6)). All isotope-labeled amino acids were purchased from Silantes (#211103913, #201203902, #211603902, #201603902). Subsequently, the labeling was continued for another 24h in serum-free SILAC media, containing 1 mM sodium pyruvate (11360070, Thermo Fisher Scientific), 200 mg/L L-proline (#P0380, Sigma-Aldrich), 100 μM AHA (63669AS, Anaspec), and the corresponding isotope-labeled amino acids, as described above. Supernatants of wild-type heavy isotope-labeled and knock-out medium isotope-labeled cultures were combined, dead cells were removed by centrifugation (5 min, 1000 x g, 4°C), and proteins were concentrated to approximately 250 μl, using Amicon ultra-15, PLBC Ultracel-PL 3 kDa cut-off concentrator tubes (#Z740199, Sigma-Aldrich). Samples from the inverse combination (wild-type medium isotope-labeled and knock-out heavy isotope-labeled cultures) were also prepared to control for labeling bias, and were used as independent biological replicates for subsequent analyses. Cells were lysed in 850 μL of urea lysis buffer provided with the Click Chemistry Capture kit (CLK-1065, Jena Bioscience), according to the manufacturer’s protocol. Supernatants and cell lysates were individually covalently coupled to 200 μL pre-washed (2x with 1 mL HPLC H2O each) alkyne agarose (CLK-1032-2, Jena Bioscience), rotating overnight at RT. Alkyne agarose-bound samples were spun down (5 min, 2000 x g, 4°C), washed once with 1 mL HPLC water, and then reduced with 5 mM DTT (15 min, 70°C), alkylated with 40 mM CAA (30 min, RT), transferred to columns (supplied with the kit) and extensively washed sequentially with SDS wash buffer (supplied with the kit), 100 mM Tris-HCl pH 8.0 / 8 M urea buffer, 20% isopropanol, and 20% acetonitrile (20 mL each). Proteins were then digested overnight with 1 μg trypsin (#37286, Serva) and 0.5 μg LysC (#129-02541, FUJIFILM Wako Chemicals) in a heated shaker (37°C, 800 rpm). Digestion was stopped by adding 0.5% formic acid to the reaction, and the peptides were subjected to StageTip purification, before injection into the mass spectrometer.
Cell surface biotinylation and SILAC surfactome analysis
Cell surface or ECM proteins are also delivered via unconventional secretory pathways (Rabouille, 2017). These proteins are commonly missed by secretome analyses and their detection is technically challenging to date (Schira-Heinen et al., 2019). We, therefore, developed a SILAC- and MS-based, cell surface protein biotinylation protocol, to identify the GRASP55-dependent surfactome (Figure 6A).
For the cell surface biotinylation assays, cells were seeded on 6 cm dishes and grown to 90% confluence. Cells were washed 2x with ice-cold PBS, containing 0.9 mM CaCl2 and 0.5 mM MgCl2, and incubated with 0.5 mg/ml Sulfo-NHS-LC-Biotin (#A8003, Apexbio) in Ca+2/Mg+2-containing PBS for 30 min at 4°C with gentle agitation. Biotinylation was stopped by washing the cells 2x with 100 mM glycine in Ca+2/Mg+2-containing PBS and 2x with PBS. Cells were then lysed in 1 mL Triton lysis buffer (50 mM Tris-HCl (pH 7.5), 0.5% Triton X-100, 150 mM NaCl, 0.1% SDS) containing protease inhibitors, and the lysates were sonicated (2 × 4 s, 30% amplitude, 4°C) using a Vibra-Cell sonicator (#75115, Fisher Scientific), incubated on ice for 20 min, and clarified by centrifugation (10 min, 13.000 x g, 4°C). Cleared lysates were incubated overnight with pre-washed Streptavidin Sepharose beads at 4°C while rolling. The beads were washed 4x with lysis buffer and 1x with PBS, and 1x Laemmli buffer was added before boiling (5 min, 95°C). Samples were analyzed by SDS-PAGE.
For quantitative proteomic analysis of the cell surface proteome, a combined approach of SILAC labeling and cell surface biotinylation was used. Experiments were performed with four independent biological replicates, including two independent GRASP55 KO clones and swapping labeling of WT and KO cells with heavy and medium isotopes (or vice versa) to control for labeling bias. For this purpose, wild-type and GRASP55 knock-out cells were metabolically labeled for two weeks with SILAC medium (Met/Arg/Lys-free DMEM/F12; #AES-0423, Athenaes), supplemented with 17.25 mg/L L-methionine (component of the SILAC medium; #AES-0423, Athenaes), 1 mM sodium pyruvate (11360070, Thermo Fisher Scientific), 200 mg/L L-proline (#P0380, Sigma-Aldrich) and 10% dFBS (dFBS; #AES-0427, Athenaes), containing heavy (146 μg/ml Lys-8 (13C6, 15N2) / 84 μg/ml Arg-10 (13C6, 15N4)) or medium isotopes (146 μg/ml Lys-4 (2H), 84 μg/ml Arg-6 (13C6)). Cells were then grown to 90% confluency in 10 cm dishes, with biotinylation and lysis performed as described above, with the exception that the cleavable Sulfo-NHS-SS-Biotin (#21331, Thermo Fisher Scientific) was used. A portion of the sample (10%) was kept as input control for total proteome analysis. Biotinylated proteins were purified using Streptavidin Sepharose beads as described above. After washes, the beads were reduced in Laemmli buffer, containing 50 mM DTT, and incubated for 30 min at 56°C. Proteins were alkylated with 40 mM CAA for 30 min at room temperature in the dark and run on a stacking gel. After the sample had completely entered the stacking gel, the full lane was excised and fixed with 10% acetic acid / 20% methanol for 1 h at room temperature. Samples were then dehydrated and in-gel digested overnight with trypsin (#37286, Serva) / LysC (#129-02541, FUJIFILM Wako Chemicals). Digestion was stopped by adding 0.5% formic acid to the reaction and the peptides were subjected to StageTip purification, before injection into the mass spectrometer.
Mass spectrometry analysis
Proteomic analysis was performed using an Easy nLC 1000 UHPLC coupled to a QExactive Plus mass spectrometer (Thermo Fisher Scientific). Peptides were resuspended in Solvent A (0.1% FA), picked up with an autosampler and loaded onto in-house made 50 cm fused silica columns (internal diameter 75 μm, packed with C18 Poroshell beads, 2.7 μm, Agilent) at a flow rate of 0.75 μL/min. Depending on sample complexity and preparation method, different segmented acetontrile gradients were used to elute peptides (see ‘HPLC gradients’ in Table S8). Eluted peptides were sprayed into the heated transfer capillary of the mass spectrometer using a nano-electrospray ion source (Thermo Fisher Scientific). The mass spectrometer was operated in a data-dependent mode, where the Orbitrap acquired full MS scans (300-1750 m/z) at a resolution (R) of 70,000 with an automated gain control (AGC) target of 3x10⁶ ions collected within 20 ms. The dynamic exclusion time was set to 20 s. From the full MS scan, the 10 most intense peaks (z ≥ 2) were fragmented in the high-energy collision-induced dissociation (HCD) cell. Collisional energy, ion target and maximum injection time were adapted for the different input samples (see ‘MS settings’ in Table S8).
The raw files were processed using the MaxQuant software (v1.5.3.8) and its implemented Andromeda search engine (Cox et al., 2011). Parameters were set to default values and SILAC labels were included as described in the secretome and surfactome sections above. All raw proteomic data are available via ProteomeXchange with identifier PXD020331.
Gelatin in-gel zymography assays
To analyze MMP2 activity in the cellular supernatants, gelatin zymography was performed. Cells were seeded on 6-well plates and, when they reached approx. 80% confluency, the culture medium was changed to serum-free medium for 24 h. On the next day, supernatants were harvested and centrifuged (5 min, 1000 x g, 4°C) to pellet dead cells and debris. Afterward, the medium was concentrated by 8-fold using 3 kDa cut-off concentrator tubes (#516-0227P, VWR) according to the manufacturer’s instructions. Laemmli loading buffer (without DTT) was added to the concentrated medium and samples were loaded without boiling on a 7% SDS-PAGE gel, containing 1 mg/ml gelatin (#G1890, Sigma-Aldrich). After the run, the gel was washed in zymography wash buffer (50 mM Tris-HCl pH 7.5, 15 mM CaCl2, 1 μM ZnCl2, 2.5% Triton X-100) for 30 min at RT, and incubated in zymography reaction buffer (50 mM Tris-HCl pH 7.5, 15 mM CaCl2, 1 μM ZnCl2, 1% Triton X-100) overnight at 37°C with gentle agitation. On the next day, the gel was stained with Coomassie and imaged with a Gel Doc EZ gel documentation system (Bio-Rad). Gelatin degradation indicating MMP2 activity was calculated by densitometric analysis of the band intensities using ImageJ, as described above. Data shown are representative of at least 3 replicate experiments. Data are presented as mean ± SD. ∗ p < 0.05, ∗∗ p < 0.01, ∗∗∗ p < 0.005.
Fluorescent gelatin matrix degradation assays
For the preparation of fluorescent-gelatin-coated coverslips, a gelatin/sucrose solution (2.5% each) was freshly prepared in PBS and kept at 37°C until usage. Glass coverslips (12 mm diameter) were washed with 20% nitric acid for 30 min at room temperature (RT). After washing thoroughly with deionized water, the coverslips were pre-coated with 50 μg/ml poly-L-lysine (#BSBTAR0003, BOSTER Bio) in dH2O for 20 min at RT, washed once with PBS, and incubated with ice-cold 0.5% glutaraldehyde in PBS on ice for 15 min. Coverslips were then washed 3x with ice-cold PBS and incubated with 125 μg/ml Oregon-Green-488-conjugated gelatin (#G13186, Thermo Fisher Scientific) diluted in gelatin/sucrose solution for 15 min at RT in the dark with gentle rocking. Excess gelatin was washed off with PBS and glutaraldehyde was quenched with 5 mg/ml NaBH4 in dH2O for 15 min at RT. After three washes with PBS, the coated coverslips were sterilized with 70% EtOH for 30 min at RT and stored in sterile PBS in the dark until use.
For the matrix degradation experiments, 5-10 × 104 cells were seeded on the coated coverslips for 24 h, fixed with 4% formaldehyde in PBS for 10 min at RT and counterstained with 0.1 μg/ml DAPI and 15 nM Phalloidin Fluor 647 for 1 h at RT, and mounted using Dako fluorescent mounting medium (#S3023, Agilent/Dako). Relative gelatin degradation was quantified using ImageJ. Data shown are representative of at least 3 replicate experiments. Data are presented as mean ± SD. ∗ p < 0.05, ∗∗ p < 0.01, ∗∗∗ p < 0.005.
Quantification and statistical analysis
General information
All relevant information on the statistical details of experiments is provided in the figure legends. Information on quantifications for each method is provided in the respective Method details section. Data shown in the figures are representative of at least 3 replicate experiments (for proteomics, see below). Data in graphs are represented as mean ± SD. ∗ p < 0.05, ∗∗ p < 0.01, ∗∗∗ p < 0.005.
Statistical analysis for proteomics experiments
The GRASP55 proximome was performed with three independent biological replicates per condition. The secretome and surfactome SILAC experiments were performed with four independent biological replicates, including two independent GRASP55 KO clones. For SILAC experiments, cells were labeled with medium or heavy isotopes as described in the respective Method details section. Wild-type heavy isotope-labeled and knock-out medium isotope-labeled samples were combined prior to sample preparation for mass-spectrometry. Samples from the inverse combination (wild-type medium isotope-labeled and knock-out heavy isotope-labeled cultures) were also prepared to control for labeling bias, and were used as independent biological replicates for subsequent analyses.
Statistical tests for pairwise comparisons (APEX2 proximome; see Table S1) were performed using two-sample two-tailed Student’s t test (Fudge factor [S0] = 0.1) in Perseus (version 1.6.5) (Tyanova et al., 2016). For SILAC experiments, a one-sample t test was performed (Value = 0, S0 = 0.1, side = both), and calculated p values are reported in Tables S4 and S6.
Gene Ontology analysis
Gene Ontology (GO) and pathway enrichment analysis were performed using the Database for Annotation, Visualization and Integrated Discovery (DAVID) tool (Huang et al., 2009a, 2009b). For the APEX2 proximity proteome experiment, proteins whose intensity changed significantly between Rapamycin- and DMSO-treated cells, with log2-transformed fold change (log2FC) values less than −0.6 (enriched in DMSO-treated cells) or higher than +0.5 (enriched in Rapamycin-treated cells), roughly corresponding to the top and bottom 10% of the dataset, were preselected from the list of identified proteins. Only proteins that are robustly enriched in the GRASP55 proximome compared to the GFP proximome in each condition (log2FC > +0.5 in GRASP55_DMSO versus GFP_DMSO for the DMSO-enriched proteins; log2FC > +0.5 in GRASP55_Rapa versus GFP_Rapa for the Rapa-enriched proteins) were used for the DAVID GO analysis (for GOTERM_CC_FAT analysis).
For the analysis of the GRASP-dependent secretome and surfactome, proteins whose intensity changes significantly between GRASP55 knock-out and wild-type cells, with a log2FC < −0,5 and p < 0.05, were used (for GOTERM_CC_FAT, GOTERM_BP_FAT, GOTERM_MF_FAT, and GOTERM_PFAM analyses), based on the same criteria. The human proteome was used as reference list for all analyses. Cellplots were generated using DAVID and the associated Flaski apps (https://flaski.age.mpg.de, developed and provided by the MPI-AGE Bioinformatics core facility) using the 12-15 most significant GO terms from each analysis, except for the APEX2-based proximome dataset for proteins enriched in Rapamycin-treated cells, for which highly redundant GO terms were omitted from the Cellplot to highlight additional representative significant GO terms.
The full list of significantly changing proteins from each experiment (gray dots) was used for generating the Volcano plots. The proteins used for the GO analysis (based on the selection criteria described above for each experiment) are represented by blue or red dots. Proteins corresponding to a representative GO term for each experiment (GO:0000139∼Golgi membrane, for the proximome DMSO dataset; GO:0070161∼anchoring junction, GO:0031988∼membrane-bounded vesicle, and GO:0015629∼actin cytoskeleton, for the proximome Rapamycin experiment; GO:0005576∼extracellular region, and GO:0007155∼cell adhesion, for the GRASP55-dependent secretome dataset; GO:0030054∼cell junction, GO:0048870∼cell motility, and GO:0050839∼cell adhesion molecule binding, for the GRASP55-dependent surfactome dataset) are shown as blue or red dots with a black outline.
Signal peptide sequence analysis
The presence of a signal peptide in the top hits of the GRASP55-dependent secretome and surfactome experiments was assessed using the Signal Peptide website database search function (http://www.signalpeptide.de), filtering for human proteins (3684 signal-peptide-containing protein entries) in the Mammalia dataset. Information on the database features and compilation is provided on: www.signalpeptide.de/?m=hints. Additional information on signal peptide annotation can be found on the UniProt Knowledgebase (UniProtKB) website (https://www.expasy.org/resources/uniprotkb-swiss-prot). The correctness of the records, obtained from the Signal Peptide website, was cross-checked using the Swiss-Prot dataset of human proteins in UniProtKB (https://www.uniprot.org), containing 20396 protein entries (UniProtKB 2021_01 update).
Acknowledgments
We thank Manuel Koch (University of Cologne) and Rolf Marschalek (Goethe University Frankfurt) for sharing plasmids and for valuable advice on the ‘Sleeping Beauty” transposase; Bernhard Schermer (University of Cologne) for help with the APEX2 system; Paola Zigrino (University of Cologne) for advice on the zymography assays; Franziska Metge and Jorge Boucas (MPI-AGE Bioinformatics core facility) for help with the GO analysis and data presentation; Christian Frese (Max Planck Unit for the Science of Pathogens, Berlin; former head of the CECAD/CMMC Proteomics core facility) for valuable advice with the secretome experiments and other members of the facility for assistance with proteomics work; and Felix Babatz and Janine Klask (CECAD Imaging core facility) for help with the DAB staining and EM imaging. We thank the staff in the BioEM Lab, Biozentrum, University of Basel; the Core Facility for Integrated Microscopy (CFIM), Panum Institute (University of Copenhagen); and the Microscopy Facility at the Department of Biology, Lund University, for support with immuno-EM. We would also like to thank Mats Paulsson (University of Cologne) for feedback on the project and Martin Graef (MPI-AGE) for critical reading of the manuscript and insightful suggestions.
C.D. is funded by the European Research Council (ERC) under the European Union’s Horizon 2020 research and innovation programme (grant agreement 757729) and by the Max Planck Society. Parts of this work were supported by the Deutsche Forschungsgemeinschaft (DFG, German Research Foundation) through CRC829 - 73111208 and RU2722 - 407239409 to B.E.
Author contributions
Conceptualization, J.N., C.D., and M.P.; project supervision, B.E., C.D., and M.P.; experiments, J.N., assisted by M.T.; immuno-EM & data analysis, M.M.; mass spectrometry & data analysis, J.L.N., C.T., and C.D.; manuscript draft, C.D., with contributions from J.N. and M.P.; funding acquisition, B.E., C.D., and M.P. All authors approved the final version of the manuscript and agree on the content and conclusions.
Declaration of interests
The authors declare no competing interests.
Published: July 9, 2021
Footnotes
Supplemental information can be found online at https://doi.org/10.1016/j.molcel.2021.06.017.
Contributor Information
Constantinos Demetriades, Email: demetriades@age.mpg.de.
Markus Plomann, Email: markus.plomann@uni-koeln.de.
Supplemental information
References
- Ahat E., Li J., Wang Y. New Insights Into the Golgi Stacking Proteins. Front. Cell Dev. Biol. 2019;7:131. doi: 10.3389/fcell.2019.00131. [DOI] [PMC free article] [PubMed] [Google Scholar]
- Ahmed A.R., Owens R.J., Stubbs C.D., Parker A.W., Hitchman R., Yadav R.B., Dumoux M., Hawes C., Botchway S.W. Direct imaging of the recruitment and phosphorylation of S6K1 in the mTORC1 pathway in living cells. Sci. Rep. 2019;9:3408. doi: 10.1038/s41598-019-39410-z. [DOI] [PMC free article] [PubMed] [Google Scholar]
- Angarola B., Ferguson S.M. Weak membrane interactions allow Rheb to activate mTORC1 signaling without major lysosome enrichment. Mol. Biol. Cell. 2019;30:2750–2760. doi: 10.1091/mbc.E19-03-0146. [DOI] [PMC free article] [PubMed] [Google Scholar]
- Barr F.A. A novel Rab6-interacting domain defines a family of Golgi-targeted coiled-coil proteins. Curr. Biol. 1999;9:381–384. doi: 10.1016/s0960-9822(99)80167-5. [DOI] [PubMed] [Google Scholar]
- Barr F.A., Puype M., Vandekerckhove J., Warren G. GRASP65, a protein involved in the stacking of Golgi cisternae. Cell. 1997;91:253–262. doi: 10.1016/s0092-8674(00)80407-9. [DOI] [PubMed] [Google Scholar]
- Behnia R., Barr F.A., Flanagan J.J., Barlowe C., Munro S. The yeast orthologue of GRASP65 forms a complex with a coiled-coil protein that contributes to ER to Golgi traffic. J. Cell Biol. 2007;176:255–261. doi: 10.1083/jcb.200607151. [DOI] [PMC free article] [PubMed] [Google Scholar]
- Betz C., Hall M.N. Where is mTOR and what is it doing there? J. Cell Biol. 2013;203:563–574. doi: 10.1083/jcb.201306041. [DOI] [PMC free article] [PubMed] [Google Scholar]
- Boada-Romero E., Letek M., Fleischer A., Pallauf K., Ramón-Barros C., Pimentel-Muiños F.X. TMEM59 defines a novel ATG16L1-binding motif that promotes local activation of LC3. EMBO J. 2013;32:566–582. doi: 10.1038/emboj.2013.8. [DOI] [PMC free article] [PubMed] [Google Scholar]
- Bolte S., Cordelières F.P. A guided tour into subcellular colocalization analysis in light microscopy. J. Microsc. 2006;224:213–232. doi: 10.1111/j.1365-2818.2006.01706.x. [DOI] [PubMed] [Google Scholar]
- Brugarolas J., Lei K., Hurley R.L., Manning B.D., Reiling J.H., Hafen E., Witters L.A., Ellisen L.W., Kaelin W.G., Jr. Regulation of mTOR function in response to hypoxia by REDD1 and the TSC1/TSC2 tumor suppressor complex. Genes Dev. 2004;18:2893–2904. doi: 10.1101/gad.1256804. [DOI] [PMC free article] [PubMed] [Google Scholar]
- Buerger C., DeVries B., Stambolic V. Localization of Rheb to the endomembrane is critical for its signaling function. Biochem. Biophys. Res. Commun. 2006;344:869–880. doi: 10.1016/j.bbrc.2006.03.220. [DOI] [PubMed] [Google Scholar]
- Bugatti A., Marsico S., Mazzuca P., Schulze K., Ebensen T., Giagulli C., Peña E., Badimón L., Slevin M., Caruso A. Role of Autophagy in Von Willebrand Factor Secretion by Endothelial Cells and in the In Vivo Thrombin-Antithrombin Complex Formation Promoted by the HIV-1 Matrix Protein p17. Int. J. Mol. Sci. 2020;21:2022. doi: 10.3390/ijms21062022. [DOI] [PMC free article] [PubMed] [Google Scholar]
- Carroll B., Maetzel D., Maddocks O.D., Otten G., Ratcliff M., Smith G.R., Dunlop E.A., Passos J.F., Davies O.R., Jaenisch R. Control of TSC2-Rheb signaling axis by arginine regulates mTORC1 activity. eLife. 2016;5:e11058. doi: 10.7554/eLife.11058. [DOI] [PMC free article] [PubMed] [Google Scholar]
- Chen Y.D., Fang Y.T., Cheng Y.L., Lin C.F., Hsu L.J., Wang S.Y., Anderson R., Chang C.P., Lin Y.S. Exophagy of annexin A2 via RAB11, RAB8A and RAB27A in IFN-γ-stimulated lung epithelial cells. Sci. Rep. 2017;7:5676. doi: 10.1038/s41598-017-06076-4. [DOI] [PMC free article] [PubMed] [Google Scholar]
- Chiritoiu M., Brouwers N., Turacchio G., Pirozzi M., Malhotra V. GRASP55 and UPR Control Interleukin-1β Aggregation and Secretion. Dev. Cell. 2019;49:145–155.e4. doi: 10.1016/j.devcel.2019.02.011. [DOI] [PubMed] [Google Scholar]
- Choo A.Y., Kim S.G., Vander Heiden M.G., Mahoney S.J., Vu H., Yoon S.O., Cantley L.C., Blenis J. Glucose addiction of TSC null cells is caused by failed mTORC1-dependent balancing of metabolic demand with supply. Mol. Cell. 2010;38:487–499. doi: 10.1016/j.molcel.2010.05.007. [DOI] [PMC free article] [PubMed] [Google Scholar]
- Cleyrat C., Darehshouri A., Steinkamp M.P., Vilaine M., Boassa D., Ellisman M.H., Hermouet S., Wilson B.S. Mpl traffics to the cell surface through conventional and unconventional routes. Traffic. 2014;15:961–982. doi: 10.1111/tra.12185. [DOI] [PMC free article] [PubMed] [Google Scholar]
- Cox J., Neuhauser N., Michalski A., Scheltema R.A., Olsen J.V., Mann M. Andromeda: a peptide search engine integrated into the MaxQuant environment. J. Proteome Res. 2011;10:1794–1805. doi: 10.1021/pr101065j. [DOI] [PubMed] [Google Scholar]
- Cruz-Garcia D., Malhotra V., Curwin A.J. Unconventional protein secretion triggered by nutrient starvation. Semin. Cell Dev. Biol. 2018;83:22–28. doi: 10.1016/j.semcdb.2018.02.021. [DOI] [PubMed] [Google Scholar]
- Demetriades C., Doumpas N., Teleman A.A. Regulation of TORC1 in response to amino acid starvation via lysosomal recruitment of TSC2. Cell. 2014;156:786–799. doi: 10.1016/j.cell.2014.01.024. [DOI] [PMC free article] [PubMed] [Google Scholar]
- Demetriades C., Plescher M., Teleman A.A. Lysosomal recruitment of TSC2 is a universal response to cellular stress. Nat. Commun. 2016;7:10662. doi: 10.1038/ncomms10662. [DOI] [PMC free article] [PubMed] [Google Scholar]
- Denef C. Paracrinicity: the story of 30 years of cellular pituitary crosstalk. J. Neuroendocrinol. 2008;20:1–70. doi: 10.1111/j.1365-2826.2007.01616.x. [DOI] [PMC free article] [PubMed] [Google Scholar]
- DeYoung M.P., Horak P., Sofer A., Sgroi D., Ellisen L.W. Hypoxia regulates TSC1/2-mTOR signaling and tumor suppression through REDD1-mediated 14-3-3 shuttling. Genes Dev. 2008;22:239–251. doi: 10.1101/gad.1617608. [DOI] [PMC free article] [PubMed] [Google Scholar]
- Dibble C.C., Elis W., Menon S., Qin W., Klekota J., Asara J.M., Finan P.M., Kwiatkowski D.J., Murphy L.O., Manning B.D. TBC1D7 is a third subunit of the TSC1-TSC2 complex upstream of mTORC1. Mol. Cell. 2012;47:535–546. doi: 10.1016/j.molcel.2012.06.009. [DOI] [PMC free article] [PubMed] [Google Scholar]
- Dimou E., Nickel W. Unconventional mechanisms of eukaryotic protein secretion. Curr. Biol. 2018;28:R406–R410. doi: 10.1016/j.cub.2017.11.074. [DOI] [PubMed] [Google Scholar]
- Dupont N., Jiang S., Pilli M., Ornatowski W., Bhattacharya D., Deretic V. Autophagy-based unconventional secretory pathway for extracellular delivery of IL-1β. EMBO J. 2011;30:4701–4711. doi: 10.1038/emboj.2011.398. [DOI] [PMC free article] [PubMed] [Google Scholar]
- Farhan H., Rabouille C. Signalling to and from the secretory pathway. J. Cell Sci. 2011;124:171–180. doi: 10.1242/jcs.076455. [DOI] [PubMed] [Google Scholar]
- Fernandez-Patron C., Kassiri Z., Leung D. Modulation of Systemic Metabolism by MMP-2: From MMP-2 Deficiency in Mice to MMP-2 Deficiency in Patients. Compr. Physiol. 2016;6:1935–1949. doi: 10.1002/cphy.c160010. [DOI] [PubMed] [Google Scholar]
- Fridmann-Sirkis Y., Siniossoglou S., Pelham H.R. TMF is a golgin that binds Rab6 and influences Golgi morphology. BMC Cell Biol. 2004;5:18. doi: 10.1186/1471-2121-5-18. [DOI] [PMC free article] [PubMed] [Google Scholar]
- Gee H.Y., Noh S.H., Tang B.L., Kim K.H., Lee M.G. Rescue of ΔF508-CFTR trafficking via a GRASP-dependent unconventional secretion pathway. Cell. 2011;146:746–760. doi: 10.1016/j.cell.2011.07.021. [DOI] [PubMed] [Google Scholar]
- Giuliani F., Grieve A., Rabouille C. Unconventional secretion: a stress on GRASP. Curr. Opin. Cell Biol. 2011;23:498–504. doi: 10.1016/j.ceb.2011.04.005. [DOI] [PubMed] [Google Scholar]
- González A., Hall M.N. Nutrient sensing and TOR signaling in yeast and mammals. EMBO J. 2017;36:397–408. doi: 10.15252/embj.201696010. [DOI] [PMC free article] [PubMed] [Google Scholar]
- Gosavi P., Houghton F.J., McMillan P.J., Hanssen E., Gleeson P.A. The Golgi ribbon in mammalian cells negatively regulates autophagy by modulating mTOR activity. J. Cell Sci. 2018;131:jcs211987. doi: 10.1242/jcs.211987. [DOI] [PubMed] [Google Scholar]
- Grond R., Veenendaal T., Duran J.M., Raote I., van Es J.H., Corstjens S., Delfgou L., El Haddouti B., Malhotra V., Rabouille C. The function of GORASPs in Golgi apparatus organization in vivo. J. Cell Biol. 2020;219:e202004191. doi: 10.1083/jcb.202004191. [DOI] [PMC free article] [PubMed] [Google Scholar]
- Hanker A.B., Mitin N., Wilder R.S., Henske E.P., Tamanoi F., Cox A.D., Der C.J. Differential requirement of CAAX-mediated posttranslational processing for Rheb localization and signaling. Oncogene. 2010;29:380–391. doi: 10.1038/onc.2009.336. [DOI] [PMC free article] [PubMed] [Google Scholar]
- Hao F., Kondo K., Itoh T., Ikari S., Nada S., Okada M., Noda T. Rheb localized on the Golgi membrane activates lysosome-localized mTORC1 at the Golgi-lysosome contact site. J. Cell Sci. 2018;131:jcs208017. doi: 10.1242/jcs.208017. [DOI] [PubMed] [Google Scholar]
- Hara K., Yonezawa K., Weng Q.P., Kozlowski M.T., Belham C., Avruch J. Amino acid sufficiency and mTOR regulate p70 S6 kinase and eIF-4E BP1 through a common effector mechanism. J. Biol. Chem. 1998;273:14484–14494. doi: 10.1074/jbc.273.23.14484. [DOI] [PubMed] [Google Scholar]
- Hatsuzawa K., Tagaya M., Mizushima S. The hydrophobic region of signal peptides is a determinant for SRP recognition and protein translocation across the ER membrane. J. Biochem. 1997;121:270–277. doi: 10.1093/oxfordjournals.jbchem.a021583. [DOI] [PubMed] [Google Scholar]
- Henriet P., Emonard H. Matrix metalloproteinase-2: Not (just) a “hero” of the past. Biochimie. 2019;166:223–232. doi: 10.1016/j.biochi.2019.07.019. [DOI] [PubMed] [Google Scholar]
- Henske E.P., Jóźwiak S., Kingswood J.C., Sampson J.R., Thiele E.A. Tuberous sclerosis complex. Nat. Rev. Dis. Primers. 2016;2:16035. doi: 10.1038/nrdp.2016.35. [DOI] [PubMed] [Google Scholar]
- Holz M.K., Ballif B.A., Gygi S.P., Blenis J. mTOR and S6K1 mediate assembly of the translation preinitiation complex through dynamic protein interchange and ordered phosphorylation events. Cell. 2005;123:569–580. doi: 10.1016/j.cell.2005.10.024. [DOI] [PubMed] [Google Scholar]
- Huang W., Sherman B.T., Lempicki R.A. Bioinformatics enrichment tools: paths toward the comprehensive functional analysis of large gene lists. Nucleic Acids Res. 2009;37:1–13. doi: 10.1093/nar/gkn923. [DOI] [PMC free article] [PubMed] [Google Scholar]
- Huang W., Sherman B.T., Lempicki R.A. Systematic and integrative analysis of large gene lists using DAVID bioinformatics resources. Nat. Protoc. 2009;4:44–57. doi: 10.1038/nprot.2008.211. [DOI] [PubMed] [Google Scholar]
- Hung V., Udeshi N.D., Lam S.S., Loh K.H., Cox K.J., Pedram K., Carr S.A., Ting A.Y. Spatially resolved proteomic mapping in living cells with the engineered peroxidase APEX2. Nat. Protoc. 2016;11:456–475. doi: 10.1038/nprot.2016.018. [DOI] [PMC free article] [PubMed] [Google Scholar]
- Huyghe A., Furlan G., Ozmadenci D., Galonska C., Charlton J., Gaume X., Combémorel N., Riemenschneider C., Allègre N., Zhang J. Netrin-1 promotes naive pluripotency through Neo1 and Unc5b co-regulation of Wnt and MAPK signalling. Nat. Cell Biol. 2020;22:389–400. doi: 10.1038/s41556-020-0483-2. [DOI] [PubMed] [Google Scholar]
- Inoki K., Li Y., Xu T., Guan K.L. Rheb GTPase is a direct target of TSC2 GAP activity and regulates mTOR signaling. Genes Dev. 2003;17:1829–1834. doi: 10.1101/gad.1110003. [DOI] [PMC free article] [PubMed] [Google Scholar]
- Inoki K., Zhu T., Guan K.L. TSC2 mediates cellular energy response to control cell growth and survival. Cell. 2003;115:577–590. doi: 10.1016/s0092-8674(03)00929-2. [DOI] [PubMed] [Google Scholar]
- Jarvela T., Linstedt A.D. Isoform-specific tethering links the Golgi ribbon to maintain compartmentalization. Mol. Biol. Cell. 2014;25:133–144. doi: 10.1091/mbc.E13-07-0395. [DOI] [PMC free article] [PubMed] [Google Scholar]
- Jewell J.L., Kim Y.C., Russell R.C., Yu F.X., Park H.W., Plouffe S.W., Tagliabracci V.S., Guan K.L. Metabolism. Differential regulation of mTORC1 by leucine and glutamine. Science. 2015;347:194–198. doi: 10.1126/science.1259472. [DOI] [PMC free article] [PubMed] [Google Scholar]
- Jiang S., Dupont N., Castillo E.F., Deretic V. Secretory versus degradative autophagy: unconventional secretion of inflammatory mediators. J. Innate Immun. 2013;5:471–479. doi: 10.1159/000346707. [DOI] [PMC free article] [PubMed] [Google Scholar]
- Kennedy B.K., Lamming D.W. The Mechanistic Target of Rapamycin: The Grand ConducTOR of Metabolism and Aging. Cell Metab. 2016;23:990–1003. doi: 10.1016/j.cmet.2016.05.009. [DOI] [PMC free article] [PubMed] [Google Scholar]
- Kim D.H., Sarbassov D.D., Ali S.M., King J.E., Latek R.R., Erdjument-Bromage H., Tempst P., Sabatini D.M. mTOR interacts with raptor to form a nutrient-sensitive complex that signals to the cell growth machinery. Cell. 2002;110:163–175. doi: 10.1016/s0092-8674(02)00808-5. [DOI] [PubMed] [Google Scholar]
- Kim J., Noh S.H., Piao H., Kim D.H., Kim K., Cha J.S., Chung W.Y., Cho H.S., Kim J.Y., Lee M.G. Monomerization and ER Relocalization of GRASP Is a Requisite for Unconventional Secretion of CFTR. Traffic. 2016;17:733–753. doi: 10.1111/tra.12403. [DOI] [PubMed] [Google Scholar]
- Kinseth M.A., Anjard C., Fuller D., Guizzunti G., Loomis W.F., Malhotra V. The Golgi-associated protein GRASP is required for unconventional protein secretion during development. Cell. 2007;130:524–534. doi: 10.1016/j.cell.2007.06.029. [DOI] [PubMed] [Google Scholar]
- Kohli P., Höhne M., Jüngst C., Bertsch S., Ebert L.K., Schauss A.C., Benzing T., Rinschen M.M., Schermer B. The ciliary membrane-associated proteome reveals actin-binding proteins as key components of cilia. EMBO Rep. 2017;18:1521–1535. doi: 10.15252/embr.201643846. [DOI] [PMC free article] [PubMed] [Google Scholar]
- Kowarz E., Löscher D., Marschalek R. Optimized Sleeping Beauty transposons rapidly generate stable transgenic cell lines. Biotechnol. J. 2015;10:647–653. doi: 10.1002/biot.201400821. [DOI] [PubMed] [Google Scholar]
- Kuo A., Zhong C., Lane W.S., Derynck R. Transmembrane transforming growth factor-alpha tethers to the PDZ domain-containing, Golgi membrane-associated protein p59/GRASP55. EMBO J. 2000;19:6427–6439. doi: 10.1093/emboj/19.23.6427. [DOI] [PMC free article] [PubMed] [Google Scholar]
- Levi S.K., Glick B.S. GRASPing unconventional secretion. Cell. 2007;130:407–409. doi: 10.1016/j.cell.2007.07.030. [DOI] [PubMed] [Google Scholar]
- Liu G.Y., Sabatini D.M. mTOR at the nexus of nutrition, growth, ageing and disease. Nat. Rev. Mol. Cell Biol. 2020;21:183–203. doi: 10.1038/s41580-019-0199-y. [DOI] [PMC free article] [PubMed] [Google Scholar]
- Liu X., Zheng X.F. Endoplasmic reticulum and Golgi localization sequences for mammalian target of rapamycin. Mol. Biol. Cell. 2007;18:1073–1082. doi: 10.1091/mbc.E06-05-0406. [DOI] [PMC free article] [PubMed] [Google Scholar]
- Liu L., Wang K., Liu J., Wei Y., Liu W., Zhang P., Hu J., Li B. Starvation effect on the morphology of microvilli in HeLa cells. Biochem. Biophys. Res. Commun. 2019;514:1238–1243. doi: 10.1016/j.bbrc.2019.05.073. [DOI] [PubMed] [Google Scholar]
- Martell J.D., Deerinck T.J., Sancak Y., Poulos T.L., Mootha V.K., Sosinsky G.E., Ellisman M.H., Ting A.Y. Engineered ascorbate peroxidase as a genetically encoded reporter for electron microscopy. Nat. Biotechnol. 2012;30:1143–1148. doi: 10.1038/nbt.2375. [DOI] [PMC free article] [PubMed] [Google Scholar]
- Martell J.D., Deerinck T.J., Lam S.S., Ellisman M.H., Ting A.Y. Electron microscopy using the genetically encoded APEX2 tag in cultured mammalian cells. Nat. Protoc. 2017;12:1792–1816. doi: 10.1038/nprot.2017.065. [DOI] [PMC free article] [PubMed] [Google Scholar]
- Misumi Y., Sohda M., Tashiro A., Sato H., Ikehara Y. An essential cytoplasmic domain for the Golgi localization of coiled-coil proteins with a COOH-terminal membrane anchor. J. Biol. Chem. 2001;276:6867–6873. doi: 10.1074/jbc.M010121200. [DOI] [PubMed] [Google Scholar]
- Muranen T., Iwanicki M.P., Curry N.L., Hwang J., DuBois C.D., Coloff J.L., Hitchcock D.S., Clish C.B., Brugge J.S., Kalaany N.Y. Starved epithelial cells uptake extracellular matrix for survival. Nat. Commun. 2017;8:13989. doi: 10.1038/ncomms13989. [DOI] [PMC free article] [PubMed] [Google Scholar]
- Nüchel J., Ghatak S., Zuk A.V., Illerhaus A., Mörgelin M., Schönborn K., Blumbach K., Wickström S.A., Krieg T., Sengle G. TGFB1 is secreted through an unconventional pathway dependent on the autophagic machinery and cytoskeletal regulators. Autophagy. 2018;14:465–486. doi: 10.1080/15548627.2017.1422850. [DOI] [PMC free article] [PubMed] [Google Scholar]
- Overall C.M. Molecular determinants of metalloproteinase substrate specificity: matrix metalloproteinase substrate binding domains, modules, and exosites. Mol. Biotechnol. 2002;22:51–86. doi: 10.1385/MB:22:1:051. [DOI] [PubMed] [Google Scholar]
- Palm W., Park Y., Wright K., Pavlova N.N., Tuveson D.A., Thompson C.B. The Utilization of Extracellular Proteins as Nutrients Is Suppressed by mTORC1. Cell. 2015;162:259–270. doi: 10.1016/j.cell.2015.06.017. [DOI] [PMC free article] [PubMed] [Google Scholar]
- Pearce L.R., Alton G.R., Richter D.T., Kath J.C., Lingardo L., Chapman J., Hwang C., Alessi D.R. Characterization of PF-4708671, a novel and highly specific inhibitor of p70 ribosomal S6 kinase (S6K1) Biochem. J. 2010;431:245–255. doi: 10.1042/BJ20101024. [DOI] [PubMed] [Google Scholar]
- Perez-Riverol Y., Csordas A., Bai J., Bernal-Llinares M., Hewapathirana S., Kundu D.J., Inuganti A., Griss J., Mayer G., Eisenacher M. The PRIDE database and related tools and resources in 2019: improving support for quantification data. Nucleic Acids Res. 2019;47:D442–D450. doi: 10.1093/nar/gky1106. [DOI] [PMC free article] [PubMed] [Google Scholar]
- Plescher M., Teleman A.A., Demetriades C. TSC2 mediates hyperosmotic stress-induced inactivation of mTORC1. Sci. Rep. 2015;5:13828. doi: 10.1038/srep13828. [DOI] [PMC free article] [PubMed] [Google Scholar]
- Püschel F., Favaro F., Redondo-Pedraza J., Lucendo E., Iurlaro R., Marchetti S., Majem B., Eldering E., Nadal E., Ricci J.E. Starvation and antimetabolic therapy promote cytokine release and recruitment of immune cells. Proc. Natl. Acad. Sci. USA. 2020;117:9932–9941. doi: 10.1073/pnas.1913707117. [DOI] [PMC free article] [PubMed] [Google Scholar]
- Rabanal-Ruiz Y., Korolchuk V.I. mTORC1 and Nutrient Homeostasis: The Central Role of the Lysosome. Int. J. Mol. Sci. 2018;19:818. doi: 10.3390/ijms19030818. [DOI] [PMC free article] [PubMed] [Google Scholar]
- Rabouille C. Pathways of Unconventional Protein Secretion. Trends Cell Biol. 2017;27:230–240. doi: 10.1016/j.tcb.2016.11.007. [DOI] [PubMed] [Google Scholar]
- Ran F.A., Hsu P.D., Wright J., Agarwala V., Scott D.A., Zhang F. Genome engineering using the CRISPR-Cas9 system. Nat. Protoc. 2013;8:2281–2308. doi: 10.1038/nprot.2013.143. [DOI] [PMC free article] [PubMed] [Google Scholar]
- Sancak Y., Bar-Peled L., Zoncu R., Markhard A.L., Nada S., Sabatini D.M. Ragulator-Rag complex targets mTORC1 to the lysosomal surface and is necessary for its activation by amino acids. Cell. 2010;141:290–303. doi: 10.1016/j.cell.2010.02.024. [DOI] [PMC free article] [PubMed] [Google Scholar]
- Santhanam L., Berkowitz D.E., Belkin A.M. Nitric oxide regulates non-classical secretion of tissue transglutaminase. Commun. Integr. Biol. 2011;4:584–586. doi: 10.4161/cib.4.5.16512. [DOI] [PMC free article] [PubMed] [Google Scholar]
- Schira-Heinen J., Grube L., Waldera-Lupa D.M., Baberg F., Langini M., Etemad-Parishanzadeh O., Poschmann G., Stühler K. Pitfalls and opportunities in the characterization of unconventionally secreted proteins by secretome analysis. Biochim. Biophys. Acta. Proteins Proteomics. 2019;1867:140237. doi: 10.1016/j.bbapap.2019.06.004. [DOI] [PubMed] [Google Scholar]
- Schneider C.A., Rasband W.S., Eliceiri K.W. NIH Image to ImageJ: 25 years of image analysis. Nat. Methods. 2012;9:671–675. doi: 10.1038/nmeth.2089. [DOI] [PMC free article] [PubMed] [Google Scholar]
- Schotman H., Karhinen L., Rabouille C. dGRASP-mediated noncanonical integrin secretion is required for Drosophila epithelial remodeling. Dev. Cell. 2008;14:171–182. doi: 10.1016/j.devcel.2007.12.006. [DOI] [PubMed] [Google Scholar]
- Short B., Preisinger C., Körner R., Kopajtich R., Byron O., Barr F.A. A GRASP55-rab2 effector complex linking Golgi structure to membrane traffic. J. Cell Biol. 2001;155:877–883. doi: 10.1083/jcb.200108079. [DOI] [PMC free article] [PubMed] [Google Scholar]
- Shorter J., Warren G. A role for the vesicle tethering protein, p115, in the post-mitotic stacking of reassembling Golgi cisternae in a cell-free system. J. Cell Biol. 1999;146:57–70. doi: 10.1083/jcb.146.1.57. [DOI] [PMC free article] [PubMed] [Google Scholar]
- Shorter J., Watson R., Giannakou M.E., Clarke M., Warren G., Barr F.A. GRASP55, a second mammalian GRASP protein involved in the stacking of Golgi cisternae in a cell-free system. EMBO J. 1999;18:4949–4960. doi: 10.1093/emboj/18.18.4949. [DOI] [PMC free article] [PubMed] [Google Scholar]
- Singleton D.R., Wu T.T., Castle J.D. Three mammalian SCAMPs (secretory carrier membrane proteins) are highly related products of distinct genes having similar subcellular distributions. J. Cell Sci. 1997;110:2099–2107. doi: 10.1242/jcs.110.17.2099. [DOI] [PubMed] [Google Scholar]
- Son S.M., Cha M.Y., Choi H., Kang S., Choi H., Lee M.S., Park S.A., Mook-Jung I. Insulin-degrading enzyme secretion from astrocytes is mediated by an autophagy-based unconventional secretory pathway in Alzheimer disease. Autophagy. 2016;12:784–800. doi: 10.1080/15548627.2016.1159375. [DOI] [PMC free article] [PubMed] [Google Scholar]
- Stirling J.W., Graff P.S. Antigen unmasking for immunoelectron microscopy: labeling is improved by treating with sodium ethoxide or sodium metaperiodate, then heating on retrieval medium. J. Histochem. Cytochem. 1995;43:115–123. doi: 10.1177/43.2.7529784. [DOI] [PubMed] [Google Scholar]
- Tatsukawa H., Furutani Y., Hitomi K., Kojima S. Transglutaminase 2 has opposing roles in the regulation of cellular functions as well as cell growth and death. Cell Death Dis. 2016;7:e2244. doi: 10.1038/cddis.2016.150. [DOI] [PMC free article] [PubMed] [Google Scholar]
- Tee A.R., Manning B.D., Roux P.P., Cantley L.C., Blenis J. Tuberous sclerosis complex gene products, Tuberin and Hamartin, control mTOR signaling by acting as a GTPase-activating protein complex toward Rheb. Curr. Biol. 2003;13:1259–1268. doi: 10.1016/s0960-9822(03)00506-2. [DOI] [PubMed] [Google Scholar]
- Tong L. Structure and function of biotin-dependent carboxylases. Cell. Mol. Life Sci. 2013;70:863–891. doi: 10.1007/s00018-012-1096-0. [DOI] [PMC free article] [PubMed] [Google Scholar]
- Truschel S.T., Zhang M., Bachert C., Macbeth M.R., Linstedt A.D. Allosteric regulation of GRASP protein-dependent Golgi membrane tethering by mitotic phosphorylation. J. Biol. Chem. 2012;287:19870–19875. doi: 10.1074/jbc.M111.326256. [DOI] [PMC free article] [PubMed] [Google Scholar]
- Tsokanos F.F., Albert M.A., Demetriades C., Spirohn K., Boutros M., Teleman A.A. eIF4A inactivates TORC1 in response to amino acid starvation. EMBO J. 2016;35:1058–1076. doi: 10.15252/embj.201593118. [DOI] [PMC free article] [PubMed] [Google Scholar]
- Tyanova S., Temu T., Sinitcyn P., Carlson A., Hein M.Y., Geiger T., Mann M., Cox J. The Perseus computational platform for comprehensive analysis of (prote)omics data. Nat. Methods. 2016;13:731–740. doi: 10.1038/nmeth.3901. [DOI] [PubMed] [Google Scholar]
- Valerius O., Asif A.R., Beissbarth T., Bohrer R., Dihazi H., Feussner K., Jahn O., Majcherczyk A., Schmidt B., Schmitt K. Mapping Cellular Microenvironments: Proximity Labeling and Complexome Profiling (Seventh Symposium of the Gottingen Proteomics Forum) Cells. 2019;8:1192. doi: 10.3390/cells8101192. [DOI] [PMC free article] [PubMed] [Google Scholar]
- Valvezan A.J., Manning B.D. Molecular logic of mTORC1 signalling as a metabolic rheostat. Nat. Metab. 2019;1:321–333. doi: 10.1038/s42255-019-0038-7. [DOI] [PMC free article] [PubMed] [Google Scholar]
- Van Haastert P.J., Bosgraaf L. Food searching strategy of amoeboid cells by starvation induced run length extension. PLoS ONE. 2009;4:e6814. doi: 10.1371/journal.pone.0006814. [DOI] [PMC free article] [PubMed] [Google Scholar]
- van Leeuwen W., van der Krift F., Rabouille C. Modulation of the secretory pathway by amino-acid starvation. J. Cell Biol. 2018;217:2261–2271. doi: 10.1083/jcb.201802003. [DOI] [PMC free article] [PubMed] [Google Scholar]
- Vilella-Bach M., Nuzzi P., Fang Y., Chen J. The FKBP12-rapamycin-binding domain is required for FKBP12-rapamycin-associated protein kinase activity and G1 progression. J. Biol. Chem. 1999;274:4266–4272. doi: 10.1074/jbc.274.7.4266. [DOI] [PubMed] [Google Scholar]
- Walzthoeni T., Claassen M., Leitner A., Herzog F., Bohn S., Förster F., Beck M., Aebersold R. False discovery rate estimation for cross-linked peptides identified by mass spectrometry. Nat. Methods. 2012;9:901–903. doi: 10.1038/nmeth.2103. [DOI] [PubMed] [Google Scholar]
- Wang H., Boussouar A., Mazelin L., Tauszig-Delamasure S., Sun Y., Goldschneider D., Paradisi A., Mehlen P. The Proto-oncogene c-Kit Inhibits Tumor Growth by Behaving as a Dependence Receptor. Mol. Cell. 2018;72:413–425.e5. doi: 10.1016/j.molcel.2018.08.040. [DOI] [PubMed] [Google Scholar]
- Yadav R.B., Burgos P., Parker A.W., Iadevaia V., Proud C.G., Allen R.A., O’Connell J.P., Jeshtadi A., Stubbs C.D., Botchway S.W. mTOR direct interactions with Rheb-GTPase and raptor: sub-cellular localization using fluorescence lifetime imaging. BMC Cell Biol. 2013;14:3. doi: 10.1186/1471-2121-14-3. [DOI] [PMC free article] [PubMed] [Google Scholar]
- Zacharogianni M., Kondylis V., Tang Y., Farhan H., Xanthakis D., Fuchs F., Boutros M., Rabouille C. ERK7 is a negative regulator of protein secretion in response to amino-acid starvation by modulating Sec16 membrane association. EMBO J. 2011;30:3684–3700. doi: 10.1038/emboj.2011.253. [DOI] [PMC free article] [PubMed] [Google Scholar]
- Zacharogianni M., Aguilera-Gomez A., Veenendaal T., Smout J., Rabouille C. A stress assembly that confers cell viability by preserving ERES components during amino-acid starvation. eLife. 2014;3:e04132. doi: 10.7554/eLife.04132. [DOI] [PMC free article] [PubMed] [Google Scholar]
- Zemskov E.A., Mikhailenko I., Hsia R.C., Zaritskaya L., Belkin A.M. Unconventional secretion of tissue transglutaminase involves phospholipid-dependent delivery into recycling endosomes. PLoS ONE. 2011;6:e19414. doi: 10.1371/journal.pone.0019414. [DOI] [PMC free article] [PubMed] [Google Scholar]
- Zhang Y., Seemann J. Rapid degradation of GRASP55 and GRASP65 reveals their immediate impact on the Golgi structure. J. Cell Biol. 2021;220:e202007052. doi: 10.1083/jcb.202007052. [DOI] [PMC free article] [PubMed] [Google Scholar]
- Zhang X., Wang Y. GRASPs in Golgi Structure and Function. Front. Cell Dev. Biol. 2016;3:84. doi: 10.3389/fcell.2015.00084. [DOI] [PMC free article] [PubMed] [Google Scholar]
- Zhang M., Kenny S.J., Ge L., Xu K., Schekman R. Translocation of interleukin-1β into a vesicle intermediate in autophagy-mediated secretion. eLife. 2015;4:e11205. doi: 10.7554/eLife.11205. [DOI] [PMC free article] [PubMed] [Google Scholar]
- Zhang X., Wang L., Lak B., Li J., Jokitalo E., Wang Y. GRASP55 Senses Glucose Deprivation through O-GlcNAcylation to Promote Autophagosome-Lysosome Fusion. Dev. Cell. 2018;45:245–261.e6. doi: 10.1016/j.devcel.2018.03.023. [DOI] [PMC free article] [PubMed] [Google Scholar]
- Zhang M., Liu L., Lin X., Wang Y., Li Y., Guo Q., Li S., Sun Y., Tao X., Zhang D. A Translocation Pathway for Vesicle-Mediated Unconventional Protein Secretion. Cell. 2020;181:637–652.e15. doi: 10.1016/j.cell.2020.03.031. [DOI] [PubMed] [Google Scholar]
- Zhou X., Clister T.L., Lowry P.R., Seldin M.M., Wong G.W., Zhang J. Dynamic Visualization of mTORC1 Activity in Living Cells. Cell Rep. 2015;10:1767–1777. doi: 10.1016/j.celrep.2015.02.031. [DOI] [PMC free article] [PubMed] [Google Scholar]
Associated Data
This section collects any data citations, data availability statements, or supplementary materials included in this article.
Supplementary Materials
Data Availability Statement
The mass spectrometry proteomics data have been deposited to the ProteomeXchange Consortium via the PRIDE (Perez-Riverol et al., 2019) partner repository with the dataset identifier PXD020331 and are publicly available as of the date of publication. Accession numbers are listed in the Key Resources Table.
This paper does not report original code.
Any additional information required to reanalyze the data reported in this paper is available from the lead contact upon request.