Abstract
Background
There is an unmet need for reliable biomarkers to predict disease severity, prognosis, and treatment effect in patients with spinal muscular atrophy (SMA). The purpose of this review is to evaluate the clinical utility of blood-based biomarkers in patients with SMA.
Methods
A systematic review of MEDLINE, DARE, PEDro, PsycINFO, Cochrane Database, LILACS, OTSeeker, SpeechBITE, CINAHL, Scopus, Science Direct, clinicaltrial.gov, OpenGrey, and Google Scholar was performed with the last search data of June 30, 2019.
Results
Survival motor neuron (SMN)-related biomarkers showed an important interpatient and cell variability with a wide overlap between SMA phenotypes and healthy controls. Several plasma protein analytes correlated with motor scores; however, validation studies are needed to rule out false positives. DNA methylation analysis distinguished between patients with mild/moderate SMA and healthy controls. Plasma phosphorylated neurofilament heavy chain (pNF-H) levels increased with disease severity and declined considerably after nusinersen treatment.
Conclusion
There is no sufficient evidence to support the clinical utility of SMN-related biomarkers to predict disease severity in SMA. pNF-H appears to be a promising biomarker of disease activity and treatment effect in SMA. Further studies should include longitudinal assessments of patients with SMA across functional groups and comparisons with age-matched healthy controls to evaluate the stability of putative biomarkers over time and in response to SMA therapeutics. PROSPERO registration: CRD42019139050.
Spinal muscular atrophy (SMA) is a rare, autosomal recessive neurodegenerative disease with an incidence ranging from 4 to 10 per 100,000 live births,1 across clinical subtypes I–IV.2 SMA is caused by deletion or mutation of the survival motor neuron 1 gene on chromosome 5 (5q11-13),2 resulting in reduced expression of full-length SMN protein.2,3 Depletion of the SMN protein in alpha motor neurons results in neuronal degeneration and thus various degrees of paresis of proximal muscles.4,5
Current therapeutic alternatives for patients with SMA aim to increase the amount of full-length SMN protein levels either by replacing SMN1 through gene therapy6,7 or by SMN2 splicing modulators such as nusinersen (SpinrazaTM),8 risdiplam,9 and branaplam.10 Given that new treatments are under development,11 there is a critical need for reliable biomarkers to predict disease severity, prognosis, and treatment effect.
Several biomarkers have been proposed for SMA, including molecular,12,13 physiologic,14,15 structural (imaging modalities),16 and clinical biomarkers17; however; no agreement has been made on the most reliable biomarkers. Physiologic, structural, and clinical biomarkers, although valuable, they can be limited by assessor bias, intra- and interrater variability, poor sensitivity, and dependency on patients' collaboration. The most reproducible, quantitative, unbiased, and minimally invasive method to characterize SMA disease state would be a blood-based biomarker. The purpose of this systematic review was to investigate the clinical utility of molecular biomarkers as indicators for disease severity, treatment effect, or predicting prognosis for patients with SMA.
Methods
This systematic review was conducted following “The Cochrane Handbook for Systematic Reviews of Interventions Guidelines”18 and the guidelines of the “Preferred Reporting Items for Systematic Reviews and Meta-Analyses.”19 The protocol was registered in the International prospective register of systematic reviews (PROSPERO) database (CRD42019139050), University of York, and is available at: crd.york.ac.uk/PROSPERO/.
Literature Search
A systematic review of MEDLINE, DARE, PEDro, PsycINFO, Cochrane Database, LILACS, OTSeeker, SpeechBITE, CINAHL, Scopus, Science Direct, clinicaltrial.gov, OpenGrey, and Google Scholar was performed with the last search data of June 30, 2019. The search strategy included the following keywords: “spinal muscular atrophy,” and “muscular atrophies.” These terms were combined with “biomarker*.” Potentially eligible articles were screened by 2 independent reviewers. A third experienced reviewer resolved any disagreements.
Study Selection Criteria
Studies included satisfied all the following criteria: (1) interventional clinical trials as well as observational, longitudinal, or cross-sectional original articles in English or Spanish, (2) SMA genetically confirmed following diagnostic criteria defined by the SMA Consortium (i.e., a homozygous deletion of the SMN1 gene or a hemizygous deletion with an additional pathogenic point mutation in the second SMN1 allele),20 and (3) studies compared serum markers in patients with SMA vs healthy controls. Exclusion criteria were the following: (1) the number of participants enrolled was less than 10 per group, (2) no healthy control comparator, (3) missing demographic data about SMA or healthy control group, (4) nonquantitative methods to assess molecular biomarker concentrations, (5) enrolled participants with inflammatory or neurologic comorbidities that may affect biomarker concentration, (6) animal studies, and (7) abstracts, reviews, and posters.
Data Extraction
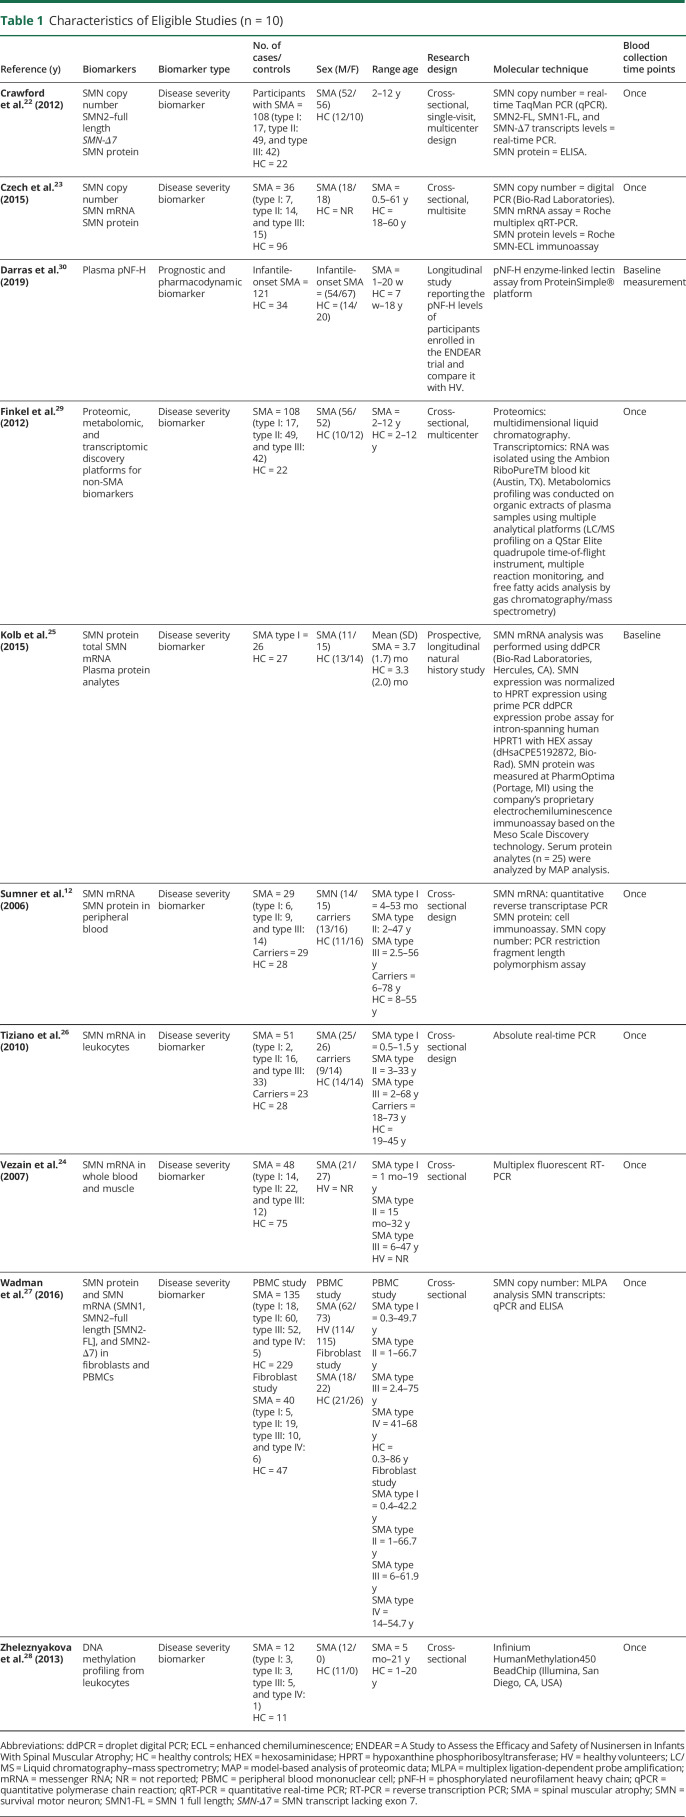
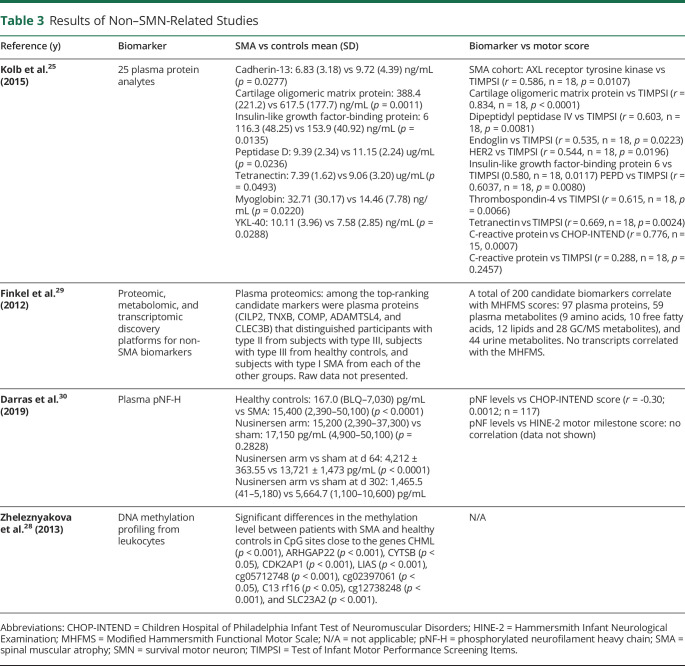
The following information was extracted: (1) characteristic of studies: molecular candidate, biomarker type, number of SMA participants vs healthy controls, sex, age range, research design, and molecular technique (table 1) and (2) results: outcomes measures and correlation among putative biomarkers and between biomarkers and clinical motor scales (tables 2 and 3).
Table 1.
Characteristics of Eligible Studies (n = 10)
Table 2.
Results of SMN-Related Biomarkers
Table 3.
Results of Non–SMN-Related Studies
Quality Assessment
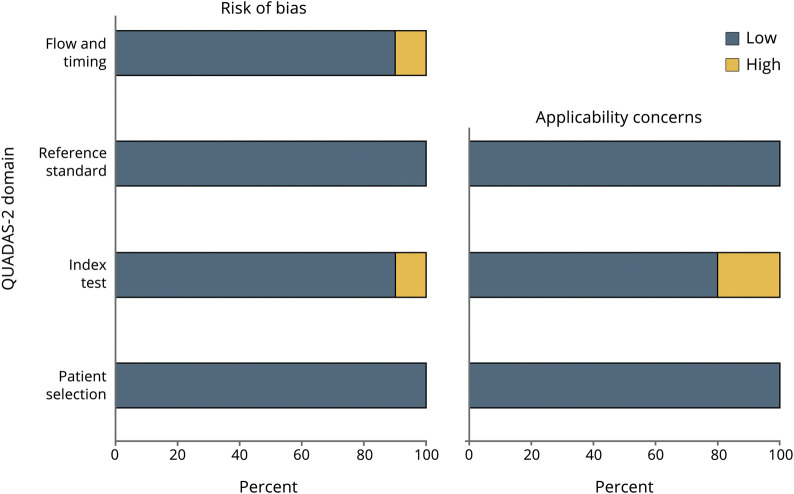
The quality of each selected article was assessed by the Quality Assessment of Diagnostic Accuracy Studies (QUADAS-2).21 This tool consists of 4 key domains assessing the risk of bias for patient selection, index test, reference standard, and flow and timing of index tests.21 Quality assessment is summarized in figure 1.
Figure 1. Evaluation of Study Quality Using QUADAS Risk of Bias.
Risk of bias was categorized as low (gray) or high (white). QUADAS-2 = Quality Assessment of Diagnostic Accuracy Study.
Data Availability
Data used in this systematic review are the data reported by each selected article. We do not have additional data not published within each article.
Results
Study Selection
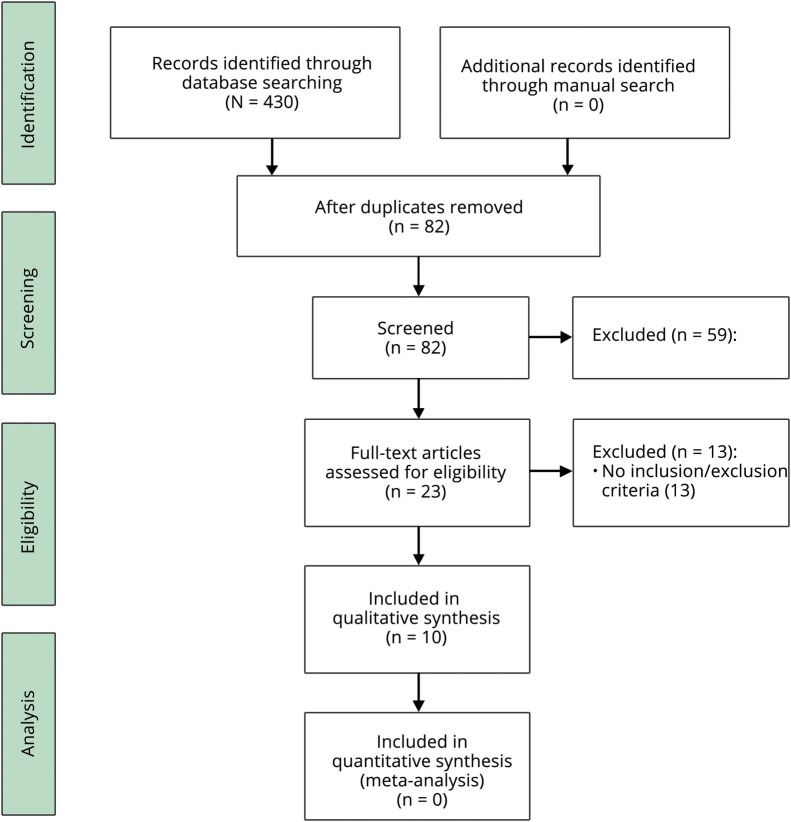
Through database searching, 430 abstracts were found to have the relevant keywords. After duplicates were removed, abstracts were assessed by 2 independent reviewers, and 23 articles were selected for full-text review. Finally, 10 articles fulfilling the inclusion/exclusion criteria were selected for qualitative analysis (figure 2).
Figure 2. Flowchart Showing Preferred Reporting Items for Systematic Reviews and Meta-analyses Study Selection Process.
Study Characteristics
Based on the type of molecular biomarkers, 7 studies included SMN-related biomarkers: SMN2 copy number,22–24 SMN transcript levels,12,22–27 and SMN protein expression,12,22,23,25,27 and 3 studies included non–SMN-related biomarkers: DNA methylation profiling,28 proteomic, metabolomic, and transcriptomic discovery platforms,29 and plasma phosphorylated neurofilament heavy chain (pNF-H)30 (table 1).
Because of the heterogeneity of putative biomarkers, molecular laboratory essays, and housekeeping genes for normalization in SMN transcript analysis, a meta-analysis was not conducted. Tables 2 and 3 present a summary of the outcome measures per each type of biomarker and the correspondent correlation with motor outcomes.
SMN-Related Biomarkers
SMN2 Copy Number as Biomarker for Disease Severity
Three studies measured SMN2 copy number as a biomarker for disease severity.22–24 Czech found that SMA phenotype was more related to the copy number than to SMN2 transcripts expression,23 but statistical comparisons were not provided. Vezain reported that SMA phenotypic groups are heterogeneous regarding SMN2 copy numbers,24 and finally Crawford reported that SMN2 copy number was considerably lower in healthy controls (p < 0.001)22 and that SMN2 copy number increased proportionally to SMA severity.22 SMA types I and II most commonly had 2 and 3 SMN2 copies, respectively, whereas type III had 3 or 4 SMN2 copies22 However, there were type I participants with high SMN2 copy number and type III SMA participants with a low SMN2 copy number, and thus, SMN2 copy number does not predict disease severity.
SMN mRNA Levels as Biomarkers for Disease Severity
Two specific transcripts were proposed as putative biomarkers of disease severity: SMN2–full length (SMN2-FL)12,22–27 and SMN transcript lacking exon 7 (SMN-Δ7).12,22,27
SMN2–Full Length
SMN2-FL transcript levels as a biomarker for disease severity showed conflicted results. Although 2 studies reported that SMN2 mRNA levels were able to distinguish between patients with SMA and healthy controls and among SMA phenotypes, a correlation between SMN2-FL levels and Hammersmith Functional Motor Scale score was only found in SMA type II participants.26 Similarly, Vezain found that SMN2-FL transcript levels were inversely correlated with disease severity in peripheral blood cells but not in muscle samples.24 Sumner found differences in SMN transcript between participants with SMA and healthy controls (p < 0.001); however, type I participants were mostly responsible for this difference; omitting this phenotype resulted in no differences among groups.12 Of interest, Czech reported that SMN2 expression is differently regulated in participants with SMA compared with healthy controls.23 In healthy controls, SMN mRNA expression is proportional to the number of gene copies, whereas in participants with SMA, there is no correlation.23 Finally, 3 studies found no correlation between SMN2-FL expression and disease phenotype.22,25,27
SMN Transcript Lacking Exon 7
Sumner12 and Crawford found that SMN-Δ7 expression levels are reduced in type I participants compared with type II and III, but they were similar to healthy controls.22 Finally, Wadman found no association between SMA phenotype and SMN-Δ7 expression in peripheral blood cells and fibroblasts.27
SMN Protein Levels as Biomarkers for Disease Severity
Two studies found that SMN protein levels were greater in healthy controls than participants with SMA.22,27 However, most studies show that SMN protein cannot distinguish between SMA phenotypes.12,22,23,27
Non–SMN-Related Biomarkers
Plasma pNF-H as Prognostic and Pharmacodynamic Biomarker
Darras measured baseline pNF-H concentrations in healthy controls and nusinersen-treated type I infants enrolled in the ENDEAR trial.30 There were a 10-fold greater plasma pNF-H levels in type I infants vs non-neurologic disease controls aged <1 year. Moreover, there was an inverse correlation between pNF-H levels and several markers of disease severity including age at first dose and SMA diagnosis, symptom onset, and Children's Hospital of Philadelphia Infant Test of Neuromuscular Disorders score. Although pNF-H levels declined over time in both nusinersen-treated and healthy control groups, pNF-H concentration declined to a greater extent in the nusinersen-treated arm.30
Plasma Protein Analytes as Biomarkers for Disease Severity
Although Kolb found lower concentration of 5 protein analytes in the SMA cohort group vs healthy controls, only 1 analyte correlated with both the Test of Infant Motor Performance Screening Items (TIMPSI) and the CHOP-INTEND score.25 In contrast, Finkel identified 97 plasma proteins that regressed against the Modified Hammersmith Functional Motor Scale (MHFMS) and were able to distinguish among SMA type II, III, and controls.29
DNA Methylation Profiling From Leukocytes as a Biomarker for Disease Severity
Zheleznyakova conducted a whole-genome methylation pattern analysis from peripheral whole blood leukocytes.28 There were substantial differences in the methylation level between participants with SMA and healthy controls in CpG sites of genes involved in SMA development.28
Quality Assessment
The quality of selected articles was evaluated by the QUADAS-2 (figure 1).21 Patient selection presented a low bias across studies, with all studies including a patient-vs-healthy control design as well as genetic confirmation of participants with SMA with no other neurologic comorbidities. The main index test–related bias is the lack of longitudinal measurements across studies, which prevent the assessment of the stability of the putative biomarker over time. In addition, 1 study described assay technical difficulties,25 and another one did not report the raw data of healthy controls.29 None of the clinical motor function scales used as a reference test have been validated for the entire range of SMA phenotypes, and thus, associations between biomarker expression and motor function scores were restricted to a particular SMA phenotype. In terms of statistical reports, only 1 study presented a high-risk bias since the statistical comparison between participants with SMA and healthy controls, and correlations with motor function scales were not reported.29
Discussion
Based on this qualitative systematic review, there is no sufficient evidence to support the clinical utility of SMN-related putative biomarkers to predict disease severity. Among non–SMN-related biomarkers, pNF-H may be a promising biomarker of disease activity and treatment effect in SMA.
The SMN2 gene is proposed to be the main modifier of disease activity. However, the selected studies found that SMA phenotypes were either heterogeneous regarding SMN2 copy numbers24 or had a modest predictive value for individual patients.22 SMN2 copy number does not explain SMA severity, as patients with the same gene copy number have different SMA types,26 which suggests that additional genetic or epigenetic factors may be affecting SMA phenotype.31
SMN2 transcript levels as a biomarker for disease severity showed inconsistent results. The correlation between SMN2-FL mRNA expression and SMA phenotype seems to be influenced by the heterogeneity of genotypes within each SMA type. For both SMN2-FL and SMN-Δ7 transcript levels, there was a wide overlap among SMA phenotypes and controls12,22,24,26 and limited correlation with clinical motor function.22,25,27 An important finding of Czech and Crawford was that the regulation of SMN2 expression in patients with SMA is different from healthy controls.22,23 SMN mRNA expression is related to the number of SMN gene copies in healthy participants but not in patients with SMA, which suggest that SMN expression and SMA severity are regulated by additional factors.22,23
Although it has been widely accepted that SMA is caused by lower levels of SMN protein, the selected studies showed a great overlap of SMN protein levels among SMA phenotypes.12,22,23,27 A plausible explanation is that SMN protein concentration may be different in blood, muscles, and the spinal cord and that the SMN2 gene may be less transcriptionally active in alpha motor neurons. Alternatively, SMN protein levels may be reduced during early development but not later on.
Overall, studies showed that although SMN transcripts, SMN2 copy number, and SMN protein are measurable in peripheral blood, several limitations prevent their value as a clinical tool. There significant interpatient and cell-type variability, and most importantly, neither SMN copy number, transcripts, or protein can per se predict SMA phenotype and thus, they cannot serve as a biomarker for disease severity.
Conventionally, the quest for biomarkers in SMA includes a hypothesis-based study design related to the pathophysiology of SMA. In contrast, the search for serum analytes is hypothesis generating, and includes assessing a broad set of disparate analytes, for the ability to distinguish between SMA and controls and correlate with motor outcomes. Although this approach may be considered unbiased in nature, it has the risk of increased false positives and results that are difficult to interpret. Finkel reported analytes that correlated with the MHFMS and that distinguished between type I, II, and III,29 although this motor scale is only validated for children with type II SMA. Moreover, some analytes differentiated between type III and healthy controls,29 but differences between controls and other subtypes were not reported. Kolb found additional factors affecting the interpretation of findings. Analyte concentration may be dependent on the number of SMN2 copy numbers. For instance, complement component C1q receptor (C1qR1) in participants with SMA was only different than controls with 2 SMN2 copy numbers (p = 0.02) but not in the entire cohort (p = 0.1).25 Furthermore, correlation between age and targeted analytes needs to be previously established because the authors found that 9 analytes had a negative correlation with age in the control cohort25 and other 10 analytes had a negative correlation with age in the SMA cohort.25 Only 6 analytes showed this correlation in both the healthy control and SMA cohorts.25 Finally, because analyte concentrations are quite downstream from the origin of the damage in spinal motor neurons, changes in serum may reflect concurrent biological processes in other peripheral tissues and not be indicative of a specific pathologic process in alpha motor neurons. Taken together, it would be preliminary to speculate which of these analytes has the most potential to serve as a biomarker for SMA. Additional longitudinal, validation studies are needed to determine whether serum analytes can serve as markers for SMA.
Neurofilament proteins have been proposed as potential biomarkers for several neurologic conditions including multiple sclerosis, amyotrophic lateral sclerosis, Parkinson disease, and Alzheimer disease, all of them characterized by axonal degeneration.32 Postmortem studies in humans with SMA have found severe degeneration of axons and alpha motorneurons in the spinal cord.33 Darras demonstrated that pNF-H levels were considerably greater in patients with SMA type I vs healthy controls and that baseline pNF-H levels were positively correlated with disease severity. Moreover, nusinersen treatment reduced pNF-H levels, which may suggest that pNF-H can serve as a pharmacodynamic marker for SMN-targeted therapies.30 The authors observed high pNF-H levels in healthy controls younger than 1 year, which may reflect normal neuronal pruning, and therefore, an important methodological consideration for future studies is to include age-matched control cohort for every SMA phenotype.
DNA methylation is a common mechanism of epigenetic regulation altering gene expression, and abnormal methylation patterns have been associated with the development and progression of various diseases.34 Zheleznyakova conducted the first genome-wide methylation study in patients with SMA and found that 10 CpG sites had different methylation levels compared with age-matched controls.28 This is supported by previous studies showing different methylation patterns in CpG sites between patients with type I and III SMA in DNA extracted from leukocytes and fibroblasts.35 Further longitudinal studies are needed to determine whether DNA methylation patterns can be altered by SMA therapy agents, as they may possess DNA-demethylase activity.
Although not a molecular biomarker, the ulnar compound muscle action potential (CMAP), investigated by Kolb et al.,25 deserves a special mention as a potential biomarker for SMA. The authors found that CMAP peak amplitude in participants with type I SMA was considerably lower than healthy controls (p < 0.001) and that CMAP correlated with the TIMPSI (r = 0.785, p < 0.0001) and CHOP-INTEND (r = 0.556, p = 0.0088) motor scores. Although evidence suggests that CMAP can serve as a marker for disease severity,36 it is unclear whether it can serve as a marker for treatment effect. A clinical trial testing the safety and efficacy of olesoxime in participants with type II and III SMA showed an important difference between the treated and placebo cohort for Motor Function Score change across all visits (p = 0.0084), but not for CMAP values.37
There are several methodological limitations of the selected studies that should be considered in the development of future studies, including the use of endogenous controls to report SMN transcript levels, tissue differences, and age as a confounder factor.
The discrepancies found among studies can be partially explained for by the use of different endogenous internal controls across studies to report SMN transcript levels. Most studies report SMN transcript results by normalizing SMN mRNA in relation to housekeeping gene transcripts.12,22,24,25,27 However, the expression level of housekeeping genes varies extensively in the general population38 between participants with different SMA phenotypes22,23 and in response to drug treatment.39 If endogenous controls are used in future clinical trials, it should be confirmed that the investigational drug does not modify the expression level of these controls. An alternative approach is used by Tiziano who developed an absolute real-time PCR essay, based on construction of standard curves and quantification of SMN mRNA molecules per total RNA,26 avoiding the use of endogenous housekeeping genes.
All selected studies tested investigated putative peripheral blood biomarkers, except for Vezain, and Wadman studies including SMN transcript measurements in muscle, and fibroblasts, respectively. The extent to which SMN mRNA and protein levels differ among different tissues is still largely unknown, but selected studies show no correlation between SMN mRNA in blood cells compared with fibroblasts,27 and skeletal muscle,24 which suggest important expression differences between tissues. Moreover, a study found that the highest expression of SMN transcripts in fetuses was in the spinal cord compared with other tissues.40 Taken together, it is uncertain whether SMA drug therapies will have the same effect in peripheral blood cells vs spinal motor neurons and whether putative blood biomarkers will be able to detect a treatment effect.
Age is an important confounding variable to be considered for future clinical trials. Studies suggest inverse relationship between age and SMN protein levels in peripheral blood in both patients with SMA and healthy controls,23,27 confirming previous studies in mice41 and humans42 suggesting age-specific differences in SMN expression.41,42 Reduced SMN expression may be a characteristic of normal aging because SMN expression has been found to be the highest during embryonic development, which declines after birth.43 Future clinical trials must consider age-matched control groups for each SMA phenotype.
Methodological limitations and conflicting results of selected studies prevent to recommend any blood-derived measures as biomarkers for SMA. Overall, there is no strong evidence suggesting that SMN-related putative biomarkers can predict disease severity or pharmacoresponse. Among non–SMN-related biomarkers, pNF-H seems a promising biomarker of disease activity and treatment effect in infants with SMA. Additional studies are needed with longitudinal assessment of patients with SMA across functional groups and comparisons with age-matched controls to evaluate the stability of these putative biomarkers over time and in response to SMA therapeutics.
Acknowledgment
The authors thank Advocate Aurora Health and the Aurora Research Institute for providing in-kind support for the study.
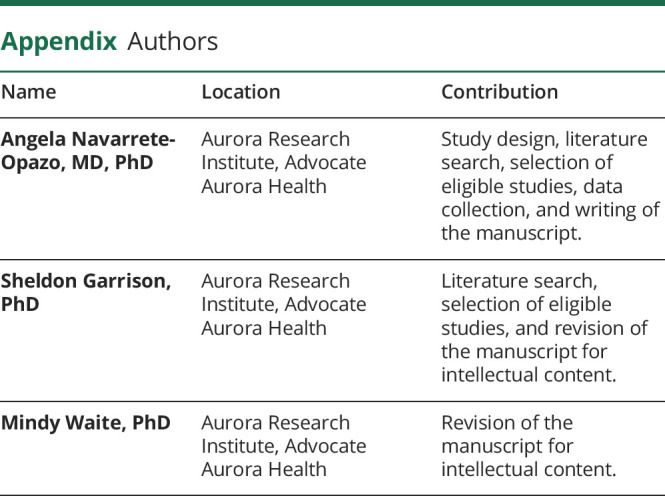
Appendix. Authors
Study Funding
No targeted funding reported.
Disclosure
The authors report no relevant disclosures. Full disclosure form information provided by the authors is available with the full text of this article at Neurology.org/cp.
References
- 1.Schmalbruch H, Haase G. Spinal muscular atrophy: present state. Brain Pathol 2001;11:231–247. [DOI] [PMC free article] [PubMed] [Google Scholar]
- 2.Lefebvre S, Bürglen L, Reboullet S, et al. Identification and characterization of a spinal muscular atrophy-determining gene. Cell 1995;80:155–165. [DOI] [PubMed] [Google Scholar]
- 3.Brzustowicz LM, Lehner T, Castilla LH, et al. Genetic mapping of chronic childhood-onset spinal muscular atrophy to chromosome 5q11.2-13.3. Nature 1990;344:540–541. [DOI] [PubMed] [Google Scholar]
- 4.Monani UR, De Vivo DC. Neurodegeneration in spinal muscular atrophy: from disease phenotype and animal models to therapeutic strategies and beyond. Future Neurol 2014;9:49–65. [DOI] [PMC free article] [PubMed] [Google Scholar]
- 5.Darras BT, Jones HR, Ryan MM, De Vivo DC. Neuromuscular Disorders of Infancy, Childhood, and Adolescence: A Clinician's Approach. 2015: Available at: www.clinicalkey.com/dura/browse/bookChapter/3-s2.0-C20130000771. Accessed October 15, 2019. [Google Scholar]
- 6.Nidetz NF, McGee MC, Tse LV, et al. Adeno-associated viral vector-mediated immune responses: understanding barriers to gene delivery. Pharmacol Ther 2020;207:107453. [DOI] [PMC free article] [PubMed] [Google Scholar]
- 7.Mendell JR, Al-Zaidy S, Shell R, et al. Single-dose gene-replacement therapy for spinal muscular atrophy. N Engl J Med 2017;377:1713–1722. [DOI] [PubMed] [Google Scholar]
- 8.Finkel RS, Mercuri E, Darras BT, et al. Nusinersen versus sham control in infantile-onset spinal muscular atrophy. N Engl J Med 2017;377:1723–1732. [DOI] [PubMed] [Google Scholar]
- 9.Ratni H, Ebeling M, Baird J, et al. Discovery of risdiplam, a selective survival of motor neuron-2 (SMN2) gene splicing modifier for the treatment of spinal muscular atrophy (SMA). J Med Chem 2018;61:6501–6517. [DOI] [PubMed] [Google Scholar]
- 10.Cheung AK, Hurley B, Kerrigan R, et al. Discovery of small molecule splicing modulators of survival motor neuron-2 (SMN2) for the treatment of spinal muscular atrophy (SMA). J Med Chem 2018;61:11021–11036. [DOI] [PubMed] [Google Scholar]
- 11.Bharucha-Goebel D, Kaufmann P. Treatment advances in spinal muscular atrophy. Curr Neurol Neurosci Rep 2017;17:91. [DOI] [PMC free article] [PubMed] [Google Scholar]
- 12.Sumner CJ, Kolb SJ, Harmison GG, et al. SMN mRNA and protein levels in peripheral blood: biomarkers for SMA clinical trials. Neurology 2006;66:1067–1073. [DOI] [PubMed] [Google Scholar]
- 13.Tiziano FD, Lomastro R, Di Pietro L, et al. Clinical and molecular cross-sectional study of a cohort of adult type III spinal muscular atrophy patients: clues from a biomarker study. Eur J Hum Genet 2013;21:630–636. [DOI] [PMC free article] [PubMed] [Google Scholar]
- 14.Querin G, Lenglet T, Debs R, et al. The motor unit number index (MUNIX) profile of patients with adult spinal muscular atrophy. Clin Neurophysiol 2018;129:2333–2340. [DOI] [PubMed] [Google Scholar]
- 15.Günther R, Neuwirth C, Koch JC, et al. Motor unit number index (MUNIX) of hand muscles is a disease biomarker for adult spinal muscular atrophy. Clin Neurophysiol 2019;130:315–319. [DOI] [PubMed] [Google Scholar]
- 16.Bonati U, Holiga Š, Hellbach N, et al. Longitudinal characterization of biomarkers for spinal muscular atrophy. Ann Clin Transl Neurol 2017;4:292–304. [DOI] [PMC free article] [PubMed] [Google Scholar]
- 17.Krosschell KJ, Bosch M, Nelson L, et al. Motor function test reliability during the neuroNEXT spinal muscular atrophy infant biomarker study. J Neuromuscul Dis 2018;5:509–521. [DOI] [PMC free article] [PubMed] [Google Scholar]
- 18.Higgins JPT, Thomas J, Chandler J, Cumpston M, Li T, Page MJ, Welch VA, eds. Cochrane Handbook for Systematic Reviews of Interventions. 2nd ed. Chichester, UK: John Wiley & Sons, 2019. [Google Scholar]
- 19.Moher D, Liberati A, Tetzlaff J, Altman DG; PRISMA Group. Preferred reporting items for systematic reviews and meta-analyses: the PRISMA statement. PLoS Med 2009;6:e1000097. [DOI] [PMC free article] [PubMed] [Google Scholar]
- 20.Munsat TL, Davies KE. International SMA consortium meeting. (26-28 June 1992, Bonn, Germany). Neuromuscul Disord 1992;2:423–428. [DOI] [PubMed] [Google Scholar]
- 21.Whiting PF, Rutjes AWS, Westwood ME, et al. QUADAS-2: a revised tool for the quality assessment of diagnostic accuracy studies. Ann Intern Med 2011;155:529–536. [DOI] [PubMed] [Google Scholar]
- 22.Crawford TO, Paushkin SV, Kobayashi DT, et al. Evaluation of SMN protein, transcript, and copy number in the biomarkers for spinal muscular atrophy (BforSMA) clinical study. PLoS One 2012;7:e33572. [DOI] [PMC free article] [PubMed] [Google Scholar]
- 23.Czech C, Tang W, Bugawan T, et al. Biomarker for spinal muscular atrophy: expression of SMN in peripheral blood of SMA patients and healthy controls. PLoS One 2015;10:e0139950. [DOI] [PMC free article] [PubMed] [Google Scholar]
- 24.Vezain M, Saugier-Veber P, Melki J, et al. A sensitive assay for measuring SMN mRNA levels in peripheral blood and in muscle samples of patients affected with spinal muscular atrophy. Eur J Hum Genet 2007;15:1054–1062. [DOI] [PubMed] [Google Scholar]
- 25.Kolb SJ, Coffey CS, Yankey JW, et al. Baseline results of the neuroNEXT spinal muscular atrophy infant biomarker study. Ann Clin Transl Neurol 2016;3:132–145. [DOI] [PMC free article] [PubMed] [Google Scholar]
- 26.Tiziano FD, Pinto AM, Fiori S, et al. SMN transcript levels in leukocytes of SMA patients determined by absolute real-time PCR. Eur J Hum Genet 2010;18:52–58. [DOI] [PMC free article] [PubMed] [Google Scholar]
- 27.Wadman RI, Stam M, Jansen MD, et al. A comparative study of SMN protein and mRNA in blood and fibroblasts in patients with spinal muscular atrophy and healthy controls. PLoS One 2016;11:e0167087. [DOI] [PMC free article] [PubMed] [Google Scholar]
- 28.Zheleznyakova GY, Voisin S, Kiselev AV, et al. Genome-wide analysis shows association of epigenetic changes in regulators of Rab and Rho GTPases with spinal muscular atrophy severity. Eur J Hum Genet 2013;21:988–993. [DOI] [PMC free article] [PubMed] [Google Scholar]
- 29.Finkel RS, Crawford TO, Swoboda KJ, et al. Candidate proteins, metabolites and transcripts in the biomarkers for spinal muscular atrophy (BforSMA) clinical study. PLoS One 2012;7:e35462. [DOI] [PMC free article] [PubMed] [Google Scholar]
- 30.Darras BT, Crawford TO, Finkel RS, et al. Neurofilament as a potential biomarker for spinal muscular atrophy. Ann Clin Transl Neurol 2019;6:932–944. [DOI] [PMC free article] [PubMed] [Google Scholar]
- 31.Zheleznyakova GY, Kiselev AV, Vakharlovsky VG, et al. Genetic and expression studies of SMN2 gene in Russian patients with spinal muscular atrophy type II and III. BMC Med Genet 2011;12:96. [DOI] [PMC free article] [PubMed] [Google Scholar]
- 32.Yuan A, Rao MV, Veeranna, Nixon RA. Neurofilaments and neurofilament proteins in Health and disease. Cold Spring Harb Perspect Biol 2017;9:a018309. [DOI] [PMC free article] [PubMed] [Google Scholar]
- 33.Khalil M, Teunissen CE, Otto M, et al. Neurofilaments as biomarkers in neurological disorders. Nat Rev Neurol 2018;14:577–589. [DOI] [PubMed] [Google Scholar]
- 34.Laurent L, Wong E, Li G, et al. Dynamic changes in the human methylome during differentiation. Genome Res 2010;20:320–331. [DOI] [PMC free article] [PubMed] [Google Scholar]
- 35.Hauke J, Riessland M, Lunke S, et al. Survival motor neuron gene 2 silencing by DNA methylation correlates with spinal muscular atrophy disease severity and can be bypassed by histone deacetylase inhibition. Hum Mol Genet 2009;18:304–317. [DOI] [PMC free article] [PubMed] [Google Scholar]
- 36.Lewelt A, Krosschell KJ, Scott C, et al. Compound muscle action potential and motor function in children with spinal muscular atrophy. Muscle Nerve 2010;42:703–708. [DOI] [PMC free article] [PubMed] [Google Scholar]
- 37.Bertini E, Dessaud E, Mercuri E, et al. Safety and efficacy of olesoxime in patients with type 2 or non-ambulatory type 3 spinal muscular atrophy: a randomised, double-blind, placebo-controlled phase 2 trial. Lancet Neurol 2017;16:513–522. [DOI] [PubMed] [Google Scholar]
- 38.Bustin SA. Absolute quantification of mRNA using real-time reverse transcription polymerase chain reaction assays. J Mol Endocrinol 2000;25:169–193. [DOI] [PubMed] [Google Scholar]
- 39.Brichta L, Holker I, Haug K, Klockgether T, Wirth B. In vivo activation of SMN in spinal muscular atrophy carriers and patients treated with valproate. Ann Neurol 2006;59:970–975. [DOI] [PubMed] [Google Scholar]
- 40.Soler-Botija C, Cuscó I, Caselles L, López E, Baiget M, Tizzano EF. Implication of fetal SMN2 expression in type I SMA pathogenesis: protection or pathological gain of function? J Neuropathol Exp Neurol 2005;64:215–223. [DOI] [PubMed] [Google Scholar]
- 41.Kobayashi DT, Olson RJ, Sly L, et al. Utility of survival motor neuron ELISA for spinal muscular atrophy clinical and preclinical analyses. PLoS One 2011;6:e24269. [DOI] [PMC free article] [PubMed] [Google Scholar]
- 42.Kobayashi DT, Decker D, Zaworski P, et al. Evaluation of peripheral blood mononuclear cell processing and analysis for survival motor neuron protein. PLoS One 2012;7:e50763. [DOI] [PMC free article] [PubMed] [Google Scholar]
- 43.Burlet P, Huber C, Bertrandy S, et al. The distribution of SMN protein complex in human fetal tissues and its alteration in spinal muscular atrophy. Hum Mol Genet 1998;7:1927–1933. [DOI] [PubMed] [Google Scholar]
Associated Data
This section collects any data citations, data availability statements, or supplementary materials included in this article.
Data Availability Statement
Data used in this systematic review are the data reported by each selected article. We do not have additional data not published within each article.


