Abstract
The identification of prostate stem/progenitor cells and characterization of the prostate epithelial cell lineage hierarchy are critical for understanding prostate cancer initiation. Here, we characterized 35,129 cells from mouse prostates, and identified a unique luminal cell type (termed Luminal-C) marked by Tacstd2, Ck4 and Psca expression. Luminal-C cells located at the distal prostate invagination tips (termed Dist-Luminal-C) exhibited greater capacity for organoid formation in vitro and prostate epithelial duct regeneration in vivo. Lineage tracing of Luminal-C cells indicated that Dist-Luminal-C cells reconstituted distal prostate luminal lineages through self-renewal and differentiation. Deletion of Pten in Dist-Luminal-C cells resulted in prostatic intraepithelial neoplasia. We further characterized 11,374 human prostate cells and confirmed the existence of h-Luminal-C cells. Our study provides insights into the prostate lineage hierarchy, identifies Dist-Luminal-C cells as the luminal progenitor cell population in invagination tips and suggests one of the potential cellular origins of prostate cancer.
Introduction
The prostate epithelium is comprised of luminal cells, basal cells and neuroendocrine cells1,2. Although the existence of both basal and luminal stem cells in the prostate has been reported, their identification remains elusive, and the prostate epithelial cell lineage hierarchy remains poorly defined. Using functional prostate regeneration assays from isolated cells3, previous studies demonstrated that some basal cells can give rise to all three prostate epithelial cell lineages4–7. Recently, several independent groups, including ours, showed that both basal and luminal cells can generate organoids containing basal and luminal cell lineages8–10. Basal and luminal cells isolated from the prostate and placed in artificial conditions have the capacity to transdifferentiate5,11. In vivo lineage tracing experiments have shown that both basal and luminal cell populations of the adult mouse prostate are largely independently self-sustained12,13, and multipotent and unipotent progenitors were identified during prostate postnatal development13. However, two independent studies have shown that rare basal cells have the capacity to generate luminal cells during prostate regeneration in vivo14,15. In addition, two previous studies implied that rare castration-resistant prostate luminal cell populations, namely, castration-resistant Nkx3–1-expressing cells (CARNs) and castration-resistant Bmi1-expressing cells (CARBs), can serve as prostate luminal stem/progenitor cells11,16. Sca-1+/Nkx3.1− luminal cells in the proximal prostate region have been identified as bipotent prostate luminal progenitor cells under organoid culture conditions17,18. Whether there are distinct subclasses of luminal cells with stem/progenitor properties in the distal region of the intact prostate is still unknown19. Notably, the cell type expressing defined markers that function as prostate luminal stem/progenitor cells under physiological conditions has yet to be identified.
Prostate cancer is one of the most common cancers worldwide and also the second leading cause of cancer-related death in males in Western countries. Although the majority of human primary prostate cancers have a luminal phenotype, both basal cells and luminal cells can serve as cellular origins of prostate cancer in model systems5,11,12,14,16,20. However, the stem cell-like plasticity of defined prostate epithelial cells and the cellular origin of prostate cancer under physiological conditions have not been identified. Recently, prostate basal and luminal cell populations were both shown to be self-sustaining, and both cell types could initiate prostate cancer. However, the oncogenic transformation of basal cells requires basal to luminal cell transition12. In addition, luminal cells were shown to have greater tendency to be the cells of origin for prostate cancer in some contexts12,21. These studies highlight the need to identify luminal stem/progenitor cells and characterize their behaviors in various contexts.
The unbiased characterization of individual prostate cells may provide a fundamental understanding of the prostate epithelial cell lineage hierarchy and indicate the potential stem/progenitor cell types. Recently, emerging single-cell RNA sequencing (scRNA-seq) technology has allowed the interrogation of global gene expression in thousands of individual cells in a single experiment22–24. Herein, we successfully profiled 35,129 adult mouse prostate cells and 11,374 human prostate cells through scRNA-seq. With this powerful approach, we thoroughly defined the total prostate luminal cell population and identified a candidate population with luminal stem/progenitor properties during prostate homeostasis and regeneration; moreover, we showed the potential of these cells as the cellular origin of prostate cancer initiation.
Results
Elucidation of the prostate luminal cell hierarchy and identification of a unique Luminal-C cell population
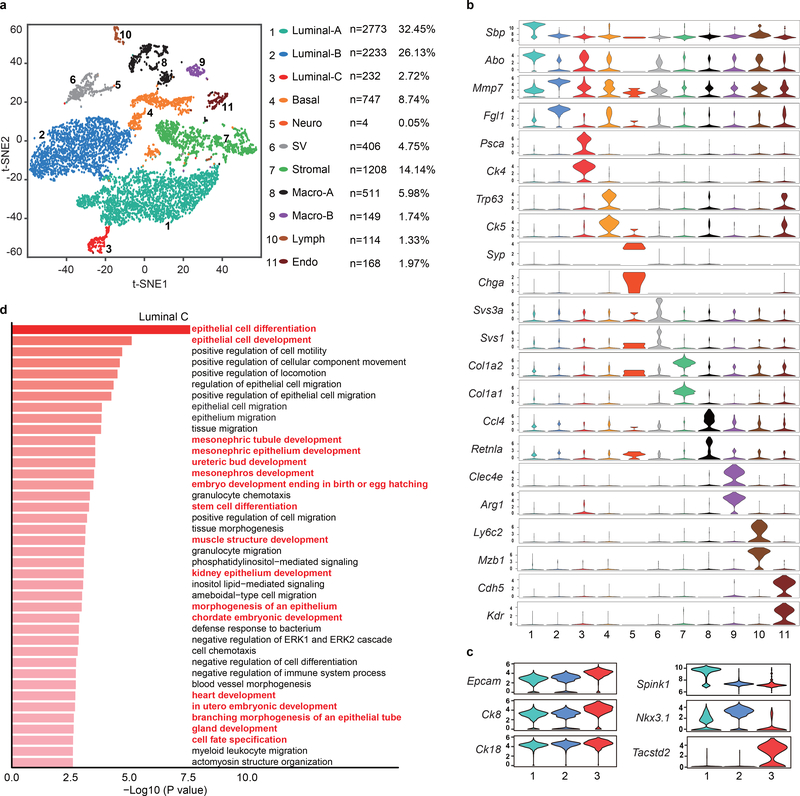
Using droplet-based scRNA-seq, we profiled 8,545 individual cells from freshly dissociated whole prostates of 4 healthy adult male Tmprss2CreERT2/+; Rosa26EYFP/+ (T2Y) mice 2 weeks after tamoxifen administration25 (Supplementary Fig. 1a–e) (see Methods). In these mice, the expression of tamoxifen-inducible Cre recombinase is driven by a luminal-specific Tmprss2 promoter and upon tamoxifen administration, YFP is expressed in luminal cells25. Clustering analysis identified 11 distinct cell clusters of 4 to 2,773 cells each (Fig. 1a). Cells from the 4 mouse prostates were distributed evenly in all 11 clusters, and each cluster contained cells from at least three mice (Supplementary Fig. 1f,g).
Figure 1 |. Single-cell transcriptomic survey of mouse prostate cells.
a, Visualization of the clustering of 8,545 single cells (points; n = 4 mice) based on the expression of known marker genes by t-SNE (left panel). The numbers and percentages of the assigned cell types are summarized in the right panel. Luminal-A, type A luminal cell; Luminal-B, type B luminal cell; Luminal-C, type C luminal cell; Basal, basal cell; Neuro, neuroendocrine cell; SV, seminal vesicle epithelial cell; Stromal, stromal cell; Macro-A, macrophage-A; Macro-B, macrophage-B; Lymph, lymphocyte; Endo, endothelial cell. b, Violin plots showing the expression levels of representative marker genes across the main clusters (n = 8,545 cells). c, Violin plots showing the expression levels of representative marker genes across the three luminal cell clusters. The y axis shows the log-scale normalized read count (n = 5,238 cells). d, Top 40 significantly enriched (Methods; P value < 0.01; −log10 (P value)) gene ontology terms in the gene signature for the Luminal-C subtype (n = 232 cells).
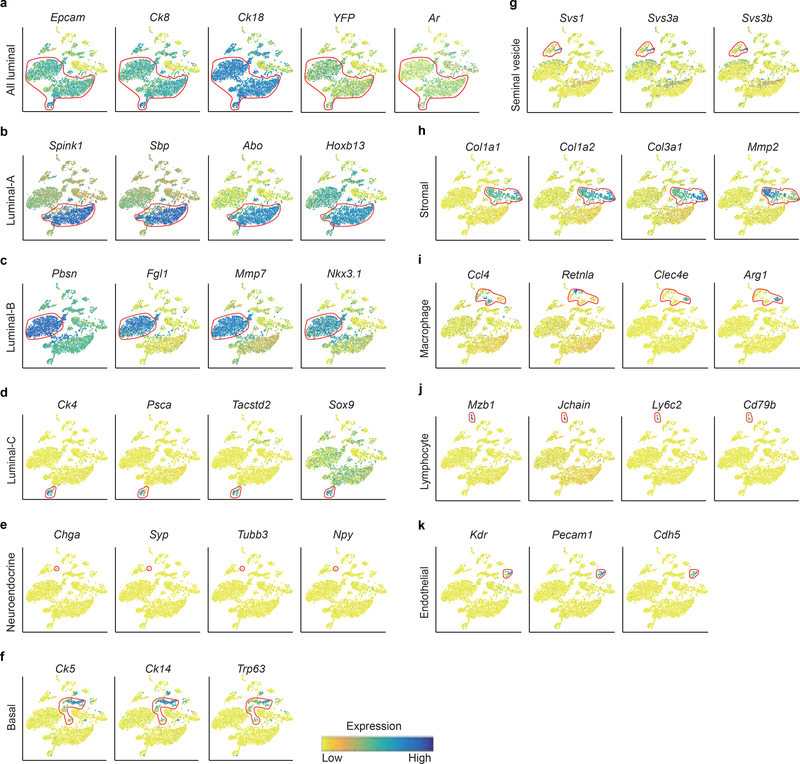
To define the cellular identity of each cluster, we performed differential gene expression analysis and identified cluster-specific marker genes (Fig. 1b) (Supplementary Table 1). In most cases, the cluster-specific identifier was a known cell lineage-specific marker (Fig. 1b and Extended Data Fig. 1). Strikingly, the luminal cell population was separated into three distinct clusters (Fig. 1a) that could not be distinguished by well-established luminal cell markers, such as Ck8 and Ck18, or by Tmprss2CreERT2-activated YFP (Fig. 1c and Extended Data Fig. 1a and Supplementary Fig. 2a). We identified markers to classify these three clusters: Luminal-A cluster (Hoxb13high/Abohigh/Spink1high), Lumina-B cluster (Nkx3.1high/Mmp7high/Fgl1high/Pbsnhigh) and Luminal-C cluster (Tacstd2high/Pscahigh/Ck4high) (Fig. 1b,c, and Extended Data Fig. 1b–d and Supplementary Fig. 2a,b). Immunofluorescence confirmed that the Tacstd2-positive Luminal-C cells are Ck8-positive and AR-positive luminal cells (Supplementary Fig. 2c,d). Furthermore, we found similar patterns for Luminal-A, Luminal-B and Luminal-C cells in the WT mouse prostate (Supplementary Fig. 3) (Supplementary Note). Interestingly, the protein products of Tacstd2 (known as Trop2) and Psca have been characterized as a stem cell marker in the basal layer5 and a prostate cancer-associated tumor antigen, respectively26.
The Luminal-A and Luminal-B cell populations were enriched in functional categories like protein folding, ion homeostasis and body fluid secretion (Supplementary Fig. 4a,b). The prostate secretion-associated genes Spink1 and Pbsn were highly expressed in Luminal-A and Luminal-B cells, respectively, indicating that these cells are functionally differentiated (Fig. 1b and Extended Data Fig. 1b,c and Supplementary Fig. 2a,b). Notably, the Luminal-C cluster was enriched in tissue development and epithelial cell differentiation, suggesting that this cell population has stem/progenitor properties (Fig. 1d) (Supplementary Table 2). Furthermore, Monocle227 was used to perform cell trajectory analysis of luminal cell clusters. We observed a trajectory from Luminal-C to Luminal-A and Luminal-B (Supplementary Fig. 5) (Supplementary Note), suggesting that Luminal-C cells are potential progenitor cells.
Altogether, our single-cell transcriptomics survey provides a fundamental molecular definition of the mouse prostate cell atlas and identifies three defined luminal cell types, including a unique Luminal-C cell population related to tissue development.
Lobe-specific distribution of luminal clusters
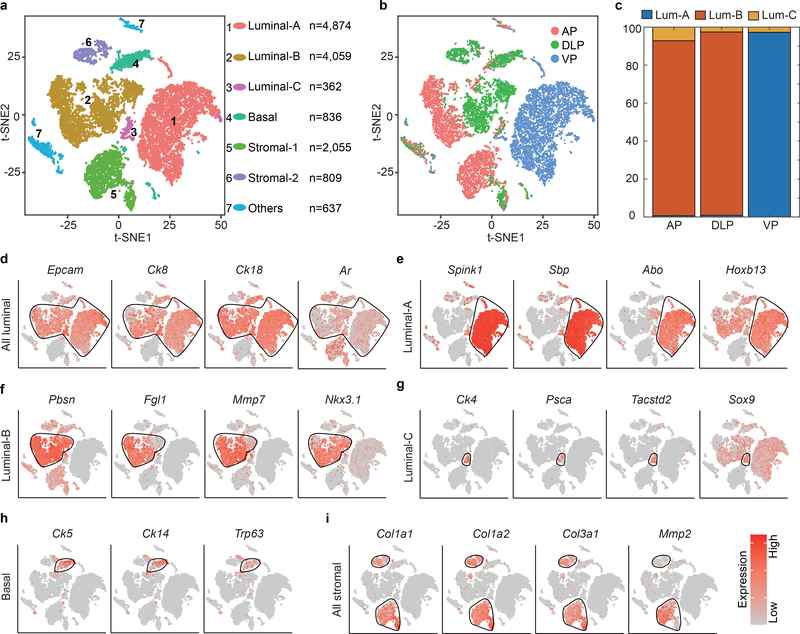
To investigate the distribution patterns of these prostate luminal cell lineages, we profiled 13,744 individual cells from the freshly dissociated anterior prostate (AP), ventral prostate (VP) and dorsal-lateral prostate (DLP) of 10-week-old WT mice. Luminal cell populations had distinct distribution patterns in the three different mouse prostate lobes (Extended Data Fig. 2a–c). To define the cellular identity of each mouse prostate cell cluster, we identified cluster-specific marker genes (Extended Data Fig. 2d–i) (Supplementary Table 3). We found that Luminal-A cells were mainly distributed in the VP, whereas Luminal-B cells were predominantly localized in the AP and DLP (Extended Data Fig. 2a–f). Remarkably, Luminal-C cells were distributed in all three prostate lobes (Extended Data Fig. 2a–c,g). These results further confirmed the existence of the Luminal-C cell population and identified the lobe-specific distribution of Luminal-A and Luminal-B cells.
Location and characterization of the luminal cell clusters
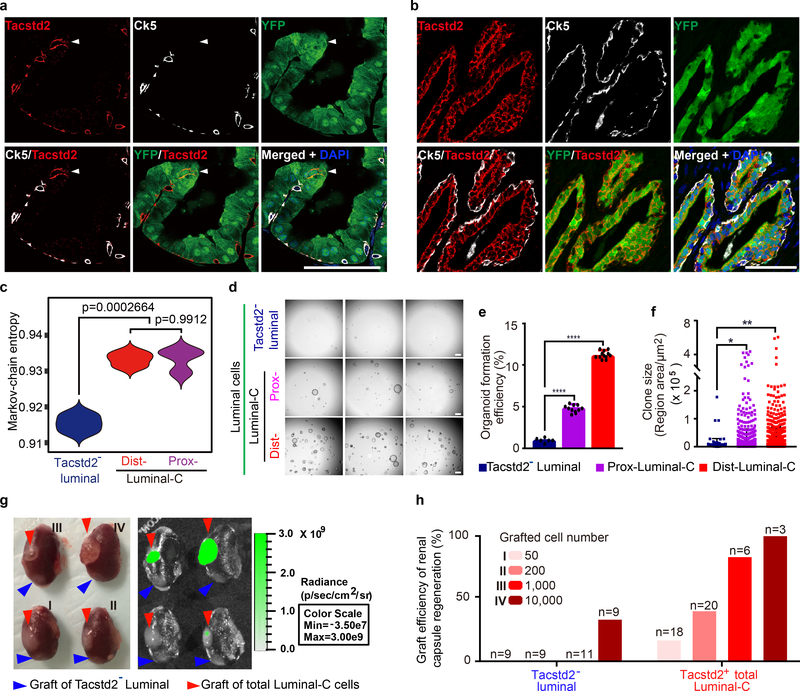
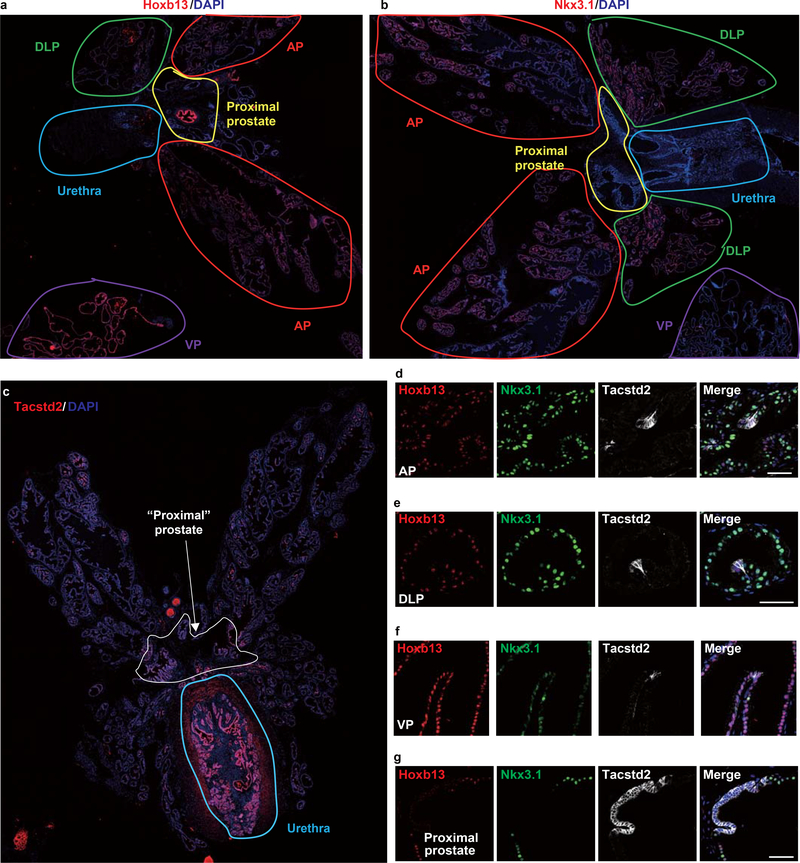
To confirm the distribution patterns of the prostate luminal cell lineages, we performed co-immunofluorescence for representative protein markers of the three luminal cell clusters in WT and T2Y mouse prostates: Hoxb13 (Luminal-A), Nkx3.1 (Luminal-B) and Tascstd2 (Luminal-C). Through whole-mount prostate scanning, we confirmed that Luminal-A cells (Hoxb13high) were mainly distributed in the VP, whereas Luminal-B cells (Nkx3.1high) were predominantly localized in the AP and DLP (Extended Data Fig. 3a,b,d–f). Interestingly, we found that Luminal-C cells (Tacstd2+/Hoxb13low/Nkx3.1low) formed small clusters at the prostate glandular invagination tips and were spatially separated from the other two luminal cell clusters in the distal AP, DLP and VP lobes (Fig. 2a and Extended Data Fig. 3c–f). Luminal-A (Hoxb13high/Nkx3.1low) and Luminal-B (Nkx3.1high/Hoxb13low) cells were distributed in different prostate lobes and were clearly negative for the Luminal-C cell cluster marker Tacstd2 (Extended Data Fig. 3a,b,d–f). Transplantation assays showed that the proximal periureteral prostate is known to be enriched in stem cells that can regenerate the prostate. We found that Tacstd2 outlined a continuous luminal cells (Tacstd2+/Hoxb13low/Nkx3.1low/YFP+) in the proximal prostate (Fig. 2b and Extended Data Fig. 3g). To distinguish these two types of Luminal-C cells, we used Dist-Luminal-C cells and Prox-Luminal-C cells to indicate the Luminal-C cells in the distal and the proximal regions of the prostate, respectively.
Figure 2 |. Localization and characterization of Luminal-C cells.
a,b, Immunofluorescence staining for YFP and Tacstd2 shows that Luminal-C cells are in the distal prostate invagination tip (arrow) (a) and proximal prostate region (b) of T2Y mice. c, Violin plot comparing the Markov-chain entropy (MCE) of Tacstd2-negative luminal cells (n = 3 samples), Dist-Luminal-C cells (n = 3 samples) and Prox-Luminal-C cells (n = 3 samples). The P value is from the one-sided t test. d, Micrographs of organoids formed by Tacstd2-negative luminal cells, Prox-Luminal-C cells and Dist-Luminal-C cells isolated from the T2Y mouse prostate and cultured in Matrigel with mouse prostate organoid medium (scale bars, 500 μm). e,f, Organoid formation efficiency (n = 6, n = 11, n = 12) (e) and organoid size (n = 109, n = 891, n = 1,029) (f) of Tacstd2-negative luminal cells, Pro-Luminal-C cells and Dis-Luminal-C cells calculated after one week of culture. The data are presented as the mean ± standard deviation of five replicates, and 3 mice were used for each experiment. g, Photographs of renal capsule regeneration with 50 cells (I), 200 cells (II), 1,000 cells (III) and 10,000 cells (IV) at 2.5 months after transplantation. The red arrowheads show Luminal-C cell grafts, and the blue arrowheads show Tacstd2− luminal cell grafts. Bioluminescence intensity is shown in photons per second per centimeter squared per steradian (p s−1 cm−2 sr−1) h, Box plot of the graft efficiency of Tacstd2-negative luminal cells and total Luminal-C cells. Six mice were used for each experiment, and each experiment was performed three times. Scale bars, 50 μm (a,b). Data were analyzed by unpaired two-tailed Student’s t test, * P < 0.05, ** P < 0.01, *** P < 0.001 and **** P < 0.0001 (e,f).
Next, we further characterized the localization of the Luminal-C cell population in the WT mouse prostate using Tacstd2 immunofluorescence. In the glandular prostate, which includes all four prostate lobes, Tacstd2 outlined most basal cells (Tacstd2low/Ck5+/Ck14+/Trp63+) (Supplementary Fig. 6a). Among Ck8-positive luminal cells, Tacstd2-positive Dist-Luminal-C cells localized to distal prostate glandular invagination tips (Extended Data Fig. 3c–f and Supplementary Fig. 6a). We then scanned thick sections of the WT mouse prostate and reconstituted the prostate invagination tips. Consistently, Tacstd2-positive Dist-Luminal-C cells were located at these invagination tips (Supplementary Fig. 7). In the proximal periureteral prostate, Tacstd2 outlined both Ck5-positive basal cells and CK8-positive Prox-Luminal-C cells (Supplementary Fig. 6b). Although the adult prostate epithelium has a slow cell turnover rate, the location of Dist-Luminal-C cells indicated regions reminiscent of crypts in the intestinal epithelium and terminal end buds of the breast epithelial duct28–31.
Both Dist-Luminal-C and Prox-Luminal-C cells are prostate luminal progenitor cells
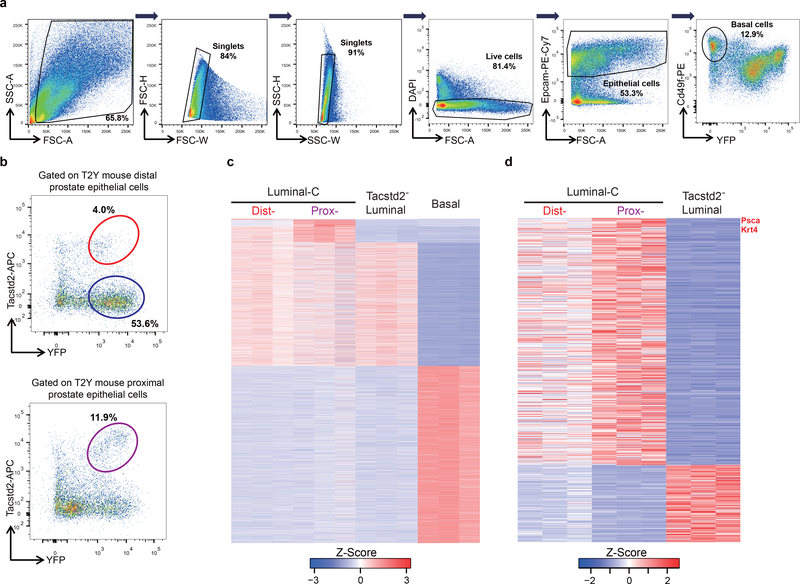
To compare the global gene expression profile of Luminal-C cells with that of other prostate epithelial cells, Dist-Luminal-C cells (Tacstd2+/YFP+), Prox-Luminal-C cells (Tacstd2+/YFP+), normal luminal cells (Tacstd2−/YFP+), and basal cells (CD49fhigh/YFP−) were isolated from three T2Y mouse prostates (Extended Data Fig. 4a,b). RNA-seq of sorted cells validated the Luminal-C-specific markers, including Psca and Ck4 (Extended Data Fig. 4c,d) (Supplementary Table 4). Using a well-established stemness signature of multiple lineages32, Markov-chain entropy analysis demonstrated that both Dist-Luminal-C and Prox-Luminal-C cells had a significantly higher stemness potency score than Tacstd2− luminal cells (Fig. 2c).
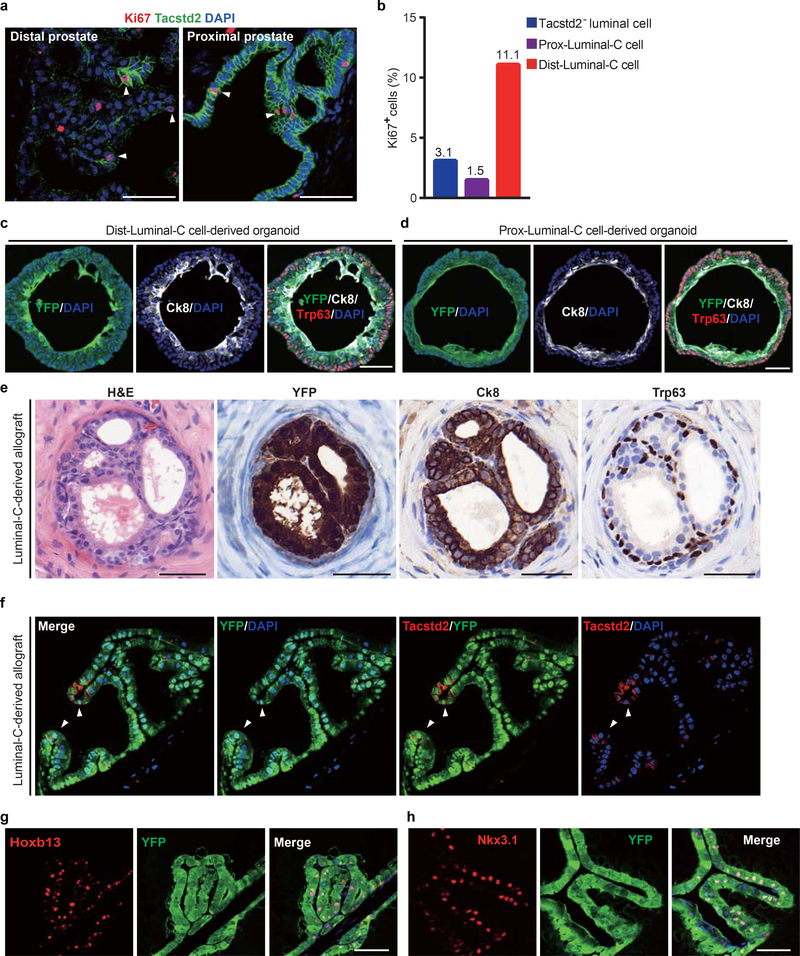
We then functionally analyzed the Luminal-C cell population. In the distal prostate, the Dist-Luminal-C cell population contained a significantly higher percentage of Ki-67-positive cells than the Tacstd2-negative luminal cell population (Extended Data Fig. 5a,b). We further examined Luminal-C cells by in vitro organoid formation and in vivo transplantation assays. We isolated Tacstd2-negative luminal cells (Tacstd2−/YFP+), Dist-Luminal-C cells (Tacstd2+/YFP+) and Prox-Luminal-C cells (Tacstd2+/YFP+) from tamoxifen-treated T2Y mice and compared their organoid-forming efficiency as previously described9. We found that Dist-Luminal-C and Prox-Luminal-C cells exhibited six-fold and three-fold higher organoid-forming efficiency, respectively, than Tacstd2-negative luminal cells (Fig. 2d–f). The organoids generated from Dist-Luminal-C and Prox-Luminal-C cells were entirely YFP-positive and expressed both a basal marker (Trp63) and a luminal marker (Ck8) (Extended Data Fig. 5c,d). To investigate the ability of these cells to reconstitute the prostate gland, Luminal-C cells (Tacstd2+/YFP+) or Tacstd2-negative luminal cells (Tacstd2−/YFP+) isolated from T2Y mice were combined with rat embryonic urogenital mesenchymal cells and subjected to renal capsule grafting. We found that total Luminal-C cells generated the prostate gland more efficiently than Tacstd2-negative luminal cells (P < 0.001) (Fig. 2g,h). The regenerated prostatic epithelium ducts were entirely YFP-positive and contained both a basal cell layer (Trp63-positive cells) and a luminal cell layer (Ck8-positive cells) (Extended Data Fig. 5e). Remarkably, the Tacstd2-positive Luminal-C cells resided in the regenerated prostatic invagination tips (Extended Data Fig. 5f). Interestingly, Luminal-C cells generated both Hoxb13high and Nkx3.1high luminal daughter cells in the renal capsule transplantation assay (Extended Data Fig. 5e). These results demonstrate that both Dist-Luminal-C and Prox-Luminal-C cells are prostate luminal progenitor cells, and the newly identified Dist-Luminal-C cells are located at the invagination tips in the distal regions of the prostate.
Classification of castrated mouse prostate cells
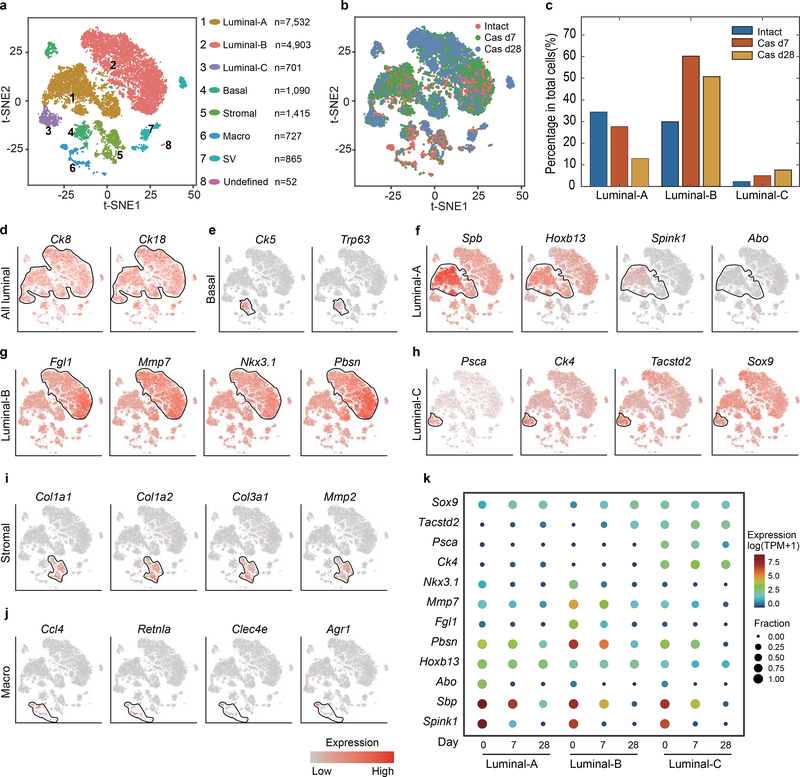
Previous studies highlighted the need to characterize androgen-independent prostate luminal cells11,12,16. To ascertain the response of different luminal cell lineages to androgen deprivation in vivo, we generated scRNA-seq profiles of T2Y mouse prostates at 7 or 28 days after castration and successfully integrated these profiles with the 4 intact T2Y mouse prostate scRNA-seq profiles. Unbiased clustering analysis identified 8 distinct cell clusters (Extended Data Fig. 6a,b). Luminal-C cells were 3.5-fold enriched in castrated (28 days) versus intact mice, further indicating their potential role as progenitor cells (Extended Data Fig. 6a–h). After castration, the majority (> 50%) of persistent luminal cells were Luminal-B cells; the Luminal-A cell population significantly decreased from 34.4% to 12.8% (Extended Data Fig. 6a–g). As expected, there was a dramatic decline in the expression of androgen-regulated genes, such as Spink1 and Abo in Luminal-A cells and Pbsn and Nkx3.1 in Luminal-B cells. On the other hand, the Luminal-A- or Luminal-B-specific expression of androgen receptor-independent genes, such as Hoxb13, Mmp7, and Fgl1, was maintained. Notably, Ck4, Tacstd2 and Sox9 remained specifically expressed in Luminal-C cells (Extended Data Fig. 6f–h,k). These results indicate that these three different luminal cell lineages remained distinct from each other after castration despite robust changes in androgen levels.
Luminal-C cell labeling and characterization
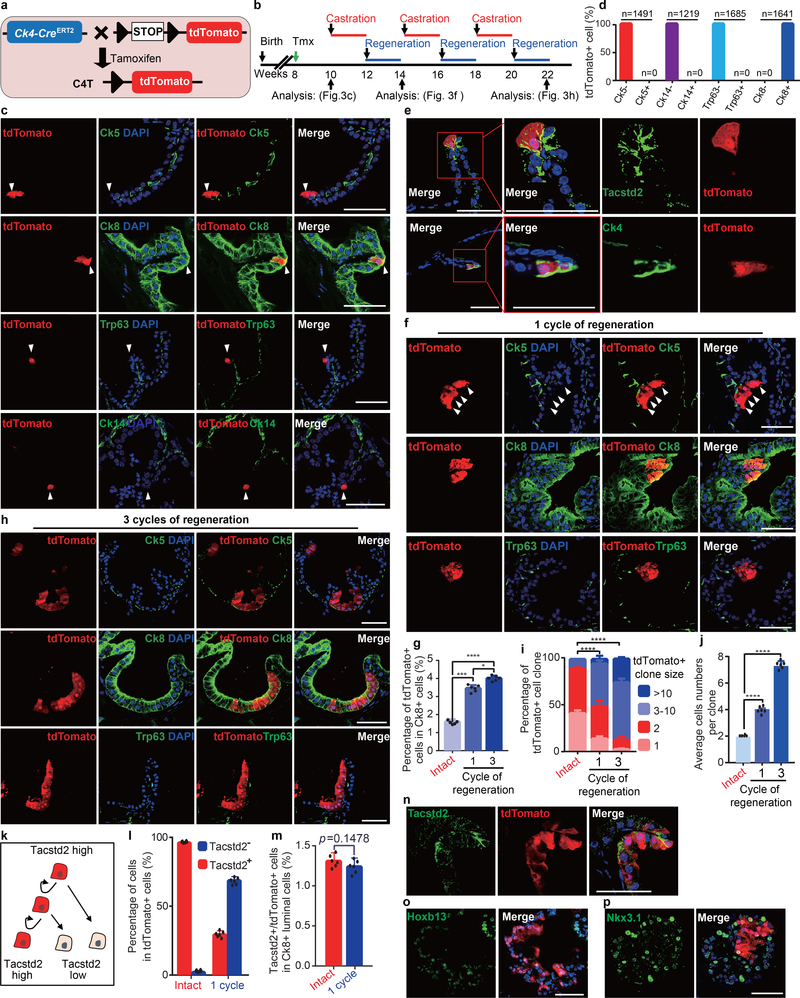
To trace the fate of Luminal-C cells in vivo, we generated two Luminal-C-specific lineage tracing models by knocking-in the CreERT2 cassette under control of the Ck4 or Psca promoters (Supplementary Fig. 8a,b). We crossed Ck4CreERT2/+ and PscaCreERT2/+ mice with the Rosa26tdTomato/+ 33 and Rosa26EYFP/+34 reporter strains, respectively, to generate Ck4CreERT2/+;Rosa26tdTomato/+ (C4T) and PscaCreERT2/+;Rosa26EYFP/+ (PaY) mice (Fig. 3a and Extended Data Fig. 7a). In the C4T mouse prostate, the tdTomato-positive cells were strictly positive for the luminal cell marker Ck8, negative for basal cell markers Trp63, Ck5 and Ck14 (Fig. 3b–d), negative for the non-epithelial cell markers (Supplementary Fig. 9a,b). We found that Cre-mediated recombination after tamoxifen injection recapitulated the localization pattern of Dist-Luminal-C cells in the invagination tips of the distal regions in the adult C4T mouse prostate (Fig. 3c and Supplementary Fig. 10a). The lineage-marked tdTomato-positive cells were also positive for Tacstd2 and Ck4 (Fig. 3e). Notably, we found a similar pattern of localization and marker expression for lineage-marked Dist-Luminal-C and Prox-Luminal-C cells in the PaY mouse prostate (Extended Data Fig. 4b–e, Supplementary Figs. 9c,d and 10b). These results demonstrate that lineage-marked cells in the distal region of the C4T and PaY mouse prostate faithfully recapitulate the localization of the identified Dist-Luminal-C cell population in T2Y mice.
Figure 3 |. Lineage tracing of Ck4-expressing Dist-Luminal-C cells.
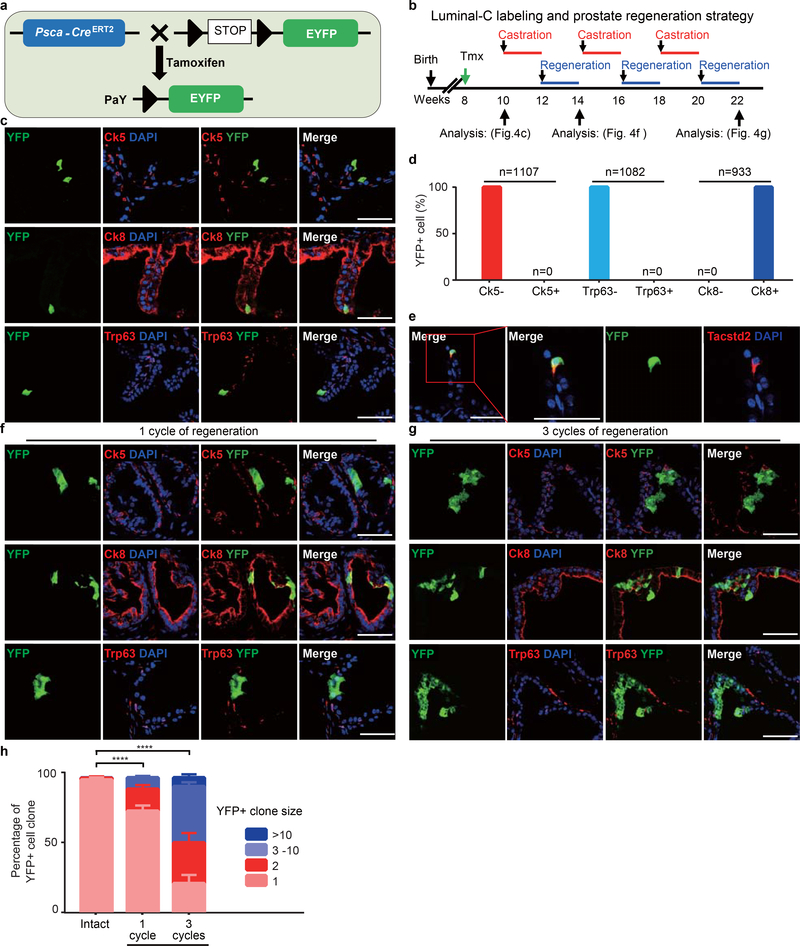
a, Schematic of the targeting strategy to generate C4T (Ck4CreERT2/+;Rosa26td-Tomato/+) mice to label Ck4-expressing cells by tdTomato expression. b, Timeline of Luminal-C cell labeling and prostate regression-regeneration in the C4T mouse prostate. c, Co-immunofluorescence of Ck5, Ck8, Ck14 and Trp63 with endogenous tdTomato in the distal region of the intact C4T mouse 2 weeks after tamoxifen injection. d, Percentage of tdTomato+ cells among Ck5− cells, Ck5+ cells (n = 1,491), Ck14− cells, Ck14+ cells (n = 1,219), Trp63− cells, Trp63+ cells (n = 1,685), Ck8− cells and Ck8+ cells (n = 1,641) in the 10 week C4T mouse prostate. e, Co-immunofluorescence of Tacstd2 and Ck4 with endogenous tdTomato in the distal region of the intact C4T mouse prostate 2 weeks after tamoxifen injection. f, Immunostaining of Ck5, Ck8 and Trp63 with endogenous tdTomato in the regenerated prostate after one regression-regeneration cycle. g, Percentage of tdTomato-positive cells among Ck8-positive luminal cells in the distal region of the intact and regenerated C4T mouse prostate after one or three regression-regeneration cycles (n = 6 mice/group). h, Immunostaining of Ck5, Ck8 and Trp63 with endogenous tdTomato in the regenerated prostate after three regression-regeneration cycles. i,j, Percentage of tdTomato+ cell clones (i) and average colony size (j) in the intact and regenerated prostate after one or three regression-regeneration cycles. k-m, Luminal-C cells drive prostate luminal cell regeneration by a self-renewal mechanism (k). Quantification of tdTomato-labeled cell progeny showed that Tacstd2+/tdTomato+ Dist-Luminal C cells both self-renew to replenish Tacstd2+ Luminal-C cells and differentiate into Tacstd2− daughter luminal cells (n = 6 mice/group) (l). The percentage of Tacstd2+/tdTomato+ Dist-Luminal C cells was sustained during the regression-regeneration period (n = 6 mice/group) (m). n, Immunostaining of Tacstd2, Nkx3.1 and Hoxb13 with endogenous tdTomato in the regenerated prostate after one regression-regeneration cycle. Six mice were used for each experiment. Data show mean ± standard deviation (g, j, l and m), two-way ANOVA (i) and unpaired two-tailed Student’s t test (g,j,l and m). * P < 0.05, ** P < 0.01, *** P < 0.001 and **** P < 0.0001, (d,g,i,j,l,m). Scale bars, 50 μm (c,e,f,h,n).
Dist-Luminal-C cells reconstitute the distal prostate luminal lineage through self-renewal and differentiation
Next, we aimed to characterize their behavior in vivo by long-term lineage tracing. We performed prostate regression-regeneration assays using cycles of castration and testosterone administration in C4T and PaY mice (Fig. 3b and Extended Data Fig. 7b). Strikingly, ribbons of lineage-marked Ck8-positive luminal cells emanated from prostate glandular invagination tips after one regression-regeneration cycle (Fig. 3f and Extended Data Fig. 7f). In C4T mice, tdTomato-positive Dist-Luminal-C cells represented 1.3 ± 0.09% of distal C4T prostate luminal epithelial cells 14 days after tamoxifen treatment, but the populations of tdTomato-positive progeny of these cells significantly increased to 3.5 ± 0.06% and 4.1 ± 0.12% of distal C4T prostate luminal epithelial cells after one and three regression-regeneration cycles, respectively (Fig. 3f,g). After three regression-regeneration cycles, the lineage-marked Dist-Luminal-C cell clones had further expanded in the distal prostate of C4T and PaY mice (Fig. 3h,i and Extended Data Fig. 4g,h). In the C4T mouse distal prostate, the average clone size increased gradually from 1.9 ± 0.03 cells at 14 days to 4.9 ± 0.03 cells after one regression-regeneration cycle and to 7.2 ± 0.15 cells after three regression-regeneration cycles (Fig. 3j).
Since stem cells can both self-renew and generate differentiated progeny, we aimed to determine whether Dist-Luminal-C cells can both maintain Tacstd2-positive Luminal-C cells and generate Tacstd2-negative luminal cells (Fig. 3k). We quantified Tacstd2-positive cells among tdTomato-labeled distal prostate luminal cells from C4T mice immediately after labeling and after one regression-regeneration cycle. In the distal region of the C4T mouse prostate, the percentage of Tacstd2-positive cells among tdTomato-positive cells was 98.2% two weeks after tamoxifen treatment (Fig. 3l); after one regression-regeneration cycle, this percentage decreased to 29.9% (Fig. 3l). In contrast, the percentage of tdTomato/Tacstd2 double-positive cells among distal prostate luminal epithelial cells was unchanged (Fig. 3m), indicating no significant loss or increase in Dist-Luminal-C cells over the tracing period for one regression-regeneration cycle. Strikingly, Tacstd2-positive Dist-Luminal-C cells generated Tacstd2-negative Luminal-A (Hoxb13high/tdTomato+) and Luminal-B (Nkx3.1high/tdTomato+) daughter cells (Fig. 3n). The persistence of Tacstd2/tdTomato double-positive Dist-Luminal-C cells is consistent with the maintenance of a constant prostate luminal progenitor cell population during regeneration (Fig. 3n). These results indicate that Tacstd2-positive Dist-Luminal-C cells both self-renew to maintain their population and differentiate into Tacstd2-negative daughter luminal cells.
To further characterize the localization and distribution pattern of Luminal-C cells in the prostate of castrated mice, we performed co-immunofluorescence for the three luminal cell clusters in the castrated C4T mouse prostate (Supplementary Fig. 11a). We found that the prostate invagination tips distinctly shrank after castration. Dist-Luminal-C cells (Ck4high/Ck8+/tdTomato+) remained located at residual prostate glandular invagination tips and separated from Hoxb13high Luminal-A cells and Nkx3.1-positive Luminal-B cells in the distal prostate of castrated C4T mice (Supplementary Fig. 11b,c). The Prox-Luminal-C cells were negative for Nkx3.1 and Hoxb13 and were located in the proximal region of the castrated C4T mouse prostate (Supplementary Fig. 11d,e).
In addition, all lineage-marked cells remained positive for the luminal marker Ck8, and strictly negative for the basal markers Trp63 and Ck5, demonstrating that these identified Luminal-C cells only generate luminal cells (Fig. 3c,d,f,h, and Extended Data Fig. 7c,d,f,g). These findings demonstrate that Dist-Luminal-C cells function as luminal progenitor cells in the distal region of the prostate.
Prox-Luminal-C cells only contribute to regeneration of the proximal prostate luminal lineage
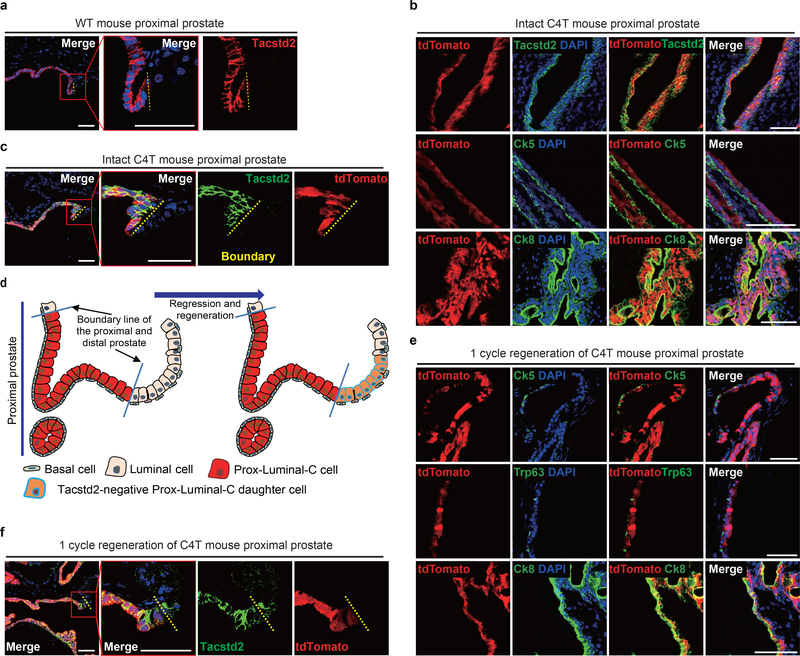
Tissue transplantation and organoid formation assays revealed that the proximal prostate regions is enriched in prostate stem cells4,17. Tacstd2-positive Prox-Luminal-C cells outlined a continuous luminal cell layer in the proximal region of the mouse prostate (Figs. 2b and 4a). We further confirmed that lineage-marked tdTomato-positive Prox-Luminal-C cells formed a continuous luminal cell layer in the proximal region of the tamoxifen-treated C4T mouse prostate (Fig. 4b,c). We hypothesized that the boundary of Tacstd2-positive and Tacstd2-negative luminal cells is the boundary between the proximal and distal regions of the prostate. We hypothesized that if tdTomato-positive luminal cells can cross the this boundary and generate Tacstd2-negative daughter cells in the C4T mouse prostate, Prox-Luminal-C cells would contribute to the regeneration of the distal prostate region (Fig. 4d). We found that Luminal-C lineage-marked tdTomato-positive Prox-Luminal-C cells resided in the prostate proximal regions and only generated Tacstd2-positive luminal cells in the proximal region of the prostate during regression-regeneration cycles in C4T mice (Fig. 4e,f). These results indicate that Prox-Luminal-C cells can regenerate the proximal prostate but do not contribute to distal prostate regeneration during prostate regression-regeneration cycles.
Figure 4 |. Lineage tracing of Ck4-expressing Prox-Luminal-C cells.
a, Immunofluorescence of Tacstd2 in the proximal region of the 10-week-old adult mouse prostate. b, Co-immunofluorescence of Ck5, Ck8 and Tacstd2 with endogenous tdTomato in the proximal region of the intact C4T mouse prostate 2 weeks after tamoxifen injection. c, Co-immunofluorescence of Tacstd2 with endogenous tdTomato in the proximal region of the intact C4T mouse prostate 2 weeks after tamoxifen injection. The yellow lines indicate the boundary of the proximal and distal regions. d, Prox-Luminal-C daughter cells will cross the boundary and generate Tacstd2-negative cells if they contribute to distal prostate regeneration. e, Immunostaining of Ck5, Ck8 and Trp63 with endogenous tdTomato in the regenerated prostate after one regression-regeneration cycle. f, Prox-Luminal-C cells did not cross the boundary and contribute to distal prostate regeneration. Immunostaining of Tacstd2 with endogenous tdTomato in the regenerated prostate after one regression-regeneration cycle. These experiments were performed three times with similar results (a-c,e,f). Scale bars, 50 μm (a-c,e,f).
Both Dist-Luminal-C and Prox-Luminal-C cells can be cellular origins of prostate cancer
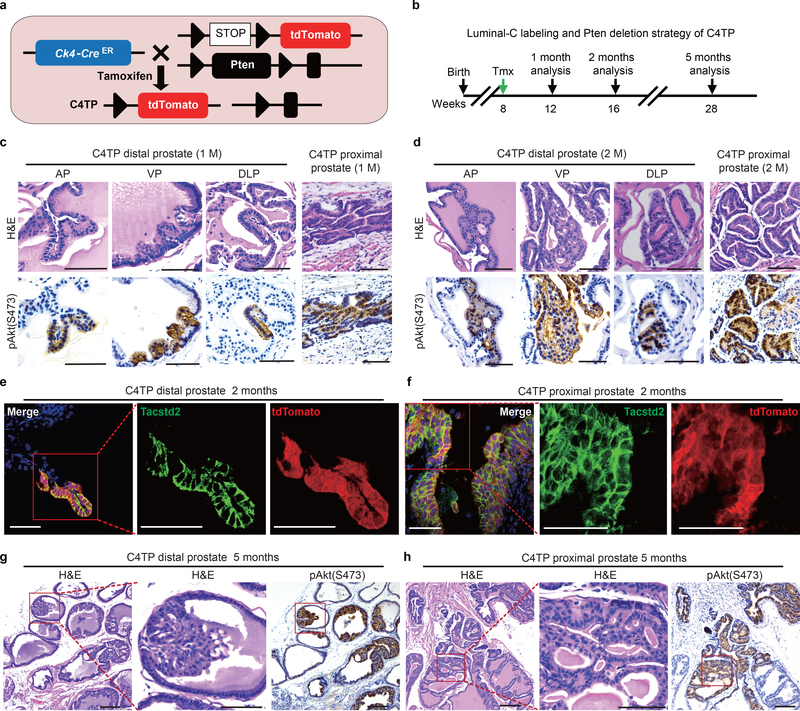
To test the tumor initiation capacity of Luminal-C cells, Ck4CreERT2/+; Rosa26tdTomato/+; Ptenflox/flox (C4TP) mice were generated to investigate whether prostate cancer is initiated by Luminal-C lineage-specific deletion of the tumor suppressor gene Pten (Fig. 5a,b). C4TP mice developed prostate hyperplasia in the distal prostate invagination tips and proximal prostate region one month post tamoxifen treatment (Fig. 5c). Prostate hyperplasia progressed to low-grade prostatic intraepithelial neoplasia (PIN) in the distal and proximal regions of the prostate at two months post tamoxifen treatment (Fig. 5d). These prostate hyperplasia and low-grade PIN lesions showed membrane localization of phosphorylated Akt (Fig. 5c,d). Strikingly, in the context of Pten deletion, most of the daughter cells of Ck4-positive Luminal-C cells maintained Tacstd2 expression, suggesting that Pten-mediated prostate tumorigenesis involves the gain of a stemness signature (Fig. 5e,f). Furthermore, we found that most Luminal-C cells generated high-grade PIN with phosphorylated Akt and nuclear pleomorphism in the distal region of the C4TP mouse prostate at 5 months post tamoxifen treatment (Fig. 5g). On the other hand, we only found high-grade PIN in the proximal prostate regions adjacent to intermediate regions (Fig. 5h). Collectively, these results imply that while both Dist-Luminal-C and Prox-Luminal-C cells can serve as cellular origins of prostate cancer, Dist-Luminal-C cells are more efficient than Prox-Luminal-C cells at initiating prostate cancer.
Figure 5 |. Prostate hyperplasia and PIN derived from the Luminal-C cell population.
a, Targeting strategy to generate the C4TP (PscaCreERT2/+;Rosa26EYFP/+;Ptenflox/flox) mouse, label Ck4-expressing cells with tdTomato and perform lineage-specific deletion of the tumor suppressor Pten. b, Schematic of the Luminal-C labeling and Pten deletion strategy in C4TP mice. c,d, Images of H&E staining and pAkt(S473) immunohistochemistry of the C4TP distal prostate at 1 month (c) or 2 months (d) after tamoxifen injection: anterior lobe (left panel), ventral lobe (middle panel), and dorsal-lateral lobe (right panel). e,f Immunofluorescence staining of Tacstd2 and endogenous tdTomato shows that all Luminal-C lineage-marked daughter cells are Tacstd2-positive with Pten deletion. C4TP prostate distal region (left panel) and proximal region (right panel). g,h Images of H&E staining and pAkt(S473) immunohistochemistry of the distal region (g) and proximal region (the square shows the PIN lesion adjacent to the intermediate region) (h) of the C4TP mouse prostate 5 months after tamoxifen injection. Five mice were analyzed for each experiment (c-h). Scale bars, 50 μm (c-h).
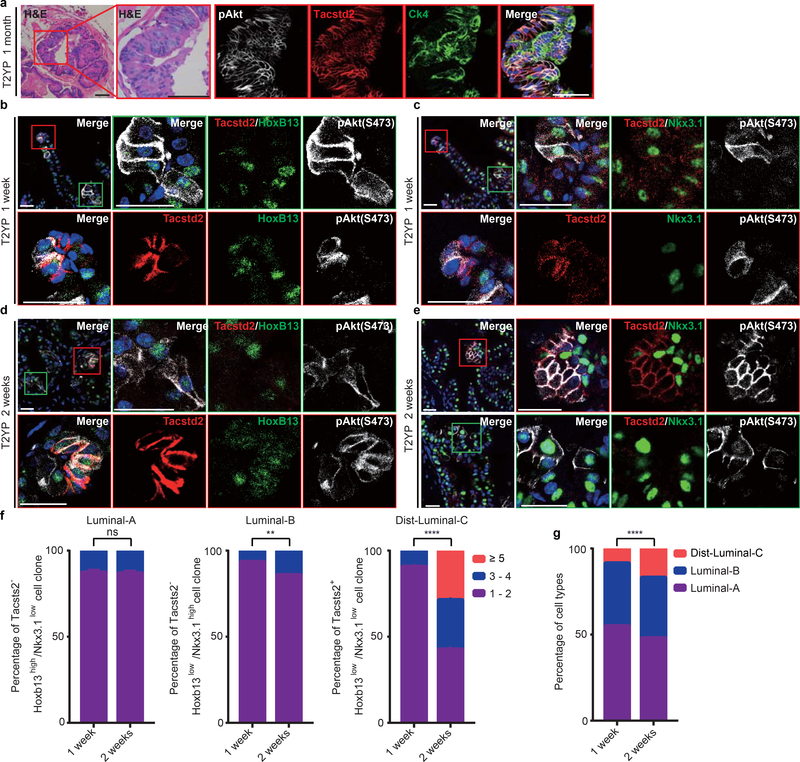
Next, we investigated whether Luminal-A/B/C cells have different abilities to generate prostate cancer using the Tmprss2-CreER;Ptenflox/flox (T2P) mouse model, in which Pten is stochastically deleted in all three prostate luminal cell types. At 28 days after tamoxifen injection, T2P mice had developed low-grade PIN lesions (Extended Data Fig. 8a). Notably, these PIN lesions were mostly comprised of Tacstd2-positive and Ck4-positive luminal cells (Extended Data Fig. 8a), indicating that the oncogenic transformation of Luminal-A and Luminal-B cells promotes the dedifferentiation of their progeny. The prostate from the T2P mouse at 7 days following tamoxifen induction contained small interspersed foci of luminal cells with membrane-localized phosphorylated Akt (Extended Data Fig. 8b,c). At this stage, we detected phosphorylated Akt in Luminal-A (Tacstd2−/Hoxb13high/pAkt+), Luminal-B (Tacstd2−/Nkx3.1high/pAkt+) and Luminal-C cells (Tacstd2+/Hoxb13low/Nkx3.1low/pAkt+), as expected, after the loss of Pten (Extended Data Fig. 8b,c). By 14 days after induction, we could still detect the three luminal cell types with Pten deletion (Extended Data Fig. 8d,e). Interestingly, the Tacstd2-positive progeny of Pten-deleted Luminal-C cells showed significantly increased and sustained Tacstd2 expression at 14 days after tamoxifen induction (Extended Data Fig. 8f,g). Overall, tumors generated by Luminal-A and Luminal-B cells were similar to those originating from Luminal-C cells but developed more slowly, perhaps due to an intrinsic delay in the dedifferentiation of Luminal-C cells from Luminal-A and Luminal-B cells.
Luminal-C cells in human prostate invagination tips
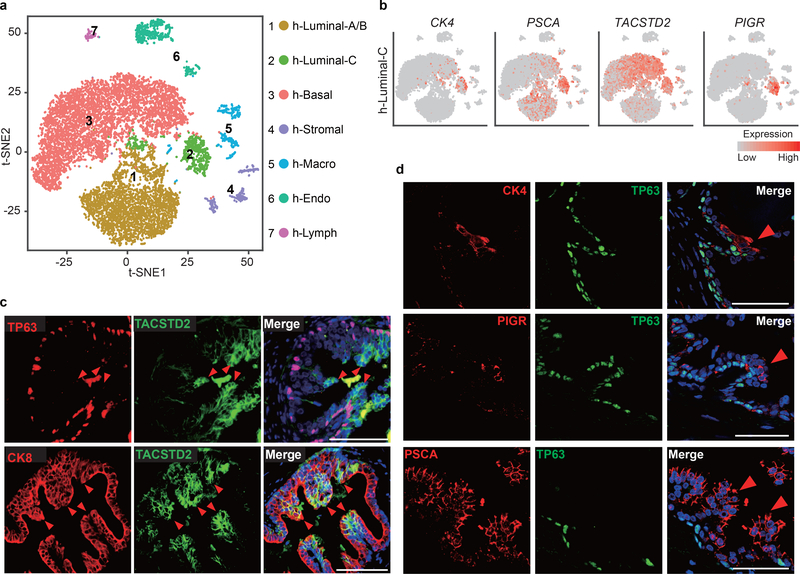
To investigate the potential presence of TACSTD2-expresssing Luminal-C cells in the human prostate, we surveyed freshly isolated individual human prostate cells from the central zone, peripheral zone and transition zone of one male organ donor. After aggregating data for each prostate zone, 11,374 human prostate cells were barcoded (Fig. 6a). Prostate cells from the central, peripheral and transition zones were distributed in all 7 clusters, and each cluster contained cells from all three prostate zones (Supplementary Fig. 12a,b).
Figure 6 |. Luminal-C cells in the normal human prostate.
a, Visualization of the clustering of 11,374 single human prostate cells based on the expression of known marker genes by t-SNE. h-Luminal-A/B, type A/B luminal cell; h-Luminal-C, type C luminal cell; h-Basal, basal cell; h-Stromal, stromal cell; h-Macro, macrophage; h-Endo, endothelial cell; h-Lymph, lymphocyte. b, T-SNE maps show the expression levels of h-Luminal-C marker genes (CK4, PSCA, TACSTD2 and PIGR) across 7 clusters (n = 11,374 cells). c, Immunofluorescence staining of TACSTD2, TP63 (upper panel) and CK8 (lower panel) showed that Luminal-C cells reside in normal human prostate invagination tips (red arrows). d, Immunofluorescence staining of CK4 (upper panel), PIGR (middle panel), PSCA (lower panel) and TP63 showed that Luminal-C cells reside in normal human prostate invagination tips (red arrows). These experiments were administered three times with similar results (c,d). Scale bars, 50 μm (c-d)
To define the cellular identity of each human prostate cell cluster, we identified cluster-specific marker genes (Extended Data Fig. 9a–h and Supplementary Fig. 13) (Supplementary Table 5). Notably, CK4, PSCA, TACSTD2 and PIGR specifically expressed in h-Luminal-C cells (Fig. 6b). Furthermore, we stained 11 normal human prostate samples for TACSTD2 (Luminal-C cell marker), P63 (basal cell marker) and CK8 (luminal cell marker). Remarkably, we found that h-Luminal-C cells were located at invagination tips in the normal human prostate (Fig. 6c,d). We further reviewed the human protein atlas data (https://www.proteinatlas.org/ENSG00000184292-TACSTD2/tissue/prostate#) and found that TACSTD2-positive luminal cells were prominently enriched at human prostate invagination tips (Supplementary Fig. 14). These results indicate the consistent location of the prostate Luminal-C cell population and confirm the existence of Luminal-C cells in the human prostate.
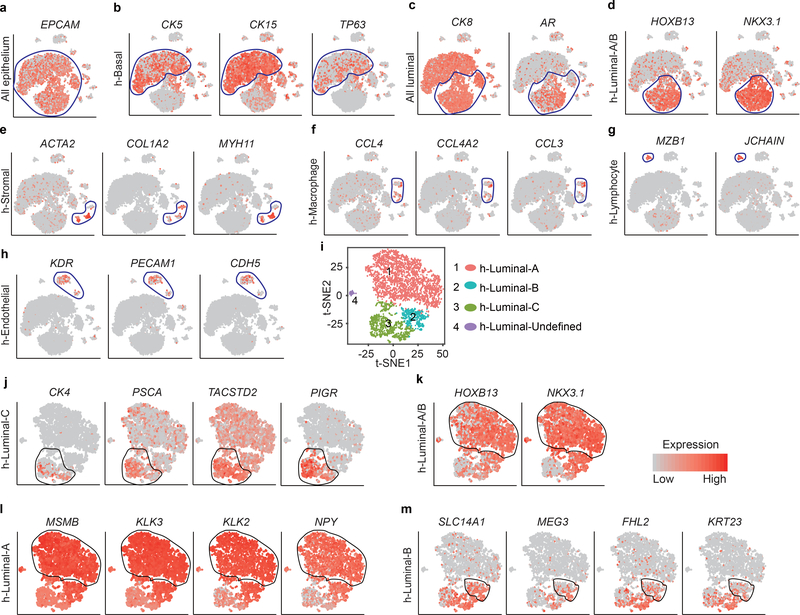
To characterize the human luminal cell clusters, we detected 4 subtypes of luminal cells (Extended Data Fig. 9i). Interestingly, although we identified some different marker genes of luminal cell clusters between human and mouse prostate samples (Supplementary Table 6), we found an h-Luminal-C cell cluster similar to the mouse Luminal-C cell cluster, with high PSCA, CK4, TACSTD2 and PIGR expression (Extended Data Fig. 9j). Furthermore, we identified h-Luminal-A (MSMBhigh;KLK3high;KLK2high;NPYhigh), h-Luminal-B (SLC14A1high;MEG3high;FHL2high;KRT23high) and h-Luminal-Undefined cell populations in the human prostate (Extended Data Fig. 9l,m). In contrast to those in the mouse prostate, h-Luminal-A cells in the human prostate highly expressed both HOXB13 and NKX3.1 (Extended Data Fig. 9k). Furthermore, we extracted luminal cells from the published human prostate atlas35; again, 4 subtypes of luminal cells were identified with SNN (Supplementary Fig. 15a). Similar cell clusters were observed in our data (Extended Data Fig. 9) and in the published human prostate cell atlas35 (Supplementary Fig. 15b–e). These results further confirmed the existence of the Luminal-C cell population in human prostate and highlighted the differences in the Luminal-A and Luminal-B populations between mice and humans.
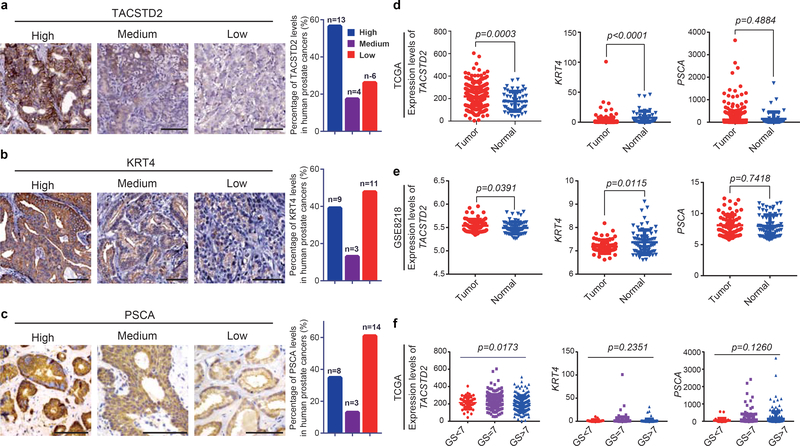
To validate TACSTD2, CK4, and PSCA expression levels in human prostate cancer, we performed immunohistochemistry on human prostate cancer biopsies and checked the human protein atlas (https://www.proteinatlas.org/). Notably, 13 of 23 human prostate cancer specimens highly expressed the Luminal-C cell marker TACSTD2, 9 of 23 highly expressed the Luminal-C cell marker CK4, and 8 of 23 highly expressed the Luminal-C cell marker PSCA (Extended Data Fig. 10a–c). Furthermore, we evaluated the expression levels of h-Luminal-C markers in the TCGA dataset (Firehose Legacy) and GSE8218 dataset36. Consistently, TACSTD2 expression was significantly higher in prostate cancer than in the normal prostate (Extended Data Fig. 10d,e). In addition, TACSTD2 expression levels were significantly higher in high-grade prostate tumors (Gleason score ≥ 7) than low-grade prostate tumors (Gleason score < 7) (P < 0.05) (Extended Data Fig. 10f). Interestingly, CK4 and PSCA expression levels did not obviously differ by tumor stage (Extended Data Fig. 10f).
Discussion
The annotation of prostate epithelial cells is based on a few defined markers and anatomical location. Here, we provide a molecular definition of cell types in the mouse prostate developed by scRNA-seq profiling of 35,017 cells and define a Dist-Luminal-C cell population; these unipotent luminal progenitor cells are important under physiological conditions and can serve as a cellular origin of prostate cancer. On the basis of our findings, we propose a model of prostatic tissue morphogenesis and tumorigenesis in which Dist-Luminal-C lineage-restricted cells remain at the invagination tips of the distal prostate duct (Fig. 7). Our study provides fundamental insights into prostate cell classification. Previously, heterogeneity in the mouse prostate luminal cell lineage was identified through a Fluidigm multiplex qPCR-based single-cell expression analysis of defined cell lineage markers37. Human prostate cell classification has been conducted by scRNA-seq analysis of FACS-sorted prostate cells, identifying two epithelial cell types enriched in the prostatic urethra and proximal regions35. Here, we identified two types of prostate luminal progenitor cells enriched in the proximal and distal regions of the prostate. Moreover, we confirmed the existence of human Luminal-C cells with scRNA-seq and immunofluorescence staining of the human prostate.
Figure 7 |. Schematic diagram of the self-renewal of Dist-Luminal-C cells and their role as prostate cancer-initiating cells.
Dist-Luminal-C cells are located in invagination tips of the mouse prostate. Luminal-C cells undergo self-renewal in prostate invagination tips during mouse prostate regression and regeneration. Dist-Luminal-C cells can serve as the cellular origin of prostate cancer.
The exact identity of prostate stem/progenitor cells and their relation to prostate cancer initiation remain to be completely elucidated. Previous studies have demonstrated the existence of basal stem cells and luminal stem cells using different strategies2,38. However, those findings are limited by the nature of bulk cell assays without defined stem/progenitor cell markers. Using cell sorting and transplantation strategies, previous studies reported the identification of basal stem cells4–7. A caveat for this method is that alterations in the normal microenvironment might drastically change the behavior of tested cells39. The majority of prostate luminal epithelial cells are sensitive to androgen deprivation, whereas a small proportion of mouse prostate luminal cells are castration-resistant40,41. LY6D was identified as a progenitor marker linked to castration-resistant luminal cells37. Using in vivo lineage tracing strategies, CARN11 and CARB luminal cell populations16 were defined as prostate stem cells that could generate all three prostate epithelial cell types11. However, we did not observe Ck5- or synaptophysin-positive cells among the descendants of Luminal-C lineage-marked cells in C4T and PaY mice. Since we only labeled Luminal-C cells under intact conditions, we cannot exclude the possibility that CARN or CARB cells were not labeled in our experiment. Using strict basal and luminal lineage tracing, basal and luminal cells were found to be self-sustaining and could be oncogenically transformed by lineage-specific Pten deletion in vivo12. Notably, Tacstd2-positive luminal cells have been identified in ridges protruding into the lumen of distal prostatic ducts42. These studies highlight the need to identify prostate stem/progenitor cells with defined markers and explore their behavior under physiological and tumorigenic conditions. In this study, it should be noted that both the Dist-Luminal-C and Prox-Luminal-C cell populations contain strictly luminal progenitor cells with defined cell markers and unique cell locations. Furthermore, although more detailed analyses are required, our study reinforces that cell location and environment are important for cellular function.
Finally, we generated a comprehensive mouse and human prostate cell atlas, identified unexpected luminal cell subpopulations, identified a unique luminal progenitor cell population with defined markers, directly designated the androgen-independent prostate luminal cell population, and provided evidence for the defined cell target of prostate oncogenic transformation. These findings will enhance our understanding of normal prostate development and prostate cancer.
Methods
Mice.
All mouse studies are approved by SIBCB Animal Care and Use Committee. Mice were bred and maintained according to Shanghai Laboratory Animal Center Institutional Animal Regulations. The Rosa26tdTomato/+ and Rosa26EYFP/+ mice were purchased from the Jackson Laboratory. The C57BL/6 and NOD/SCID mice were purchased from Charles River (Zhejiang, Pinghu). The Ck4-CreERT2 and Psca-CreERT2 mice were generated by Beijing Biocytogen and Shanghai Model Organisms Center, respectively. The Tmprss2CreERT2/+ mice were generated by the MSKCC Mouse Genetics Core Facility. The Ptenflox/flox mice43 were originally from Dr. Pier Paolo Pandolfi’s laboratory. Mice were genotyped by PCR using the genomic DNA of mouse tail. The sequences of the genotyping primers specific for Tmprss2CreERT2/+, Ck4CreERT2/+, PscaCreERT2/+, Rosa26tdTomato/+, Rosa26EYFP/+ and Ptenflox/flox, and the expected band sizes for PCR are listed in Supplementary Table 7.
Mouse procedures.
The Tmprss2CreERT2/+; Rosa26EYFP/+ (T2Y), Ck4CreERT2/+; Rosa26tdTomato/+ (C4T), PscaCreERT2/+; Rosa26EYFP/+ (PaY), Tmprss2CreERT2/+; Rosa26EYFP/+ and Ck4CreERT2/+; Rosa26tdTomato/+; Ptenflox/flox (C4TP) mice were injected with Tamoxifen (Sigma, cat. no. T6648–5G) at the age of 8 weeks.
Castration and androgen-mediated prostate regeneration.
Experimental mice were castrated at the age of 10 weeks using standard techniques. Testosterone pellet (12.5 mg per pellet, 90-d release, Innovative Research of America) were placed subcutaneously after two weeks of castration to restore the serum testosterone level and stimulate prostate regeneration. Two weeks after regeneration, testosterone pellets were removed to re-induce the prostate regression for two weeks and were re-administered subcutaneously to re-induce prostate regeneration for another two weeks.
Prostate cell dissociation and fluorescence-activated cell sorting (FACS).
Mouse prostate tissue was dissected and minced by a razor blade under the microscope. The minced prostate tissue was dissociated with 0.75 ml dissociation medium (1× Collagenase/Hyaluronidase, stem cell, #07912), and incubated at 37 °C for 30 minutes. The dissociated tissue chunks were spun down at 300 g for 2 minutes, and then the supernatant was removed. The dissociated tissue chunks were further dissociated by TrypLE (Gibco, #12605–028) with 10 μM Y27632 for 10 minutes. The dissociated cell suspension was filtered with mesh filter. The dissociated prostate cells were stained for 15 min on ice with following antibodies (Supplementary Table 8). Cell sorting was performed on a FACS Aria II (BD).
Mouse prostate single-cell RNA sequencing.
Here, four T2Y mouse prostates were dissected and minced by a razor blade under the microscope respectively. The minced prostate tissue was dissociated with 0.75 ml dissociation medium (1× Collagenase/Hyaluronidase, Stem Cell, #07912; Advanced DMEM/F12, Invitrogen, #12634–034; 100× HEPES, Invitrogen, #15630–056; 100× GlutaMax-I, Invitrogen, #35050–079; 10 μM Y27632, Sigma, #Y0503) and incubated at 37 °C for 15 min with continuously gentle shaking, pipette up and down every 5 minutes. The dissociated prostate tissue chunks were spun down at 300 g for 2 minutes, and then the supernatant was removed. The dissociated tissue chunks were further dissociated by 1 ml TrypLE (Gibco, #12605–028) with 10 μM Y27632 for 10 minutes. The dissociated cell suspension was filtered with a 70-μm mesh filter. The dissociated prostate cells were spun down at 500 g for 5 min at 4 °C, and then the supernatant was removed. The pellet was resuspended in FACS buffer with Y27632. The dissociated prostate cells were stained with DAPI (1 ng/μl, Sigma, #D8417) for 5 min on ice and filtered with a 40-μm mesh filter. Cell sorting was performed on a FACS Aria II (BD). For single-cell RNA sequencing, the live prostate cells (DAPI-negative) percentage were 94.6–96.8% in total prostate cells, the cell viability were 81–91% in total prostate cells before cell loading in the Single-Cell-A-Chip (10X Genomics). Sorted live cell suspensions from 4 T2Y mouse prostates were loaded in 4 wells of the Single-Cell-A-Chip. Single-Cell-A-Chip with sorted prostate cells was loaded on 10X Chromium single-cell instrument (10X Genomics). Barcoding, cDNA synthesis and library construction were administered using the manufacturer’s instructions. The four mouse prostate samples with different barcodes were run together on NovaSeq6000 (Illumina).
Human prostate specimen collection and prostate cell dissociation.
Normal human prostate sample obtained from patients treated by radical cystectomy at Fudan University Shanghai Cancer Center. Patients provided informed consent and normal prostate sample was procured and the study was conducted under Shanghai Institute of Biochemistry and Cell Biology Institutional Review Board approval (Approval number: 2019–015). In addition to approval by the local IRB,this study has been reviewed by and is compliant with the Chinese Ministry of Science and Technology (MOST) for the Review and Approval of Human Genetic Resources (approval no. 2020BAT0258).Human prostate central zone, peripheral zone and transition zone were dissected and minced by a razor blade under the microscope respectively. The minced prostate tissue was dissociated with 5 ml human prostate dissociation medium (5 mg/ml Collagenase Type II, Gibco, #17101–015; Advanced DMEM/F12, Invitrogen, #12634–034; 100× HEPES, Invitrogen, #15630–056; 100× GlutaMax-I, Invitrogen, #35050–079; 10 μM Y27632, Sigma, #Y0503) and incubated at 37 °C for 45 minutes with continuously gentle shaking, pipette up and down every 10 minutes. The dissociated prostate tissue chunks were spun down at 500 g for 5 min, and then the supernatant was removed. The dissociated tissue chunks were further dissociated by 5 ml TrypLE (Gibco, #12605–028) with 10 μM Y27632 for 20 minutes. The dissociated cell suspension was filtered with a 40-μm mesh filter. The dissociated prostate cells were spun down at 500 g for 5 min at 4 °C, and then the supernatant was removed. The pellet was resuspended in 10 ml red blood cell lysis buffer (eBioscience, #00–4333-57) for 10 minutes. The cell suspension was spun down at 500 g for 5 min at 4 °C, and then the supernatant was removed. The dissociated prostate cells were filtered with a 40-μm mesh filter. For single-cell RNA sequencing, the live prostate cells (Typan blue negative) percentage were over 80% in total prostate cells before cell loading in the Single-Cell-A-Chip (10X Genomics). Total prostate cell suspensions from prostate central zone, peripheral zone and transition zone were loaded in 3 wells of the Single-Cell-A-Chip. Single-Cell-A-Chip with human prostate cells was loaded on 10X Chromium single-cell instrument (10X Genomics). Barcoding, cDNA synthesis and library construction were administered using the manufacturer’s instructions. The four mouse prostate samples with different barcodes were run together on NovaSeq6000 (Illumina).
Bulk cell RNA sequencing.
For bulk RNA sequencing, RNA of sorted cells was isolated by RNeasy Mini Kit (QIAGEN, #74106) and library construction was performed using mRNA-seq V3 Library Prep Kit (Vazyme, #NR611).
Organoid formation assay.
The prostate organoids forming assay was performed as previously reported44. Briefly, the sorted mouse prostate cells were suspended using organoid medium, and mixed with Matrigel (1:1). The cell suspension was seeded into a 24-well culture plate with the cell number of 500 or 1,000 cells in 50 μl per well. The cell culture plates were incubated in cell incubator (5% CO2, 37 °C) for 30 minutes. Mouse prostate organoid medium was added on top of the Matrigel. The culture medium was changed every 4 days and the microscope images was acquired using Operetta (Perkin Eimer) after one-week culture.
Transplantation assay.
The transplantation assay was performed as previous reports3,45. Briefly, urogenital sinus mesenchyme (UGSM) cells were dissociated from urogenital sinus of embryonic day 18 rat embryos. Dissociated prostate cell suspension from T2Y mouse prostate tissue was diluted into 50, 200, 1,000 and 10,000 cells by limiting dilution assay46. UGSM cells (50,000) was mixed with the diluted prostate cells for a renal graft drop. The urogenital sinus was dissected and dissociated in 1% Trypsin at 4 °C for 20 min and washed twice with DMEM. The tissue chunks were incubated with 0.1% collagenase B and 1% DNase in DMEM medium at 37°C for 15 minutes. The dissociated cell suspension was filtered with a mesh filter. The UGSM cells were mixed with type I collagen and setting solution to form the cell pellets. The cell pellets were incubated in cell incubator (5% CO2, 37 °C) for 30 minutes. Mouse prostate organoid medium was add on top of the cell pellets. The cell pellets were transplanted under renal capsule of SCID mice at the age of 7 weeks. The grafts were analyzed 2–3 months after transplantation.
Quantification of lineage-specific cells and the size of clones.
A minimum of three different mice were analyzed per condition. Dissociated single prostate cells were FACS analyzed for the Tacstd2+ and YFP+ cells proportion in luminal compartments. A minimum of 3 mice were analyzed by FACS analysis and a minimum of 20 sections were analyzed by immunofluorescence of Ck5, Ck8, Trp63 and tdTomato or YFP to discern the basal and luminal composition of Luminal-C marked cells. Representative clones were documented by confocal imaging. For clonal analysis, a minimum of 100 clones were analyzed per time point. The clones were grouped in four classes: one-cell, two-cells, three to ten-cells and more than ten cells.
Histology and immunostaining assay.
Tissue paraffin embedding was performed using a standard protocol. Prostate tissues and organoids paraffin embedding were conducted by using a previously described method8. Paraffin-embedded tissues or organoids were cut into 5-μm sections and stored at room temperature. Frozen tissues or organoids were cut into 10-μm sections and stored at a −30°C freezer before staining. Paraffin-embedded samples were deparaffinized and underwent antigen retrieval in sodium citrate buffer (pH 6.0) in a steamer for 15 min. Sections were blocked and permeabilized in 1× PBS with 5% goat serum and 0.1% Triton X-100. Sections were then incubated with primary antibodies in 2% BSA at 4°C overnight. For immunofluorescence, sections were incubated with appropriate secondary antibodies for 1 hour at room temperature in the dark. Nuclei were stained with DAPI (Sigma). For immunohistochemistry, samples were incubated with appropriate secondary antibody (Zsbio, China) and performed following manufacturer’s instructions. The primary antibodies used in this study are listed in Supplementary Table 8.
Pre-processing of droplet-based scRNA-seq data.
Mice.
Cell Ranger toolkit (version 2.1.1) provided by 10X Genomics was used to perform de-multiplexing and alignment to the mm10 transcriptome. (1) For T2Y mouse prostate profile, once gene-barcode matrix was obtained, genes expressed in less than 8 cells were excluded and cells with more than 200 expressed genes were used for further analysis, which resulted in 16,401 genes across 8,545 cells. Then we used Seurat47 to log transformed the data with the scale factor for cell-level normalization setting 100,000. (2) For wild type (WT) mouse prostate profile, 4,100 individual cells were obtained after filtering the low-quality genes and cells. Cells were discarded with less than 200 genes or more than 5,000 genes expressed (potentially cell doublets) and genes which expressed in less than 3 cells were deleted. Cells with mitochondrial gene percentages less than 15% were used to further analysis. Genes were excluded if genes which expressed in less than 3 cells. Then we log-transformed the data (the scale factor was setting as 10,000). (3) For three lobes prostate profiles, 13,968 individual cells were profiled from freshly dissociated AP, VP and DLP of 1 WT mouse at age of 10 weeks. Cells were discarded with less than 200 genes or more than 6,000 genes expressed (potentially cell doublets) and genes which expressed in less than 10 cells were deleted. 13,744 cells with mitochondrial gene percentages less than 20% were used to further analysis. Then the data were log-transformed by Seurat (the scale factor was setting as 10,000). (4) We profiled scRNA-seq profiles of the T2Y mouse prostates after 7 days and 28 days of castration. There are 5,734 cells and 3,006 cells in the two castrated mouse prostate profiles. Cells with mitochondrial gene percentages less than 10% were used to further analysis.
Human.
Cell Ranger toolkit (version 2.1.1) provided by 10X Genomics was used to perform de-multiplexing and alignment to the GRCh38 transcriptome. 11,413 cells were obtained. Cells were discarded with less than 500 genes or more than 8,000 genes expressed (potentially cell doublets) and we filtered the gene which expressed in less than 10 cells. 11,409 cells with mitochondrial gene percentages less than 20% were used to further analysis. Then we log-transformed the data (the scale factor was setting as 100,000).
Pre-processing of bulk RNA sequence data.
Paired-end reads were mapped to the GRCm38 mouse transcriptome using hisat2 (version 2.1.0)48 with a more than 90% average overall alignment rate. Read counts and gene length were calculated by feature Counts (1.6.0)49. We used a function fpkm from an R package Deseq250 to get FPKM data matrix.
The estimation of the doublets percentage in mouse prostate scRNA-seq dataset.
To estimate the percentage of doublets in our dataset, DoubletFinder51 was performed to identify the doublets. A fully-processed Seurat object (NormalizeData, FindVariableGenes, ScaleData, RunPCA, and RunTSNE) of the scRNA-seq data have been performed before identifying the cell doublets. In DoubletFinder, we first identified the parameters, the variable numbers of artificial doublets (pN) and the variable PC space neighborhood sizes (pK). The pK was set as 0.1 according to the BCmvn and the pN was set as 0.25. Then, the percentage of expected real doublets was set as from 5% - 15% (5%, 7.5%, 10%, 12.5%, 15%) to detect the distribution of doublets in all cell types. The predicted doublets among our scRNA-seq data in different expected doublets percentage can be obtained using DoubletFinder.
Dimensionality reduction using PCA and t-SNE of scRNA-seq datasets.
Seurat, an R package (Version 3.1.1) was applied to dimensionality reduction analysis and clustering analysis.
Mouse.
(1) In T2Y mouse prostate profile, 3,011 highly variable genes across cells were identified by controlling average expression (0.0125 low cut-off and 5 high cut-off) and dispersion (0.5 low cut-off and 8 high-off). The principal component analysis (PCA)52 was performed using these highly variable genes. Jackstraw function was used to determine significant PCs. And the first 10 significant PCs were used to perform t-Distributed Stochastic Neighbor Embedding (t-SNE)53. Clustering was then run to group cells together that had similar expression profiles, based on the first 10 significant PCs. We obtained clusters by performing the FindClusters function (resolution = 0.2). And NE cells were identified based on known NE cell markers (Chga and Syp). Finally, we defined 11 clusters, according to the t-SNE maps and expression of marker genes. In order to identify specific genes for each cluster, we ran the differential expression tests between each pair of clusters using an R package edgeR54. Sets of differentially expressed genes (DEGs) were obtained by comparing cells in a specific cluster with cells in every other cluster (Cut-off: log (fold change) ≥ 0.5, FDR ≤ 0.05). For a given cluster, we used the minimum log2 (fold change) and the maximum FDR to filter signature genes. Cluster signature genes were obtained by a maximum FDR of 0.05 and a minimum log2 (fold change) of 0.5. And signature genes were ordered by the maximum FDR. (2) For wild type (WT) mouse prostate profile, 3,500 highly variable genes which were identified by the “mean.var.plot were used to perform PCA. Top 15 PCs were used to perform t-SNE and clusters (resolution = 0.08). 5 clusters were identified. (3) For three lobes prostate profiles, we used 5,000 highly variable genes which were identified by the “mean.var.plot” selection method to perform PCA. And the first 11 PCs were used to t-SNE dimensional reduction and clustering (resolution = 0.05) by the FindClusters function. Seven clusters were identified in scRNA-seq profile.
Human.
In human prostate cell atlas, Seurat 3.1.1 was performed in following analysis. Three thousand highly variable genes were identified by the “mean.var.plot” selection method. And these highly variable genes were used to perform the principal component analysis. The first 15 significant PCs were applied to perform t-Distributed Stochastic Neighbor Embedding (t-SNE). Clustering was then run to group cells together based on the first 13 significant PCs. We obtained clusters by performing the FindClusters function (resolution = 0.1, algorithm = 3) and seven clusters were finally identified. The specific genes for each cluster were identified by edgeR54. DEGs were obtained by comparing cells in a specific cluster with cells in every other cluster (Cut-off: log (fold change) ≥ 0.5, FDR ≤ 0.05). And cluster signature genes were obtained by a maximum FDR of 0.05 and a minimum log2 (fold change) of 0.5. Signature genes were ordered by the maximum FDR. And we re-clustered these luminal cells (h-Luminal-A/B and h-Luminal-C). 4 clusters were identified (resolution = 0.15) of these luminal cells by the Seurat package. Cluster-specific signatures were identified by the R function FindAllMarkers (Cut-off: log (fold change) ≥ 0.5, min.pct = 0.25).
Integration analysis of scRNA-seq datasets
We collected scRNA-seq profiles of the T2Y mouse prostates after 7 days and 28 days of castration, and successfully integrated with the T2Y mouse prostates scRNA-seq profiles. We integrated T2Y mouse prostates scRNA-seq profiles with scRNA-seq profiles of the T2Y mouse prostates after 7 days and 28 days of castration by Seurat v3.1.1. Two thousand highly variable genes were selected for each dataset using the feature selection method ‘vst’. Then, we identified anchors using the FindIntegrationAnchors function and the integrated expression matrix was obtained by the function IntegrateData. The integrated matrix was applied to downstream analysis and visualization. The scaled integrated data was used to run PCA, cluster (resolution = 0.05) and visualize the results with t-SNE. Eight clusters were identified.
Markov-chain entropy analysis for bulk profiles of luminal cells.
Markov-chain entropy (MCE)55 values were computed to estimate the differentiation potency or potential of Tacstd2− luminal cells, Dist-Luminal-C cells and Prox-Luminal-C cells. The construction of MCE required two inputs, i.e. normalized data and protein-protein interaction network. For normalized data, we firstly chose stemness genes in mouse32. Then, we obtained the human homologs using g: Profiler56, and mapped to human Entrez gene IDs. Next, we normalized the fpkm data by log-scale transformation. To enforce that the minimum normalized value was not zero, we added an offset value of 0.1 before log-scale transformation (). For the interaction network, we constructed the network based on PPI (protein-protein interaction) network from the database57. Then, the MCE values of three Tacstd2− luminal cell samples, three Dist-Luminal-C cell samples and three Prox-Luminal-C cell samples were obtained. Hypothesis test was carried out using the t test implemented using the R function t.test. The MCE values of Dist-Luminal-C cells had no significant difference with the MCE values of Prox-Luminal-C cells (P value = 0.9912, t test). And the result showed that the MCE values of Dist-Luminal-C cells and Prox-Luminal-C cells were significantly (P value = 0.0002664, t test) greater than Tacstd2− luminal cells, which implies significantly higher potency (or potential) of Luminal-C cells (both Dist-Luminal-C cells and Prox-Luminal-C cells) than other luminal cells.
The analysis of published human prostate cell atlas.
35,865 cells were barcoded with an average of 1,356 genes detected per cell. The Seurat package was applied to cluster the single-cell transcriptomes. Gene expressed in less than 3 cells were excluded and single cells with more than 200 expressed genes were used for further analysis. And cells were also discarded if their mitochondrial gene percentages were over 10%, which resulted in 23,250 genes across 33,034 cells. Then we performed dimension reduction and clustering analysis. First, we identified three hundred and ninety nine high variable genes by controlling the average expression (0.2 low cut-off and 5 high cut-off) and dispersion (1 low cut-off). The principal component analysis was performed using variable genes. And the first 10 significant PCs were used to perform t-Distributed Stochastic Neighbor Embedding (t-SNE). Single cells were visualized in a two-dimensional space. Clustering was then run to group cells together that had similar expression profiles, based on the first 10 significant PCs. We obtained clusters by performing the FindClusters function (resolution = 0.3). Some known epithelial cell markers such as Epcam were used to identify the epithelial, and the cluster 4, 5 were identified as luminal cells. We re-clustered these luminal cells. We identified 4 clusters (resolution = 0.1) of these luminal cells by the Seurat package. And cluster-specific signatures were identified by the R function FindAllMarkers (Cut-off: log (fold change) ≥ 0.5, min.pct = 0.25).
Signatures of Dist-Luminal-C cells, Prox-Luminal-C cells, luminal cells and basal cells based on bulk profiles.
We then defined expression signatures for Dist-Luminal-C cells, Prox-Luminal-C cells, Tacstd2− luminal cells and basal cells based on bulk profiles. Genes were selected if their mean expression values were ≥ 1. The signatures of Dist-Luminal-C cells and Prox-Luminal-C cells were identified by making pairwise comparisons with all other cell types. The signatures of Luminal-C cells were obtained by making pairwise comparisons (Dist-Luminal-C cells and Prox-Luminal-C cells vs. Tactd2− luminal cells, Dist-Luminal-C cells and Prox-Luminal-C cells vs. basal cells). For the signatures of Dist-Luminal-C cells, Prox-Luminal-C cells and Tacstd2-negative luminal cells, we used the minimum log2 (fold change) and the maximum P value to filter signature genes. The signature genes were obtained by a maximum P value of 0.005 and a minimum log2 (fold change) of 0.5 using the edgeR. The signatures of basal cells and Tacstd2-negative luminal cells were obtained by making comparisons of basal cells and Tacstd2-negative luminal cells (P value ≤ 0.005 and log2 (fold change) ≥ 0.5, edgeR). Signature genes were ordered by the log2 (fold change) of genes.
Gene ontology and gene set enrichment analyses.
Gene Ontology functional analysis was performed using Metascape58. The target genes that were signatures of clusters were collected for subsequent enrichment analyses of functions and pathways by annotating Gene Ontology (GO) biological processes.
Quantification and statistics.
Significance was evaluated by an unpaired Student’s t test. For organoid formation assay, the data were obtained from at least three independent experiments. For mouse regression-regeneration assay and renal capsule grafts, the experiments were administered using at least three animals.
Data availability
All requests for raw and analyzed data and materials should be directed to the corresponding authors. Data and materials that can be shared will be released via a material transfer agreement. All raw sequencing data created in this study have been uploaded to the National Omics Data Encyclopedia (NODE; https://www.biosino.org/node/index) with the accession number OEP000825. Source data related to Figs. 1, 2 and 6 and Extended Data Figs. 1, 2, 4, 6, 9 and 10 and Supplementary Figs. 1–5, 12 and 13 are available with the paper.
Code availability
The custom code used is available at GitHub (https://github.com/LinLi-0909/Single-cell-analysis).
Extended Data
Extended Data Fig. 1 |. Decoding of the identity of cell types within the main clusters.
(n = 8,545 cells). a, T-SNE maps show the expression levels of epithelial cell marker Epcam and known luminal cell marker genes (Ck8, Ck18, Ar, EYFP) across 11 clusters. Red circles indicate all the luminal cell clusters. b-k, T-SNE maps show the expression levels of marker genes across 11 clusters. Red circles indicate the Luminal-A cluster (n = 2,773 cells) (b), Luminal-B cluster (n = 2,233 cells) (c), Luminal-C cluster (n = 232 cells) (d), Neuroendocrine cell cluster (n = 4 cells) (e), Basal cluster (n = 747 cells) (f), Seminal Vesicle cluster ( n = 406 cells) (g), Stromal cluster (n = 1,208 cells) (h), Macrophage cluster (n = 660 cells) (i), Lymphocyte cluster (n = 114 cells) (j), Endothelial cluster (n = 168 cells) (k). t-SNE map shows cells that are colored by the log-scale normalized read count of marker genes.
Extended Data Fig. 2 |. Lobe specific distribution of luminal clusters.
a, Visualization of clustering of 13,632 single cells from freshly dissociated AP, VP and DLP of WT mice at age of 10 weeks, based on the expression of known marker genes by t-SNE. b, Visualization the lobe distribution patterns of different cell clusters (n = 13,632 cells). c, Bar graph shows the percentage of the three luminal cell lineages in AP, VP and DLP. d-i, T-SNE maps show the expression levels of marker genes across 7 clusters. Black circle indicate the Luminal clusters (n = 9,295 cells) (d), Luminal-A cluster (n = 4,874 cells) (e), Luminal-B cluster (n = 4,059 cells) (f), Luminal-C cluster (n = 362 cells) (g), Basal cluster (n = 836 cells) (h), Stromal cluster (n = 2,864 cells) (i). T-SNE map shows cells that are colored by the log-scale normalized read count of marker genes.
Extended Data Fig. 3 |. Location of Luminal-A, Luminal-B and Luminal-C cells in different prostate lobes.
a,b, Immunofluorescence of Hoxb13 (a) and Nkx3.1 (b) in WT mouse anterior prostate (AP) (red circles), dorsal-lateral prostate (DLP) (green circle), ventral prostate (VP) (purple circle), proximal prostate (yellow circle), and urethra (light blue circle). c, immunofluorescence of Tacstd2 in the whole prostate of T2Y mouse. White circles indicate all the proximal prostate; green circle indicate the urethra. d,e,f,g Co-immunofluorescence of Hoxb13, Nkx3.1 and Tacstd2 in AP (d), DLP (e), VP (f) and proximal prostate (g) of WT prostate. 3 independent mice were used for each experiment. Scale bars, 50 μm(d-g).
Extended Data Fig. 4 |. Transcriptomic analysis of Dist-Luminal-C cells, Dist-Luminal-C cells, Tacstd2-negative luminal cells and basal cells.
a,b, FACS plots, gating strategy of the prostate basal cells (a), distal (b, upper panel) and proximal (b, lower panel) prostate epithelial cells. c, Heatmap for analyzing the gene signatures of Dist-Luminal-C cells, Dist-Luminal-C cells, Tacstd-negative luminal cells and basal cells (log2(fold change) >=log2(1.5), p-value <=0.01,edgeR). Each row represents one gene, while each column represents one sample. (The expression values of the gene are row z-score log (FPKM+1)). d, Heatmap shows the gene signatures of Dist-Luminal-C cells, Dist-Luminal-C cells, Tacstd-negative luminal cells. 6 independent mice were used for bulk RNA-seq assay.
Extended Data Fig. 5 |. Functional characterization of Luminal-C cells.
a, Co-immunofluorescence of Tacstd2 with Ki67 in proximal prostate and distal prostate of T2Y mouse. b, Percentage of Ki67+ cells in Tacstd2-negative luminal cells, Proximal-Luminal-C cells and Distal-Luminal-C cells. c,d, Co-immunofluorescence of Ck8, Trp63 and endogenous YFP in organoids which derived from Dist-Luminal-C (c) and Prox-Luminal-C cells (d) of T2Y mouse prostates. e, H&E and immunohistochemical staining of prostate duct from renal grafts of total Luminal-C cells express YFP, Trp63 and Ck8. f, Co-immunofluorescence of Tacstd2 and endogenous YFP in renal grafts which derived from total Luminal-C cells. g,h, Co-immunofluorescence of Hoxb13 (g), Nkx3.1 (h) and endogenous YFP in renal grafts which derived from total Luminal-C cells. 4 independent mice were used in proliferation assay (a,b). These experiments were administered three (e-h) and five (c, d) times with similar results. Scale bars, 50μm (a,c-h).
Extended Data Fig. 6 |. Single-cell transcriptomic survey for prostate cells of intact and regressed mice (castrated for 7 days and castrated for 28 days).
a, Visualization of clustering of 17,305 single cells (points; n = 6 mice), based on the expression of known marker genes by t-SNE (left panel). Cell numbers and percentages of assigned cell types are summarized in the right panel. Luminal-A, type A luminal cell; Luminal-B, type B luminal cell; Luminal-C, type C luminal cell; Basal, basal cell; Stromal, stromal cell; Macro, macrophage; SV, seminal vesicle epithelial cell. b, T-SNE map shows the cell distribution from intact mice (day 0; n = 8,545 cells), regressed mouse (day 7; n = 5,734 cells) and (day 28; n = 3,006 cells). c, Bar graph shows the percentage of Luminal-A, Luminal-B and Luminal-C cells in total cells of intact mice (day 0), regressed mouse (day 7) and (day 28). d-j, T-SNE maps show the expression levels of marker genes across 8 clusters. Black circles indicate all luminal cluster (n = 13,136 cells) (d), basal cluster (n = 1,090 cells) (e), the Luminal-A cluster (n = 7,532 cells) (f), Luminal-B cluster (n = 4,903 cells) (g), Luminal-C cluster (n = 701 cells) (h), stromal cluster (n = 1,415 cells) (i), macrophage cluster (n = 727 cells) (j). t-SNE map shows cells that are colored by the log-scale normalized read count of marker genes. k, Mean Expression in target cells (log2[TP10K], color) and fraction of expressing cells (dot size) of key luminal markers of Luminal-A, Luminal-B and Luminal-C (rows) in cells from each luminal sub-clusters of intact mice (day 0), regressed mouse (day 7) and (day 28) (columns).
Extended Data Fig. 7 |. Lineage tracing of Psca-expressing Dist-Luminal-C cells.
a, Schematic of targeting strategy to generate the PaY (PscaCreERT2/+; Rosa26EYFP/+) mouse is used to label Psca-expression cells by EYFP expression at 8-week male mice. b, Timeline for Luminal-C cell labeling and prostate regression-regeneration in PaY mouse prostate. c, Co-immunofluorescence of Ck5, Ck8 and Trp63 with endogenous YFP in intact PaY mouse prostates 2-weeks after tamoxifen injection. d, Percentage of YFP+ cell in Ck5− cells, Ck5+ cells, Trp63− cells, Trp63+ cells, Ck8− cells and Ck8+ cells of 10-week PaY mouse prostate. e, Co-immunofluorescence of Tacstd2 with endogenous YFP in intact PaY mouse prostate distal regions 2-weeks after tamoxifen injection. f, Co-immunofluorescence of Ck5, Ck8 and Trp63 with endogenous YFP in regenerated prostate after one cycle of regression-regeneration. g, Co-immunofluorescence of Ck5, Ck8 and Trp63 with endogenous YFP in regenerated prostate after three cycles of regression-regeneration. h, Percentage of YFP-positive cell clone in intact regenerated prostate and regenerated prostate after one or three cycles of regression-regeneration. 8 independent mice were used for each experiment. Scale bars, 50 μm (c, e, f, g). Data show mean ± standard deviation and two-way ANOVA (h). ****P<0.0001 (h)
Extended Data Fig. 8 |. Dist-Luminal-C cells are favored to generate prostate cancer.
a, H&E and Co-immunofluorescence of pAkt, Tacstd2 and Ck4 in T2P mouse prostate one month after tamoxifen treatment. Most of Pten-loss luminal cells gained the Luminal-C marker Tacstd2 and Ck4 expression. b, Co-immunofluorescence of Luminal-A (Hoxb13high; Tacstd2−; pAkt+) and Dist-Luminal-C (Tacstd2+; Hoxb13low; pAkt+) cells with Pten deletion in T2P mouse prostate 7 days after tamoxifen treatment. c, Co-immunofluorescence of Luminal-B (Nkx3.1high; Tacstd2−; pAkt+) and Dist-Luminal-C (Tacstd2+; Nkx3.1low; pAkt+) cells with Pten deletion in T2P mouse prostate 7 days after tamoxifen treatment. d, Co-immunofluorescence of Luminal-A (Hoxb13high; Tacstd2−; pAkt+) and Dist-Luminal-C (Tacstd2+; Hoxb13low; pAkt+) cells with Pten deletion in T2P mouse prostate 14 days after tamoxifen treatment. e, Co-immunofluorescence of Luminal-B (Nkx3.1high; Tacstd2−; pAkt+) and Dist-Luminal-C (Tacstd2+; Nkx3.1low; pAkt+) cells with Pten deletion in T2P mouse prostate 14 days after tamoxifen treatment. f, Percentage of Luminal-A (Hoxb13high; Tacstd2−; pAkt+), Luminal-B (Nkx3.1high; Tacstd2−; pAkt+) and Dist-Luminal-C (Tacstd2+; Nkx3.1low; pAkt+) cell clone in T2P mouse prostates after 7 or 14 days of tamoxifen treatment. g, Percentage of cell types in T2P mouse prostates after 7 or 14 days of tamoxifen treatment. In (f) and (g) data were from at least three independent experiments, which involving five mice (**P<0.01; ****P<0.0001, 2way ANOVA for multiple comparisons and unpaired t test). Scale bars, 50μm (a), 25μm (b-e). These data were from three independent experiments, which involving five mice(a-g). Data show mean ± standard deviation and 2way ANOVA for multiple comparisons (f,g). Scale bars, 50μm (a), 25μm (b-e). **P<0.01; ****P<0.0001 (f,g)
Extended Data Fig. 9 |. Decoding of the identity of cell types within the main human prostate cell clusters.
a, T-SNE maps show the expression levels of epithelial cell marker Epcam across 7 clusters. Blue circles indicate all the epithelial cell clusters (n = 9,825 cells). b-h, T-SNE maps show the expression levels of marker genes across 7 clusters. Blue circles indicate the h-Basal cluster (n = 5,696 cells)(b), all luminal cell clusters (n = 4,129 cells)(c), h-Luminal-A/B cluster (n = 3,434 cells) (d), h-Stromal cluster (n = 387 cells) (e), h-Macrophage cluster (n = 439 cells) (f), h-Lymphocyte cluster (n = 106 cells) (g), and h-Endothelial cluster (n = 617 cells) (h). i, Visualization of clustering of prostate single luminal cells, based on the expression of known marker genes by t-SNE (n = 4,129 cells). Decoding of the identity of cell types within the main luminal cell clusters. j, T-SNE maps show the expression levels of h-Luminal-C cell markers CK4, PSCA, TACSTD2 and PIGR (n = 908 cells). k, T-SNE maps show the expression levels of mouse Luminal-A/B cell markers HOXB13 and NKX3.1 (n = 3,166 cells). l, T-SNE maps show the expression levels of h-Luminal-A cell markers MSMB, KLK3, KLK2 and NPY (n = 2,743 cells). m, T-SNE maps show the expression levels of Luminal-B cell markers SLC14A1, MEG3, FHL2 and KRT23 (n = 423 cells). Black circle indicate the indicated cell clusters. t-SNE maps showed cells that are colored by the log-scale normalized read count of marker genes.
Extended Data Fig. 10 |. The expression levels of h-Luminal-C markers in human prostate cancer.
a, TACSTD2 immunohistochemistry staining of human prostate cancer samples (left panel), the graph indicates the percentage of TACSTD2 expression level (low, medium, high) in human prostate cancer samples (right panel). b, KRT4 immunohistochemistry staining of human prostate cancer samples (left panel), the graph indicates percentage of KRT4 expression level (low, medium, high) in human prostate cancer samples (right panel). c, PSCA immunohistochemistry staining of human prostate cancer samples (left panel), the graph indicates percentage of PSCA expression level (low, medium, high) in human prostate cancer samples (left panel). d,e, The expression levels of h-Luminal-C markers (TACSTD2, KRT4, PSCA) were analyzed in human prostate tumors and normal prostates from TCGA (n=547) (d) and GSE8218 (n=136) (e) data set. f, Graphs indicate the relationship between expression levels of h-Luminal-C markers (TACSTD2, KRT4 and PSCA) and tumor stage (n=547). Scale bars, 50μm (a-c). 13 prostate cancer samples are from Fudan University Shanghai Cancer Center, the others are from the Human Protein Atlas (https://www.proteinatlas.org/) (a-c). These experiments were administered three times with similar results (a-c). Data show mean ± standard deviation and unpaired two-tailed Student’s t-test (d-f).
Supplementary Material
Acknowledgements
We would like to acknowledge Dr. Jiaoti Huang (Duke University) and Dr. Angelo M. De Marzo (The Johns Hopkins University) for histopathological data consultation, Baojin Wu and Guoyuan Chen for animal husbandry, and Wei Bian for technical help at the SIBCB Core Facility. We thank the Genome Tagging Project (GTP) Center, Shanghai Institute of Biochemistry and Cell Biology, CAS for technical support. This study was supported by grants from the National Key Research and Development Program of China (No. 2017YFA0505500), the Strategic Priority Research Program of the Chinese Academy of Sciences (XDA16020905 and XDB19000000), the National Natural Science Foundation of China (81830054, 81772723, 61403363 and 11901272), the State Key Project for Infectious Diseases (2018ZX10302207-004-002), the Shanghai Municipal Science and Technology Major Project (No. 2017SHZDZX01) and the US National Cancer Institute (R01CA208100, R01CA193837, P50CA092629 and P30CA008748).
Footnotes
Competing interests
The authors have no competing interests to declare.
References
- 1.Shen MM & Abate-Shen C Molecular genetics of prostate cancer: new prospects for old challenges. Genes Dev 24, 1967–2000 (2010) [DOI] [PMC free article] [PubMed] [Google Scholar]
- 2.Li JJ & Shen MM Prostate Stem Cells and Cancer Stem Cells. Cold Spring Harb Perspect Med (2018). [DOI] [PMC free article] [PubMed] [Google Scholar]
- 3.Xin L, Ide H, Kim Y, Dubey P & Witte ON In vivo regeneration of murine prostate from dissociated cell populations of postnatal epithelia and urogenital sinus mesenchyme. Proc Natl Acad Sci U S A 100 Suppl 1, 11896–903 (2003). [DOI] [PMC free article] [PubMed] [Google Scholar]
- 4.Burger PE et al. Sca-1 expression identifies stem cells in the proximal region of prostatic ducts with high capacity to reconstitute prostatic tissue. Proc Natl Acad Sci U S A 102, 7180–5 (2005). [DOI] [PMC free article] [PubMed] [Google Scholar]
- 5.Goldstein AS, Huang J, Guo C, Garraway IP & Witte ON Identification of a cell of origin for human prostate cancer. Science 329, 568–71 (2010). [DOI] [PMC free article] [PubMed] [Google Scholar]
- 6.Leong KG, Wang BE, Johnson L & Gao WQ Generation of a prostate from a single adult stem cell. Nature 456, 804–8 (2008). [DOI] [PubMed] [Google Scholar]
- 7.Xin L, Lawson DA & Witte ON The Sca-1 cell surface marker enriches for a prostate-regenerating cell subpopulation that can initiate prostate tumorigenesis. Proc Natl Acad Sci U S A 102, 6942–7 (2005). [DOI] [PMC free article] [PubMed] [Google Scholar]
- 8.Gao D et al. Organoid cultures derived from patients with advanced prostate cancer. Cell 159, 176–187 (2014). [DOI] [PMC free article] [PubMed] [Google Scholar]
- 9.Karthaus WR et al. Identification of multipotent luminal progenitor cells in human prostate organoid cultures. Cell 159, 163–175 (2014). [DOI] [PMC free article] [PubMed] [Google Scholar]
- 10.Chua CW et al. Single luminal epithelial progenitors can generate prostate organoids in culture. Nat Cell Biol 16, 951–61, 1–4 (2014). [DOI] [PMC free article] [PubMed] [Google Scholar]
- 11.Wang W, Gao J, Man XH, Li ZS & Gong YF Significance of DNA methyltransferase-1 and histone deacetylase-1 in pancreatic cancer. Oncol Rep 21, 1439–47 (2009). [DOI] [PubMed] [Google Scholar]
- 12.Choi N, Zhang B, Zhang L, Ittmann M & Xin L Adult murine prostate basal and luminal cells are self-sustained lineages that can both serve as targets for prostate cancer initiation. Cancer Cell 21, 253–65 (2012). [DOI] [PMC free article] [PubMed] [Google Scholar]
- 13.Ousset M et al. Multipotent and unipotent progenitors contribute to prostate postnatal development. Nat Cell Biol 14, 1131–8 (2012). [DOI] [PubMed] [Google Scholar]
- 14.Wang ZA et al. Lineage analysis of basal epithelial cells reveals their unexpected plasticity and supports a cell-of-origin model for prostate cancer heterogeneity. Nat Cell Biol 15, 274–83 (2013). [DOI] [PMC free article] [PubMed] [Google Scholar]
- 15.Lu TL et al. Conditionally ablated Pten in prostate basal cells promotes basal-to-luminal differentiation and causes invasive prostate cancer in mice. Am J Pathol 182, 975–91 (2013). [DOI] [PubMed] [Google Scholar]
- 16.Yoo YA et al. Bmi1 marks distinct castration-resistant luminal progenitor cells competent for prostate regeneration and tumour initiation. Nat Commun 7, 12943 (2016). [DOI] [PMC free article] [PubMed] [Google Scholar]
- 17.Kwon OJ, Zhang L & Xin L Stem Cell Antigen-1 Identifies a Distinct Androgen-Independent Murine Prostatic Luminal Cell Lineage with Bipotent Potential. Stem Cells 34, 191–202 (2016). [DOI] [PMC free article] [PubMed] [Google Scholar]
- 18.Wei X et al. Spatially Restricted Stromal Wnt Signaling Restrains Prostate Epithelial Progenitor Growth through Direct and Indirect Mechanisms. Cell Stem Cell 24, 753–768 e6 (2019). [DOI] [PMC free article] [PubMed] [Google Scholar]
- 19.Pignon JC et al. Cell kinetic studies fail to identify sequentially proliferating progenitors as the major source of epithelial renewal in the adult murine prostate. PLoS One 10, e0128489 (2015). [DOI] [PMC free article] [PubMed] [Google Scholar]
- 20.Lawson DA et al. Basal epithelial stem cells are efficient targets for prostate cancer initiation. Proc Natl Acad Sci U S A 107, 2610–5 (2010). [DOI] [PMC free article] [PubMed] [Google Scholar]
- 21.Wang ZA, Toivanen R, Bergren SK, Chambon P & Shen MM Luminal cells are favored as the cell of origin for prostate cancer. Cell Rep 8, 1339–46 (2014). [DOI] [PMC free article] [PubMed] [Google Scholar]
- 22.Macosko EZ et al. Highly Parallel Genome-wide Expression Profiling of Individual Cells Using Nanoliter Droplets. Cell 161, 1202–1214 (2015). [DOI] [PMC free article] [PubMed] [Google Scholar]
- 23.Zheng GX et al. Massively parallel digital transcriptional profiling of single cells. Nat Commun 8, 14049 (2017). [DOI] [PMC free article] [PubMed] [Google Scholar]
- 24.Svensson V et al. Power analysis of single-cell RNA-sequencing experiments. Nat Methods 14, 381–387 (2017). [DOI] [PMC free article] [PubMed] [Google Scholar]
- 25.Gao D et al. A Tmprss2-CreERT2 Knock-In Mouse Model for Cancer Genetic Studies on Prostate and Colon. PLoS One 11, e0161084 (2016). [DOI] [PMC free article] [PubMed] [Google Scholar]
- 26.Reiter RE et al. Prostate stem cell antigen: a cell surface marker overexpressed in prostate cancer. Proc Natl Acad Sci U S A 95, 1735–40 (1998). [DOI] [PMC free article] [PubMed] [Google Scholar]
- 27.Qiu X et al. Reversed graph embedding resolves complex single-cell trajectories. Nat Methods 14, 979–982 (2017). [DOI] [PMC free article] [PubMed] [Google Scholar]
- 28.Williams JM & Daniel CW Mammary ductal elongation: differentiation of myoepithelium and basal lamina during branching morphogenesis. Dev Biol 97, 274–90 (1983). [DOI] [PubMed] [Google Scholar]
- 29.Giraddi RR et al. Stem and progenitor cell division kinetics during postnatal mouse mammary gland development. Nat Commun 6, 8487 (2015). [DOI] [PMC free article] [PubMed] [Google Scholar]
- 30.Scheele CL et al. Identity and dynamics of mammary stem cells during branching morphogenesis. Nature 542, 313–317 (2017). [DOI] [PMC free article] [PubMed] [Google Scholar]
- 31.Barker N, van de Wetering M & Clevers H The intestinal stem cell. Genes Dev 22, 1856–64 (2008). [DOI] [PMC free article] [PubMed] [Google Scholar]
- 32.Ramalho-Santos M, Yoon S, Matsuzaki Y, Mulligan RC & Melton DA “Stemness”: transcriptional profiling of embryonic and adult stem cells. Science 298, 597–600 (2002). [DOI] [PubMed] [Google Scholar]
- 33.Madisen L et al. A robust and high-throughput Cre reporting and characterization system for the whole mouse brain. Nat Neurosci 13, 133–40 (2010). [DOI] [PMC free article] [PubMed] [Google Scholar]
- 34.Srinivas S et al. Cre reporter strains produced by targeted insertion of EYFP and ECFP into the ROSA26 locus. BMC Dev Biol 1, 4 (2001). [DOI] [PMC free article] [PubMed] [Google Scholar]
- 35.Henry GH et al. A Cellular Anatomy of the Normal Adult Human Prostate and Prostatic Urethra. Cell Rep 25, 3530–3542 e5 (2018). [DOI] [PMC free article] [PubMed] [Google Scholar]
- 36.Jia Z et al. Diagnosis of prostate cancer using differentially expressed genes in stroma. Cancer Res 71, 2476–87 (2011). [DOI] [PMC free article] [PubMed] [Google Scholar]
- 37.Barros-Silva JD et al. Single-Cell Analysis Identifies LY6D as a Marker Linking Castration-Resistant Prostate Luminal Cells to Prostate Progenitors and Cancer. Cell Rep 25, 3504–3518 e6 (2018). [DOI] [PMC free article] [PubMed] [Google Scholar]
- 38.Lawson DA & Witte ON Stem cells in prostate cancer initiation and progression. J Clin Invest 117, 2044–50 (2007). [DOI] [PMC free article] [PubMed] [Google Scholar]
- 39.Taylor RA et al. Formation of human prostate tissue from embryonic stem cells. Nat Methods 3, 179–81 (2006). [DOI] [PubMed] [Google Scholar]
- 40.Rane JK et al. Conserved two-step regulatory mechanism of human epithelial differentiation. Stem Cell Reports 2, 180–8 (2014). [DOI] [PMC free article] [PubMed] [Google Scholar]
- 41.Wang ZA & Shen MM Revisiting the concept of cancer stem cells in prostate cancer. Oncogene 30, 1261–71 (2011). [DOI] [PubMed] [Google Scholar]
- 42.Crowell PD et al. Expansion of Luminal Progenitor Cells in the Aging Mouse and Human Prostate. Cell Rep 28, 1499–1510 e6 (2019). [DOI] [PMC free article] [PubMed] [Google Scholar]
- 43.Trotman LC et al. Pten dose dictates cancer progression in the prostate. PLoS Biol 1, E59 (2003). [DOI] [PMC free article] [PubMed] [Google Scholar]
- 44.Drost J et al. Organoid culture systems for prostate epithelial and cancer tissue. Nat Protoc 11, 347–58 (2016). [DOI] [PMC free article] [PubMed] [Google Scholar]
- 45.Goldstein AS et al. Purification and direct transformation of epithelial progenitor cells from primary human prostate. Nat Protoc 6, 656–67 (2011). [DOI] [PMC free article] [PubMed] [Google Scholar]
- 46.Hu Y & Smyth GK ELDA: extreme limiting dilution analysis for comparing depleted and enriched populations in stem cell and other assays. J Immunol Methods 347, 70–8 (2009). [DOI] [PubMed] [Google Scholar]
- 47.Satija R, Farrell JA, Gennert D, Schier AF & Regev A Spatial reconstruction of single-cell gene expression data. Nat Biotechnol 33, 495–502 (2015). [DOI] [PMC free article] [PubMed] [Google Scholar]
- 48.Kim D, Langmead B & Salzberg SL HISAT: a fast spliced aligner with low memory requirements. Nat Methods 12, 357–60 (2015). [DOI] [PMC free article] [PubMed] [Google Scholar]
- 49.Liao Y, Smyth GK & Shi W featureCounts: an efficient general purpose program for assigning sequence reads to genomic features. Bioinformatics 30, 923–30 (2014). [DOI] [PubMed] [Google Scholar]
- 50.Love MI, Huber W & Anders S Moderated estimation of fold change and dispersion for RNA-seq data with DESeq2. Genome Biol 15, 550 (2014). [DOI] [PMC free article] [PubMed] [Google Scholar]
- 51.McGinnis CS, Murrow LM & Gartner ZJ DoubletFinder: Doublet Detection in Single-Cell RNA Sequencing Data Using Artificial Nearest Neighbors. Cell Systems 8, 329–+ (2019). [DOI] [PMC free article] [PubMed] [Google Scholar]
- 52.Baglama J & Reichel L Augmented implicitly restarted Lanczos bidiagonalization methods. Siam Journal on Scientific Computing 27, 19–42 (2005). [Google Scholar]
- 53.van der Maaten L Accelerating t-SNE using Tree-Based Algorithms. Journal of Machine Learning Research 15, 3221–3245 (2014). [Google Scholar]
- 54.Robinson MD, McCarthy DJ & Smyth GK edgeR: a Bioconductor package for differential expression analysis of digital gene expression data. Bioinformatics 26, 139–40 (2010). [DOI] [PMC free article] [PubMed] [Google Scholar]
- 55.Shi J, Teschendorff AE, Chen W, Chen L & Li T Quantifying Waddington’s epigenetic landscape: a comparison of single-cell potency measures. Brief Bioinform (2018). [DOI] [PubMed] [Google Scholar]
- 56.Reimand J et al. g:Profiler-a web server for functional interpretation of gene lists (2016 update). Nucleic Acids Res 44, W83–9 (2016). [DOI] [PMC free article] [PubMed] [Google Scholar]
- 57.Teschendorff AE & Enver T Single-cell entropy for accurate estimation of differentiation potency from a cell’s transcriptome. Nat Commun 8, 15599 (2017). [DOI] [PMC free article] [PubMed] [Google Scholar]
- 58.Zhou Y et al. Metascape provides a biologist-oriented resource for the analysis of systems-level datasets. Nat Commun 10, 1523 (2019). [DOI] [PMC free article] [PubMed] [Google Scholar]
Associated Data
This section collects any data citations, data availability statements, or supplementary materials included in this article.
Supplementary Materials
Data Availability Statement
All requests for raw and analyzed data and materials should be directed to the corresponding authors. Data and materials that can be shared will be released via a material transfer agreement. All raw sequencing data created in this study have been uploaded to the National Omics Data Encyclopedia (NODE; https://www.biosino.org/node/index) with the accession number OEP000825. Source data related to Figs. 1, 2 and 6 and Extended Data Figs. 1, 2, 4, 6, 9 and 10 and Supplementary Figs. 1–5, 12 and 13 are available with the paper.


