

Abstract
Enhancers are often studied as noncoding regulatory elements that modulate the precise spatiotemporal expression of genes in a highly tissue-specific manner. This paradigm has been challenged by recent evidence of individual enhancers acting in multiple tissues or developmental contexts. However, the frequency of these enhancers with high degrees of “pleiotropy” out of all putative enhancers is not well understood. Consequently, it is unclear how the variation of enhancer pleiotropy corresponds to the variation in expression breadth of target genes. Here, we use multi-tissue chromatin maps from diverse human tissues to investigate the enhancer–gene interaction architecture while accounting for 1) the distribution of enhancer pleiotropy, 2) the variations of regulatory links from enhancers to target genes, and 3) the expression breadth of target genes. We show that most enhancers are tissue-specific and that highly pleiotropy enhancers account for <1% of all putative regulatory sequences in the human genome. Notably, several genomic features are indicative of increasing enhancer pleiotropy, including longer sequence length, greater number of links to genes, increasing abundance and diversity of encoded transcription factor motifs, and stronger evolutionary conservation. Intriguingly, the number of enhancers per gene remains remarkably consistent for all genes (∼14). However, enhancer pleiotropy does not directly translate to the expression breadth of target genes. We further present a series of Gaussian Mixture Models to represent this organization architecture. Consequently, we demonstrate that a modest trend of more pleiotropic enhancers targeting more broadly expressed genes can generate the observed diversity of expression breadths in the human genome.
Keywords: enhancer, pleiotropy, gene expression breadth, evolutionary conservation
Introduction
The precise and robust orchestration of gene expression by distal, short DNA sequences called enhancers is a hallmark of genomic regulatory landscapes (Shlyueva et al. 2014; Villar et al. 2015). Enhancers are noncoding regulatory regions often comprised clusters of transcription factor (TF) binding motifs that can modulate the transcription of genes over large genomic distances (Banerji et al. 1981; Lettice et al. 2014; Long et al. 2016). These interactions are achieved through the formation of chromatin loops bringing specific enhancers in close physical proximity to target genes within genomic segments called topological-associated domains (TADs) (Ong and Corces 2011; Dixon et al. 2012; Plank and Dean 2014). Ultimately, the resulting enhancer–gene interaction architecture governs developmental processes and tissue identities (Long et al. 2016). Previous studies have demonstrated that disruptive mutations in enhancer regions are associated with the onset of complex diseases (Maurano et al. 2012; Melton et al. 2015; Zhang et al. 2018). Enhancers may also play important roles in human specific adaptations (Prabhakar et al. 2008; Mendizabal et al. 2016; Chen, Li, et al. 2018; Flores and Ovcharenko 2018; Jeong et al. 2020). Consequently, understanding the mechanisms of the enhancer–gene interaction architecture is critical to advance our knowledge of genome regulation and evolution.
Enhancers are often characterized as regulatory elements that act in a specific spatiotemporal context, in what Sabarís et al. recently described as a “paradigm of modularity” (Sabarís et al. 2019). Genome-wide chromatin state analyses have revealed the presence of enhancers in orders of magnitude greater numbers than of genes (ENCODE 2012) implying a many-to-one interaction structure. The resulting redundancy of enhancers can stabilize gene expression by acting as a buffer to fluctuations in TF inputs (Waymack et al. 2020) and thus provide phenotypic robustness during development (Osterwalder et al. 2018). Indeed, a model in which individual enhancers, on average, have a small effect on gene expression is supported by the observation that mammalian enhancers evolve rapidly (Villar et al. 2015) and that sequence motifs comprising enhancers are functionally and phylogenetically redundant (Chen, Fish, et al. 2018; Huh et al. 2018). Interestingly, recent studies across a wide range of taxa are accumulating evidence that some enhancers can be “pleiotropic,” that is, active in multiple tissues and/or developmental stages (McKay and Lieb 2013; Infante et al. 2015; Preger-Ben Noon et al. 2018). The implications of this observation are complex as variants in pleiotropic genomic regions can have both beneficial and deleterious consequences in different tissue or developmental contexts (Guillaume and Otto 2012). Analyses of the functionality of enhancer pleiotropy have the potential to reveal details of the enhancer–gene interaction architecture and its roles in evolution (Andersson et al. 2014; Fish et al. 2017; Sabarís et al. 2019). Despite such significance, the prevalence of enhancer pleiotropy among the vast number of potential enhancers, and how it correlates to gene expression, is not well understood.
To address this critical gap of knowledge, here we elucidated the frequency and organization of enhancer pleiotropy across human tissues, utilizing recently generated multi-tissue epigenomic data (Roadmap Epigenomics Consortium et al. 2015). Our primary goal was to understand the role of the enhancer–gene interaction architecture in regulating genes of varying breadth of expression, or expression across few or many tissues. Gene expression breadth is a well characterized and widely used metric to evaluate gene activity (Yanai et al. 2005; Fagerberg et al. 2014; Kryuchkova-Mostacci and Robinson-Rechavi 2017) where some genes are expressed in a highly tissue-specific manner whereas others are broadly expressed in multiple tissues. Previous studies have investigated factors that affect gene expression breadth (Liao et al. 2006; Park et al. 2012; Hurst et al. 2014), yet the link between tissue-specific activity of enhancers and tissue-specific expression of genes remains unclear. For example, are the tissue activities of enhancers and genes matched such that housekeeping genes achieve their expression patterns through interactions with highly pleiotropic enhancers, whereas tissue-specific genes are regulated by tissue-specific enhancers? Or are these regulatory relationships more complex than a one-to-one interaction architecture? Integrating enhancer pleiotropy across tissues with gene expression breadths of target genes, our study reveals previously unknown patterns of the enhancer–gene interaction architecture and demonstrates a complex regulatory interplay between enhancers and genes extending beyond matched tissue activity patterns.
Results
Genomic Enhancer Features Are Predictive of Their Pleiotropy across Tissues
We utilized data from NIH’s Roadmap Epigenomics Mapping Consortium which contain 127 human reference epigenomes (Roadmap Epigenomics Consortium et al. 2015) to explore enhancer activity across a diverse set of tissues. A sample-balanced, representative subset of 43 samples from 23 human tissues were extracted for analysis (see Materials and Methods, supplementary table 1, Supplementary Material online). We identified genomic regions encoding enhancers (henceforth referred to as “enhancer regions” or simply “enhancers”) from the core 15-state ChromHMM model which uses five histone marks, H3K4me3, H3K4me1, H3K36me3, H3K27me3, and H3K9me3, for chromatin state-characterization (Abascal et al. 2020). In total, our data set included 646,419 unique putative enhancers (see Materials and Methods, supplementary table 1, Supplementary Material online, https://github.com/soojinyilab/Enhancer_Dataset_2020).
We first examined how often a specific genomic region exhibited an enhancer chromatin state across all sampled tissues. For example, one region (“enhancer”) might be classified as an enhancer in a single tissue, a few tissues, or in all 23 examined tissues. We define the degree of “enhancer pleiotropy” as the number of tissues in which each region was classified as an enhancer, such that low values indicate tissue-specific activity and high values indicate broad activity across multiple tissues. In the following sections, we will state that an enhancer is “found” or “present” in a tissue if a genomic region exhibits the enhancer chromatin state in one or more of the representative samples.
The distribution of enhancer pleiotropy (fig. 1a) clearly shows that the majority (75.3%) of all enhancers were found in three or fewer tissues. Approximately a quarter of all enhancers were present in 4–20 tissues (24.3%) and only 0.4% of all enhancers were found in >20 tissues (fig. 1). Therefore, only a small subset of enhancers is highly pleiotropic across tissues. Based on the observation in figure 1a, we grouped enhancers to three categories according to their enhancer pleiotropy for downstream analyses. Specifically, enhancers found in 1–3 tissues are defined as “narrow” enhancers, “intermediate” enhancers as those present in 4–20 tissues, and “broad” enhancers as those found in 21–23 tissues (see Materials and Methods). Classifying degrees of pleiotropy into a greater number of groups yielded consistent results (one such example is shown in supplementary fig. 1a and b, Supplementary Material online). The percent of the human genome comprised enhancers in each pleiotropic category is reported in supplementary table 2, Supplementary Material online.
Fig. 1.

Genomic features of enhancers classified by degree of pleiotropy. (a) The distribution of enhancers by pleiotropy, or number of tissues in which an enhancer is present, demonstrates that the majority of enhancers are highly tissue-specific. Enhancer pleiotropy increases with (b) enhancer sequence length, and (c) distance in base-pairs from enhancer to nearest gene. Enhancer pleiotropy is also positively correlated with (d) total transcription factor (TF) motif count per enhancer after accounting for the confounding effect of enhancer sequence lengths. (e) More pleiotropic enhancers also harbor greater numbers of unique TF motifs independent of enhancer length. For (a–e), Enhancers were divided into pleiotropic categories based on presence in 1–3 tissues (narrow enhancers), 4–20 tissues (intermediate enhancers), or 21–23 tissues (broad enhancers). For (d and e), Spearman’s rank correlation coefficient and the associated P-value are reported for a partial correlation analysis (Kim and Yi 2007) controlling for the effect of gene length on total and unique number of TF motifs per enhancer.
We hypothesized that some properties of enhancers may be correlated with their pleiotropic activity. Indeed, several genomic features of enhancers are predictive of their degree of pleiotropy. First, although broad enhancers are rare, they are significantly longer (mean length = 2,576 bp) than both narrow (mean length = 760 bp) and intermediate enhancers (mean length = 2,026 bp) (P < 2.2 × 10⁻¹⁶, Mann–Whitney U test). This is demonstrated by a significant and strong positive correlation between the enhancer pleiotropy and the enhancer length (Spearman’s rank correlation coefficient, ρ = 0.7, P < 2.2 × 10⁻¹⁶, fig. 1b). To ensure this correlation was not an artifact of our methods to annotate enhancers across tissues, we examined the relationship between enhancer pleiotropy and enhancer lengths in several randomly selected tissues and observed the same pattern (supplementary fig. 2, Supplementary Material online). In addition, more pleiotropic enhancers are found closer to genes than less pleiotropic enhancers (Spearman’s rank correlation coefficient, ρ = –0.16, P < 2.2 × 10⁻¹⁶, fig. 1c). Figure 1c depicts the mean distance between an enhancer and the closest adjacent gene, indicating that broad enhancers are located closest to adjacent genes, followed by intermediate, and narrow enhancers. Broad enhancers also tend to cluster more closely to other enhancers than less pleiotropic enhancers. The distance to the nearest enhancers was the shortest for the broad enhancers compared with intermediate and narrow enhancers (P < 2.2 × 10⁻¹⁶, Mann–Whitney U test, table 1).
Table 1.
Distance to Nearest Enhancer-by-Enhancer Pleiotropic Category.
| Enhancer Pleiotropy | Mean Distance | Narrow | Intermediate | Broad |
|---|---|---|---|---|
| Narrow (1–3) | 1,428 ± 7036 | * | P < 2.2e–16 | P < 2.2e–16 |
| Intermediate (4–20) | 739.5 ± 1,661 | P < 2.2e–16 | * | P = 0.1824 |
| Broad (21–23) | 624.5 ± 1,148 | P < 2.2e–16 | P = 0.1824 | * |
Finally, we directly explored the abundance and diversity of TF motifs that are encoded in enhancers to evaluate prospective variations in regulatory potential. TF motif occurrences were identified using the MEME (Bailey et al. 2009) suite’s FIMO software and the HOCOMOCO v11 core database (Kulakovskiy et al. 2016) of 680 human TF motifs. TF motif abundance (measured by the total occurrences of TF motifs) and diversity (measured by the number of unique TF motifs) were both strongly positively correlated with enhancer pleiotropy (fig. 1d and e, Spearman’s rank correlation coefficient, ρ = 0.55, and ρ = 0.58, respectively, P < 2.2 × 10⁻¹⁶ for both). This trend was significant after controlling for length using partial correlation (Kim and Yi 2007) (Spearman’s partial rank correlation coefficient, ρ = 0.13, and ρ = 0.14, respectively, P < 1 × 10⁻¹⁰ for both). Broad enhancers contained a significantly greater abundance and diversity of TF motifs compared with both intermediate and narrow enhancers (supplementary fig. 3 and supplementary table 3, Supplementary Material online).
The Majority of Enhancers Are Linked to Two or Fewer Target Genes
Given that enhancers display unique genomic characteristic according to their pleiotropic activity, we hypothesized that there would be implications of this variation on the number of targeted genes for each enhancer. In the following sections, we call the interaction between enhancers and their target genes as regulatory “links.” To investigate our prediction, we utilized a repository of enhancer–gene links generated by an algorithm (JEME) which links the activity of enhancers and genes uses multiple linear regressions and a random forest classifier (Cao et al. 2017). A total of 107,503 enhancers in our data set had target genes identified by this approach. Although this was a subset of our total enhancer data set (16.6% of all putative enhancers), the subsampling was unbiased and highly representative of the distribution of enhancers by pleiotropic category. Moreover, compared with previously generated Roadmap enhancer–gene links (Ernst et al. 2011), JEME did not overrepresent genes linked to increasingly pleiotropic enhancers (supplementary fig. 4, Supplementary Material online).
We observed that nearly half of all enhancers were linked to a single gene. On average, enhancers were linked to 2.5 genes, with over 90% of all enhancers interacting with 5 or fewer genes (fig. 2a). Despite this overarching trend, more pleiotropic enhancers tended to be linked to greater number of genes. This is demonstrated by the finding that increasing enhancer pleiotropy was positively correlated with an increasing number of linked genes (Spearman’s rank correlation coefficient, ρ = 0.25, P < 2.2 × 10⁻¹⁶, fig. 2b). This correlation was consistent after controlling for enhancer length using partial correlation (Spearman’s partial rank correlation coefficient, ρ = 0.22, P < 1 × 10⁻¹⁰). Broad enhancers were linked to an average of 9.4 genes, a 4.4-fold increase compared with the mean number of gene-links per narrow enhancer (table 2).
Fig. 2.

Patterns of links to target genes from enhancers categorized by enhancer pleiotropy. (a) The percent of all putative enhancers (N = 646,419) linked to a specific number of target genes as depicted in the schematic legend. (b) Box-and-whisker plot of the number of target genes per enhancer categorized by enhancer pleiotropy, or number of tissues in which an enhancer was present. Spearman’s rank correlation coefficient and the associated P-value are reported for a partial correlation analysis (Kim and Yi 2007) controlling for the effect of gene length on the number of target genes per enhancer. Enhancers were divided into pleiotropic categories based on presence in 1–3 tissues (narrow enhancers), 4–20 tissues (intermediate enhancers), or 21–23 tissues (broad enhancers).
Table 2.
Summary of Gene Links per Enhancer-by-Enhancer Pleiotropic Category.
| Enhancer Pleiotropy | Mean Number of Gene Links | Median Number of Gene Links | Max Number of Gene Links |
|---|---|---|---|
| Narrow (1–3) | 2.14 ± 2.0 | 1 | 33 |
| Intermediate (4–20) | 3.61 ± 3.6 | 2 | 42 |
| Broad (21–23) | 9.43 ± 6.7 | 8 | 36 |
Enhancer Pleiotropy Does Not Directly Translate to Gene Expression Breadth
Given the observation that most enhancers are tissue-specific, and that enhancer pleiotropy is positively correlated with the number of target genes per enhancer, we sought to connect the relationship between enhancer pleiotropy and gene expression breadth. Median gene-level TPM human expression data were obtained from the Genotype-Tissue Expression (GTEx) project (GTEx Consortium 2013) for all possible tissues matching the enhancer data set (N = 17 tissues, from 3,828 samples supplementary table 4, Supplementary Material online). Principal Component Analyses indicated strong effects of tissues on gene expression (supplementary fig. 5, Supplementary Material online). We employed a widely used estimate of gene expression across tissues, referred to as “expression breadth (τ)” (Yanai et al. 2005), wherein τ values are bound from 1 (genes with tissue-specific expression) to 0 (broadly expressed genes). As previously reported (Yanai et al. 2005; Kryuchkova-Mostacci and Robinson-Rechavi 2017), the distribution of genes by expression breadth shows at least two distinct peaks capturing tissue-specific genes and broad, housekeeping genes (fig. 3a).
Fig. 3.

Enhancer–gene interaction architecture accounting for enhancer pleiotropy and gene expression breadth. (a) Overview of the enhancer–gene interaction architecture. The top panel shows the distribution of enhancers by decreasing degree of pleiotropy and increasing tissue-specificity. The bottom panel displays the distribution of genes by increasing breadth of gene expression (τ) and increasing tissue-specificity. The middle panel is a schematic depiction of the enhancer–gene interaction architecture accounting for the distribution of enhancers and number of linked target genes by enhancer pleiotropic category and the distribution of genes by expression breadth (τ). (b) Comparison of the distribution of breadth of expression (τ) values for all linked target genes of enhancers by enhancer pleiotropic category (*** indicate P < 2.2 × 10⁻¹⁶, Mann–Whitney U test). (c) The mean percent of links from enhancers of each enhancer pleiotropy category to all genes (N = 16,442) evenly divided into 10 bins by gene expression breadth (τ) values. Schematic legend depicts links from enhancers categorized by pleiotropy to a representative gene. For (a–c), enhancers were divided into pleiotropic categories based on presence in 1–3 tissues (narrow enhancers), 4–20 tissues (intermediate enhancers), or 21–23 tissues (broad enhancers).
When comparing the distributions of gene expression breadth with that of enhancer pleiotropy, it is apparent that tissue-specific enhancer activity does not directly translate to distribution of gene expression breadths (fig. 3a, supplementary fig. 6, Supplementary Material online). Specifically, even after we adjusted each enhancer count by the number of linked target genes, the low frequency of broad enhancers could not be matched to the high frequency of broadly expressed genes (supplementary fig. 6b, Supplementary Material online). In fact, all enhancers, irrespective of their degree of pleiotropy, regulate both tissue-specific (high τ) and broadly expressed genes (low τ) (fig. 3b). Strikingly, narrow enhancers, which encompass over 75% of the total enhancer data set, interact with broadly expressed genes (τ < 0.5) as often as narrowly expressed genes (τ ≥ 0.5) (table 3). This observation contradicts a simple one-to-one regulatory correspondence between enhancer pleiotropy and gene expression breadth. Nevertheless, there is a slight trend that broad enhancers tend to be linked to target genes of significantly greater expression breadth (lower τ values) compared with narrow and intermediate enhancers (fig. 3b). Even though the mean expression breadths of linked target genes vary modestly between narrow (mean τ = 0.55), intermediate (mean τ = 0.49), and broad enhancers (mean τ = 0.44), the differences are statistically significant (across different enhancer pleiotropy categories, P < 2.2 × 10⁻¹⁶ in all comparisons by Mann–Whitney U test, fig. 3b).
Table 3.
Summary of Expression Breadth of Genes Regulated by Enhancers in Each Pleiotropic Category.
| Enhancer Pleiotropy | Mean τ | Median τ | Gene-links with τ ≥ 0.5 (%) | Gene-links with τ < 0.5 (%) |
|---|---|---|---|---|
| Narrow (1–3) | 0.55 ± 0.29 | 0.50 | 77399 (50%) | 78137 (50%) |
| Intermediate (4–20) | 0.49 ± 0.28 | 0.41 | 33258 (42%) | 46735 (58%) |
| Broad (21–23) | 0.44 ± 0.28 | 0.34 | 767 (33%) | 1524 (67%) |
Genes Are Linked to Similar Number of Enhancers with Varying Degrees of Pleiotropy
As a complementary approach to our previous analysis of connecting enhancer pleiotropy to gene expression breadth, we examined the distribution of linked enhancers per gene across the spectrum of gene expression breadth (τ). Remarkably, genes were consistently linked to an average of ∼14 enhancers independent of τ value (supplementary fig. 7 and supplementary table 5, Supplementary Material online) suggesting an optimization of the number of regulatory enhancer interactions per gene. When comparing the composition of enhancers classified by pleiotropic category linked to genes, we find that the use of pleiotropic enhancers varies slightly yet significantly according to the expression breadth of the target gene (fig. 3c). Genes exhibiting higher tissue specificity of expression (τ ≥ 0.5) interact with a significantly greater number of narrow enhancers (enhancers found in ≤ 3 tissues) exhibiting an O/E ratio of 1.06. Genes that are more broadly expressed (τ < 0.5) show enriched interaction with enhancers found in more than three tissues (intermediate and broad enhancers) with an O/E ratio of 1.10 (χ2 = 1529.3, P < 0.0001).
Three Component Gaussian Mixture Models Highlight the Interplay between Enhancer Pleiotropy and Gene Expression Breadth
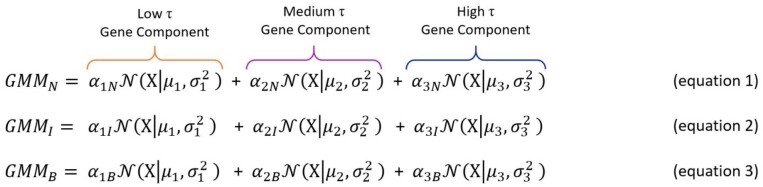
To further elucidate the regulatory relationship between enhancer pleiotropy and gene expression breadths we developed a model comprised Gaussian mixture distributions to represent the enhancer–gene interaction architecture. Specifically, the expression breadths of target genes (measured by τ values) for enhancers with different pleiotropies were represented as multi-component Gaussian mixtures (fig. 4a). Utilizing expectation maximization and AIC and BIC criteria (see Materials and Methods, supplementary fig. 8a and supplementary table 6, Supplementary Material online), we determined that the distribution of gene expression breadths of the linked target genes of enhancers were optimally represented as a three-component Gaussian mixture models (GMM), for narrow (GMMN), intermediate (GMMI), and broad enhancers (GMMB).
Fig. 4.

Modeling the enhancer–gene interaction architecture. (a) The distributions generated by each three component GMM, GMMN (top), GMMI (middle), and GMMB (bottom), overlaying histograms of the true distributions of linked target genes’ breadth of expression (τ value) for narrow, intermediate, and broad enhancers, respectively. Cross-validation results comparing observed distributions of gene-enhancer links by enhancer pleiotropic category to predicted gene-enhancer links generated from the gaussian mixture models are reported. Results are shown for R2, root mean squared error (RMSE), and mean absolute error (MAE) calculated from the caret package in R. (b) The correlation between empirical cumulative density functions (CDFs) obtained from the true distributions and the theoretical CDF generated from the composite distributions of GMMN (top), GMMI (middle), and GMMB (bottom) are plotted. Spearman’s rank correlation coefficient and the associated P-value are reported. (c) Weights (α) for all three components of the narrow (GMMN), intermediate (GMMI), and broad (GMMB) enhancer gaussian mixture models generated by the Expectation-Maximization (EM) algorithm. Component 1 represents a distribution of broadly expressed genes with average τ = 0.26, component 2 represents a distribution of intermediately expressed genes with average τ = 0.61, and component 3 represents narrowly expressed genes with average τ = 0.96.
Above, X is the distribution of τ for all linked target genes, α is the mixing weight of the associated distribution component, and µ and σ2 are the mean and variance, respectively, for the density function N(X) for each component. Figure 4a displays the distributions generated by each three component GMM overlaying histograms of the true distributions of linked target genes’ breadth of expression (τ value) for narrow, intermediate, and broad enhancers. Empirical cumulative density functions (CDFs) obtained from the true distributions and the theoretical CDF generated from the composite distributions of GMMs exhibit a near perfect correlation, validating our approach (Spearman’s rank correlation coefficient, ρ = 1, P < 2.2 × 10⁻¹⁶, fig. 4b).
Our models visualize two aspects of the enhancer–gene interaction architecture: 1) the prevalence of genes across the spectrum of expression breadth, and 2) the number of links from enhancers of each pleiotropic category to genes of varying expression breadth. The first feature was previously shown to exhibit a bimodal distribution largely comprised broadly expressed genes and tissue-specific genes (supplementary fig. 6a, Supplementary Material online; also [Yanai et al. 2005; Kryuchkova-Mostacci and Robinson-Rechavi 2017]). Our finding suggests that a three-component distribution including a group of gene with a medium level of gene expression might be more representative of the enhancer–gene interaction architecture (supplementary fig. 8, Supplementary Material online). The second point is emphasized by the variation of the weight parameters (α) in corresponding components of the three models, visualizing the size of the contribution of genes with different expression breadths to the Gaussian mixture distributions of each enhancer pleiotropic category (table 4, fig. 4c). The weight of the first component, associated with more broadly expressed genes (µ = 0.26, supplementary table 7, Supplementary Material online), increases with increasing enhancer pleiotropy. On the other hand, the weight of the third component, associated with more tissue-specific genes (µ = 0.26, supplementary table 7, Supplementary Material online), decreases from the narrow to broad enhancer models. These model results mirror our previous findings (fig. 3) and supports the conclusion that, even though the total number of enhancers per gene is largely constant across the genome (supplementary fig. 7 and supplementary table 5, Supplementary Material online), slight shifts of the usage of pleiotropic enhancers by broadly expressed genes can achieve the range of gene expression breadths of target genes.
Table 4.
Distribution Weights (α) for All Three Components of the Narrow (GMMN), Intermediate (GMMI), and Broad (GMMB) Enhancer Gaussian Mixture Models Generated by the Expectation-Maximization (EM) Algorithm.
| Model | Component | Weight (α) |
|---|---|---|
| GMMN | 1 | 0.36 |
| 2 | 0.42 | |
| 3 | 0.22 | |
| GMMI | 1 | 0.44 |
| 2 | 0.41 | |
| 3 | 0.15 | |
| GMMB | 1 | 0.57 |
| 2 | 0.31 | |
| 3 | 0.13 |
Enhancers Exhibit Distinct Signatures of Sequence Conservation Dependent on Degree of Pleiotropy
Previous work from mammalian genomes (Villar et al. 2015) showed that enhancers undergo rapid evolutionary turnover. Importantly, the authors found that enhancer conservation was a rare event observed in only 1% of all analyzed enhancers. Given that rare, broad enhancers exhibit a distinct signature of increased links to target genes and a modest increase in interactions with broadly expressed genes, we hypothesized that enhancers with different pleiotropies may exhibit different degrees of evolutionary conservation. To test this prediction, we used multiple approaches to evaluate conservation, namely, 1) determining the enrichment of conserved elements within enhancers, 2) identifying the distribution of highly conserved segments within each enhancer (see below and Materials and Methods), and 3) calculating overall the normalized ratio of significantly conserved sites per enhancer. For robustness, we employed two independent measures to quantify conservation, the Genomic Evolutionary Rate Profiling (GERP) Reduced Substitution (RS) score (Cooper et al. 2005) and the Phylogenetic P-values (PhyloP) score (Pollard et al. 2010).
We first examined the enrichment of GERP conserved elements (Cooper et al. 2005; Davydov et al. 2010) within enhancers. All enhancers, independent of pleiotropic category, were significantly enriched for conserved elements compared with length-matched control regions (P < 0.0001 based on 10,000 bootstraps, fig. 5a). When separated to different pleiotropy categories, broad enhancers exhibited the highest enrichment (fold change [FC] = 2.04 compared with the control regions), followed by intermediate enhancers (FC = 1.94) and narrow enhancers (FC = 1.64).
Fig. 5.

Signatures of conservation in enhancers categorized by pleiotropy. (a) Enrichment of conserved regions identified by GERP score in narrow, intermediate, and broad enhancers. The enrichment is shown through a comparison with length matched control regions. For all categories, P < 0.0001 (illustrated as *) based on 10,000 bootstraps and error bars indicating standard deviation are shown. The distributions of local max PhyloP score, defined as the 50 bp window within an enhancer with the highest mean PhyloP score, is reported for enhancers by degree of pleiotropy (b) and enhancer divided into pleiotropic category (c). The distributions of the normalized ratio of significantly conserved sites, defined as number of sites in an enhancer with PhyloP score ≥ 1.3 over the total sequence length of the enhancer, is reported for enhancers by degree of pleiotropy (d) and enhancer divided into pleiotropic category (e). For (a–d), Enhancers were divided into pleiotropic categories based on presence in 1–3 tissues (narrow enhancers), 4–20 tissues (intermediate enhancers), or 21–23 tissues (broad enhancers). For (b and c), the blue dashed line indicates a PhyloP score threshold above which implies significant conservation (PhyloP score ≥ 1.3 corresponding to a P-value of ≤ 0.05). For (b and d), Spearman’s rank correlation coefficient and the associated P-value are reported. For (c and e), three asterisks (***) indicate P < 2.2 × 10⁻¹⁶ and two asterisks (**) indicate P < 1 × 10⁻⁹ based on Mann–Whitney U tests.
Next, we evaluated the presence of highly conserved regions within individual enhancers, which may be representative of critical functional components encoded within enhancer regions. Specifically, we calculated the mean conservation scores for all regions within each enhancer using a sliding window with a fixed step size to determine the “local max conservation score” across each enhancer. Figure 5b illustrates the positive correlation between increasing enhancer pleiotropy and increasing local max conservation score (Spearman’s rank correlation coefficient, ρ = 0.39, P < 2.2 × 10⁻¹⁶, fig. 5b). Accordingly, the local max conservation score increases significantly between narrow to intermediate enhancers, and between intermediate to broad enhancers (P < 2.2 × 10⁻¹⁶ for all comparisons, Mann–Whitney U test, fig. 5c). To address any potentially confounding effect of enhancer length on conservation, we further calculated the ratio of significantly conserved sites per enhancer normalized by the enhancer’s sequence length. Similar to previously used criterion (Davydov et al. 2010), we defined sites in the top 10% of all genomic RS scores (RS score ≥ 2) as those exhibiting “constrained” conservation. Additionally, we used a of PhyloP score ≥ 1.3 corresponding to a P-value of ≤ 0.05 as a threshold for significant conservation. We show a significant positive correlation between enhancer pleiotropy and the normalized ratio of conserved sites (Spearman’s rank correlation coefficient, ρ = 0.15, P < 2.2 × 10⁻¹⁶, fig. 5d). Broad and intermediate enhancers contained a significantly greater proportion of conserved sites than narrow enhancers (P < 1 × 10⁻⁹ and P < 2.2 × 10⁻¹⁶, respectively from Mann–Whitney U tests, fig. 5e). Figures 5b–e all show results generated using PhyloP scores, however, the results were highly consistent with those generated using GERP RS score (supplementary figs. 9 and 10, Supplementary Material online). Collectively, these analyses indicate that sequence conservation is more prevalent in more pleiotropic enhancers.
Discussion
In this study, we explored the regulatory architecture of enhancer–gene interactions and gene expression breadth. We demonstrated that enhancers primarily act in a tissue-specific manner; highly pleiotropic enhancers were rare, constituting <1% of all putative enhancers across the examined tissues. Notably, recent comparative studies between distant mammalian species have indicated that enhancers tend to be tissue- and species-specific (Villar et al. 2015; Roller et al. 2020). Despite the extreme skew toward tissue-specific enhancer activity, several notable genomic characteristics are positively correlated with increasing enhancer pleiotropy. Specifically, more pleiotropic enhancers are longer, located in closer proximity to genes, comprised a greater abundance and diversity of TF motifs, and linked to a greater number of target genes. These features suggest that highly pleiotropic enhancers are “repurposed,” or used as regulatory elements for a greater number of genes and tissue contexts, more often than less pleiotropic enhancers, potentially due to their closer proximity to genes and increased regulatory potential due to encoded TF motifs. Indeed, the functional importance of these highly pleiotropic enhancers is supported by the finding that broad enhancers are significantly more conserved than narrow or even intermediate enhancers. Notably, enhancers which clustered closer to genes have previously been found to contain developmentally critical TF binding motifs and to be subsequently deeply conserved (Boffelli et al. 2004).
A recent study by Fish et al. (2017) analyzing an independent enhancer data set in which enhancers were categorized based on species-specific activity or species-conserved activity found that species-conserved enhancers were more pleiotropic than species-specific enhancers. The authors further determined that species-conserved enhancers contained a greater number and diversity of TF binding motifs, providing complimentary support to our conclusion that pleiotropic enhancers exhibit greater regulatory potential within species. In addition, these observations provide potential explanations for intriguing differences between enhancers and promoters—even though both enhancers and promoters are capable of initiating transcription (Nguyen et al. 2016), promoters are on average longer and more conserved than enhancers (Nguyen et al. 2016; Huh et al. 2018), and house sequence motifs with greater effect sizes (Huh et al. 2018). Our study supports the idea that some of the difference between promoters and enhancers may be due to the proximity of promoters to genes themselves.
One of our primary study objectives was to link the breadth of enhancer activity, or degree of pleiotropy, to the well characterized distribution of gene expression breadth (Yanai et al. 2005; Fagerberg et al. 2014; Kryuchkova-Mostacci and Robinson-Rechavi 2017). Overall, the number of target genes per enhancer and the number of linked enhancers per gene are remarkably consistent across the genome. The distribution of enhancer pleiotropy cannot explain the distribution gene expression breadth by directly matching tissue activity. Indeed, when examining the composition of enhancers categorized by pleiotropy that interact with genes of varying expression breadth, we determined that all enhancers, independent of pleiotropic category, regulate both tissue-specific and broadly expressed genes. In fact, narrow enhancers, the predominant form of enhancers in the human genome, regulate narrowly expressed genes as often as broadly expressed ones. Nevertheless, highly pleiotropic enhancers more often are linked to broadly expressed genes than to tissue-specific genes, albeit slightly. We show that this slight shift in the link between pleiotropic enhancers and broadly expressed genes, together with the optimized number of enhancer–gene links, can explain the distributions of gene expression breadth and enhancer pleiotropy. Our study thus provides novel and useful insight into understanding the underlying regulatory logic of enhancer–gene interaction architecture.
Materials and Methods
Enhancer Data Set Generation and Pleiotropic Classification
Enhancer data were obtained from the NIH Roadmap Epigenomics Mapping Consortium (http://www.roadmapepigenomics.org/, last accessed January 5, 2021) which combines 111 reference human epigenomes generated from the Roadmap Epigenomics Project with 16 epigenomes from the Encyclopedia of DNA Elements (ENCODE) project (ENCODE+Roadmap data set). Of the 127 available epigenomes, any samples generated from cancer derived cell lines were removed. To avoid confounding results caused by overrepresented tissues, two representative samples were randomly selected for each tissue to maximize the number of tissues which could be included in this analysis. Finally, all fetal samples (n = 11) were retained to include developmental enhancers which may not be present in adult tissues. Following samples filtration, a final data set of 43 samples spanning from 23 human tissues were used for downstream analysis (supplementary table 1, Supplementary Material online). Once the epigenomes were selected, enhancer coordinates were obtained from the core 15-state ChromHMM model which uses five histone marks, H3K4me3, H3K4me1, H3K36me3, H3K27me3, and H3K9me3, for chromatin state-characterization. Specifically, state 6 (genic enhancers) and state 7 (enhancers) coordinates were extracted.
To process the enhancer data, a methodology similar to that of Cao et al. was implemented (Cao et al. 2017). All enhancers from replicated samples of the same tissue were assigned to the common tissue. Then, the union of all enhancers across all samples was taken to generate a data matrix with N = 3,293,794 total candidate enhancer regions. Outlier regions with the top 5% length (length > 3,500 bp) were removed and excluded from downstream analysis. All candidate enhancer region was then merged with other regions that overlapped by >50% the length of the shorter candidate region to generate the putative enhancer data set. Permutation analyses of length filtration and overlap thresholds for merging were performed, and the results and overarching trends remained consistent across all analysis variations (supplementary fig. 1c, Supplementary Material online). Importantly, the cumulative number of putative enhancers increased with the inclusion of each additional tissue sample, but the total number of enhancers consistently began to stabilize once eight or more tissues were added across several variations of the merging criteria (supplementary fig. 1d, Supplementary Material online). With the inclusion of the first six tissues, ∼50% (305719/646419) of the total data set was identified (supplementary fig. 1e, Supplementary Material online). The final enhancer data set and extended enhancer attribute file are available at https://github.com/soojinyilab/Enhancer_Dataset_2020.
To assign tissue pleiotropic classifications, enhancers found in the fewest tissues (1–3 tissues, bottom 13% of the total number of tissues) were denoted as “narrow enhancers” and the enhancers found in the most tissues (21–23 tissues, top 13% of the total number of tissues) were classified as “broad enhancers.” Enhancers present in 4–20 tissues shared features of both “narrow” and “broad” enhancers and were thus deemed “intermediate enhancers.” Several more minute dissections of the classification system were considered for this analysis (representative alternative classification shown in supplementary fig. 1a and b, Supplementary Material online); however, our aim in utilizing a three category classification scheme was to capture overarching trends in genomic features and gene regulation of enhancers while improving the simplicity and clarity of analyses and visualization.
Identification of TF Occurrences
To determine the occurrences of TF motifs in enhancers categorized by their degree of pleiotropy, we identified TF motifs using the MEME suite (Bailey et al. 2009)’s FIMO software and the HOCOMOCO v11 core database (Kulakovskiy et al. 2016) containing 680 human TF motifs. Default parameters and a q-value threshold of <0.1 was set as inputs for FIMO for TF motifs to be matched to input enhancer sequences classified by degree of pleiotropy.
Enhancer–Gene Target Links
The list of target genes of enhancer activity was obtained from http://yiplab.cse.cuhk.edu.hk/jeme/ (last accessed May 5, 2020) which is a repository of enhancer–gene links inferred by JEME from the ENCODE+Roadmap data set (Cao et al. 2017). Briefly, JEME is a supervised machine-learning technique which utilizes a random-forest classifier to predict enhancer–gene links based on the correlation between gene expression and normalized epigenetic marks within large windows (1 Mb around each transcription start site [TSS]). The epigenetic marks used included three histone modifications, H3K4me1, H3K27ac, and H3K27me3, generated from ChIP-seq and DNase I hypersensitivity sites from DNase-seq. JEME implements cross-validation with shuffling and integrates both global and sample specific enhancer activity signatures to ensure important sample specific enhancer–target interactions are not missed due to weak signals across all samples.
Gene Expression Data Acquisition and Processing
Per-tissue median gene level TPM expression data from the GTEx Project were obtained from the GTEx Portal (dbGaP accession number phs000424.v7.p2) on 02/14/2019 for all possible tissues matching the enhancer data set (N = 17 tissues from 3,828 samples, supplementary table 4, Supplementary Material online). Any genes with gene expression values equaling zero across all tissues were removed. The breadth of gene expression (τ) was calculated for all genes based on the algorithm derived by Yanai et al. (2005). The equation for τ of a gene is defined as:
| (equation 4) |
where is the total number of tissues and is the expression value of a single tissue normalized by the maximal expression value across all tissues bounding τ values between 0 (broadly expressed genes) and 1 (narrowly expressed genes).
Because τ calculations are sensitive to the number of tissues included in the analysis (eq. 4), we opted to use the GTEx expression data set to optimize the number of tissues matching the enhancer tissue set (17/23 tissues with gene expression data). Direct RNA-seq data are available for 13/23 tissues through the Roadmap Epigenomics Project (supplementary table 8, Supplementary Material online), however, τ values from this subset would be biased toward more broadly expressed genes due to the reduction in total tissue count. To ensure that the larger GTEx gene expression data set was representative of the expression profiles of the ENCODE+Roadmap enhancer data set, we sought to ensure the direction of gene expression was consistent between the two RNA-seq data sets. Indeed, the τ-values were highly correlated and significant (Spearman’s rank correlation coefficient, ρ = 0.92, P < 2.2 × 10⁻¹⁶, supplementary fig. 11, Supplementary Material online).
Mathematical Modeling
Gaussian mixture equations modeling the distribution of links to all genes of varying τ values by enhancer pleiotropic category were defined as GMMN, GMMI, GMMB for narrow, intermediate, and broad enhancers, respectively (eqs. 1–3). Each density function takes the general form of equation (5).
| (equation 5) |
First a composite distribution of all enhancer–gene links independent of enhancer pleiotropy was generated and used to determine the optimal number of mixture components for the models. Mixtures of 1–3 components were fit to the composite model using the Expectation-Maximization (EM) algorithm implemented using normalmixEM from the mixtools package (Benaglia et al. 2009) in R. AIC (Akaike 1974) and BIC (Schwarz 1978) values were used as the criteria for selecting the three component model.
To reduce model overfitting, mean (µ1, µ2, µ3) and variance (σ21, σ22, σ23) parameters for all three components were first estimated from the composite distribution and utilized as fixed values in GMMN, GMMI, and GMMB (supplementary table 7, Supplementary Material online). The weight parameters (α1, α2, α3) were then estimated independently. As a validation of the models, the correlations between the empirical CDF from the true distributions of enhancer–gene links and the theoretical CDF generated from the composite GMM distributions were calculated for each enhancer pleiotropy model (GMMN, GMMI, GMMB). Additionally, the correlation (R2), root mean squared error (RMSE), and mean absolute error (MAE) were calculated comparing the true distributions to those generated by the models using the caret package in R (Kuhn 2008).
Enhancer Conservation Analysis
Genome-wide nucleotide resolution conservation scores were defined as GERP RS scores (Cooper et al. 2005) and Phylogenetic P-values (PhyloP) scores (Pollard et al. 2010). GERP RS scores were obtained from http://mendel.stanford.edu/SidowLab/downloads/gerp/hg19.GERP_scores.tar.gz (Last accessed May 18, 2020) (Cooper et al. 2005; Davydov et al. 2010) whereas PhyloP scores were downloaded from http://hgdownload.cse.ucsc.edu/goldenPath/hg19/phyloP46way/ (last accessed January 5, 2021) generated from the alignment of 36 and 46 mammals, respectively. Any site with a conservation score of zero was filtered out of the analysis for both metrics as it represents a position at which there were too few species alignments to generate an accurate conservation score. Three approaches were utilized to evaluate enhancer conservation by pleiotropic category: 1) determining the enrichment of conserved elements within enhancer regions classified by pleiotropic category, 2) identifying local maximum conservation scores, and 3) calculating the ratio of conserved sites per enhancer normalized by enhancer sequence length.
For approach (1), the enrichment of previously defined conserved elements was analyzed compared with length matched control regions across enhancers classified by pleiotropy. The elements were identified by the program gerpelem (Davydov et al. 2010). First, the overlaps between the conserved elements and narrow, intermediate, and broad enhancers were determined. Next, 10,000 length match control regions for all conserved elements were generated and overlapped with enhancers by pleiotropic category. The fold-change was calculated for all categories comparing the overlap of conserved elements compared with the bootstrap control and P-values were reported as the ratio of number of simulated values as at least as extreme as the observed values to the total number of simulations.
For approach (2), a local max conservation score was generated by calculating the average RS and PhyloP score across 50 bp windows using a 10 bp step size and reporting the maximum average conservation score for each enhancer or “local max conservation score.” The distribution and median local max conservation score were then plotted independently for all enhancers by the number of tissues they are found in as well as for enhancers by pleiotropic category (narrow, intermediate, and broad). Finally, in approach (3), the number of sites above a significant conservation score threshold over the total enhancer length was reported for all enhancers generating a “ratio of conserved sites” value per enhancer normalized by enhancer length. For RS scores, a significant threshold of RS ≥ 2 was chosen for this analysis capturing the top 10% of all scores across the genome. Additionally, a PhyloP score ≥ 1.3 corresponding to a P-value of ≤ 0.05 was select as a threshold of significant conservation. As above, the distribution and median fraction of conserved sites were plotted independently for all enhancers by the number of tissues they are found in as well as for enhancers classified by pleiotropy (narrow, intermediate, and broad).
Supplementary Material
Supplementary data are available at Molecular Biology and Evolution online.
Supplementary Material
Acknowledgments
This study was supported by grants from the National Institute of Health to S.V.Y. (R01MH103517) and the National Science Foundation (EF-2021635). D.S. is partially supported by the NIH Training Grant in Computational Biology and Biomedical Genomics (T32 GM105490).
Data Availability
All data underlying this article are available in the article and in its Supplementary Material online and in the provided github page (https://github.com/soojinyilab/Enhancer_Dataset_2020).
References
- Abascal F, Acosta R, Addleman NJ, Adrian J, Afzal V, Aken B, Akiyama JA, Jammal OA, Amrhein H, Anderson SM, et al. 2020. Expanded encyclopaedias of DNA elements in the human and mouse genomes. Nature 583(7818):699–710. [DOI] [PMC free article] [PubMed] [Google Scholar]
- Akaike H.1974. A new look at the statistical model identification. IEEE Trans Automat Contr. 19(6):716–723. [Google Scholar]
- Andersson R, Gebhard C, Miguel-Escalada I, Hoof I, Bornholdt J, Boyd M, Chen Y, Zhao X, Schmidl C, Suzuki T, et al. 2014. An atlas of active enhancers across human cell types and tissues. Nature 507(7493):455–461. [DOI] [PMC free article] [PubMed] [Google Scholar]
- Bailey TL, Boden M, Buske FA, Frith M, Grant CE, Clementi L, Ren J, Li WW, Noble WS.. 2009. MEME SUITE: tools for motif discovery and searching. Nucleic Acids Res. 37(Web Server issue):W202–W208. [DOI] [PMC free article] [PubMed] [Google Scholar]
- Banerji J, Rusconi S, Schaffner W.. 1981. Expression of a β-globin gene is enhanced by remote SV40 DNA sequences. Cell 27(2 Pt 1):299–308. [DOI] [PubMed] [Google Scholar]
- Benaglia T, Chauveau D, Hunter D, Young D.. 2009. mixtools: an R package for analyzing finite mixture models. J Stat Softw. 32(6):1–29.
- Boffelli D, Nobrega MA, Rubin EM.. 2004. Comparative genomics at the vertebrate extremes. Nat Rev Genet. 5(6):456–465. [DOI] [PubMed] [Google Scholar]
- Cao Q, Anyansi C, Hu X, Xu L, Xiong L, Tang W, Mok MTS, Cheng C, Fan X, Gerstein M, et al. 2017. Reconstruction of enhancer–target networks in 935 samples of human primary cells, tissues and cell lines. Nat Genet. 49(10):1428–1436. [DOI] [PubMed] [Google Scholar]
- Chen H, Li C, Zhou Z, Liang H.. 2018. Fast-evolving human-specific neural enhancers are associated with aging-related diseases. Cell Syst. 6(5):604–611.e604. [DOI] [PMC free article] [PubMed] [Google Scholar]
- Chen L, Fish AE, Capra JA.. 2018. Prediction of gene regulatory enhancers across species reveals evolutionarily conserved sequence properties. PLoS Comput Biol. 14(10):e1006484. [DOI] [PMC free article] [PubMed] [Google Scholar]
- Cooper GM, Stone EA, Asimenos G, Green ED, Batzoglou S, Sidow A, 2005. Distribution and intensity of constraint in mammalian genomic sequence. Genome Res. 15(7):901–913. [DOI] [PMC free article] [PubMed] [Google Scholar]
- Davydov EV, Goode DL, Sirota M, Cooper GM, Sidow A, Batzoglou S.. 2010. Identifying a high fraction of the human genome to be under selective constraint using GERP++. PLoS Comput Biol. 6(12):e1001025. [DOI] [PMC free article] [PubMed] [Google Scholar]
- Dixon JR, Selvaraj S, Yue F, Kim A, Li Y, Shen Y, Hu M, Liu JS, Ren B.. 2012. Topological domains in mammalian genomes identified by analysis of chromatin interactions. Nature 485(7398):376–380. [DOI] [PMC free article] [PubMed] [Google Scholar]
- ENCODE. 2012. An integrated encyclopedia of DNA elements in the human genome. Nature 489:57–74. [DOI] [PMC free article] [PubMed] [Google Scholar]
- Ernst J, Kheradpour P, Mikkelsen TS, Shoresh N, Ward LD, Epstein CB, Zhang X, Wang L, Issner R, Coyne M, et al. 2011. Mapping and analysis of chromatin state dynamics in nine human cell types. Nature 473(7345):43–49. [DOI] [PMC free article] [PubMed] [Google Scholar]
- Fagerberg L, Hallström BM, Oksvold P, Kampf C, Djureinovic D, Odeberg J, Habuka M, Tahmasebpoor S, Danielsson A, Edlund K, et al. 2014. Analysis of the human tissue-specific expression by genome-wide integration of transcriptomics and antibody-based proteomics. Mol Cell Proteomics. 13(2):397–406. [DOI] [PMC free article] [PubMed] [Google Scholar]
- Fish A, Chen L, Capra JA.. 2017. Gene regulatory enhancers with evolutionarily conserved activity are more pleiotropic than those with species-specific activity. Genome Biol Evol. 9(10):2615–2625. [DOI] [PMC free article] [PubMed] [Google Scholar]
- Flores MA, Ovcharenko I.. 2018. Enhancer reprogramming in mammalian genomes. BMC Bioinformatics 19(1):316. [DOI] [PMC free article] [PubMed] [Google Scholar]
- GTEx Consortium. 2013. The genotype-tissue expression (GTEx) project. Nat Genet. 45:580–585. [DOI] [PMC free article] [PubMed] [Google Scholar]
- Guillaume F, Otto SP.. 2012. Gene functional trade-offs and the evolution of pleiotropy. Genetics 192(4):1389–1409. [DOI] [PMC free article] [PubMed] [Google Scholar]
- Huh I, Mendizabal I, Park T, Yi SV.. 2018. Functional conservation of sequence determinants at rapidly evolving regulatory regions across mammals. PLoS Comput Biol. 14(10):e1006451. [DOI] [PMC free article] [PubMed] [Google Scholar]
- Hurst LD, Sachenkova O, Daub C, Forrest ARR, Huminiecki L, the Fc. 2014. A simple metric of promoter architecture robustly predicts expression breadth of human genes suggesting that most transcription factors are positive regulators. Genome Biol. 15(7):413. [DOI] [PMC free article] [PubMed] [Google Scholar]
- Infante CR, Mihala AG, Park S, Wang JS, Johnson KK, Lauderdale JD, Menke DB.. 2015. Shared enhancer activity in the limbs and phallus and functional divergence of a limb-genital cis-regulatory element in snakes. Dev Cell. 35(1):107–119. [DOI] [PMC free article] [PubMed] [Google Scholar]
- Jeong H, Mendizabal I, Berto S, Chatterjee P, Layman T, Usui N, Toriumi K, Douglas C, Singh D, Huh I, et al. 2021. Evolution of DNA methylation in the human brain. Nature communications. 12(1):1–2. [DOI] [PMC free article] [PubMed] [Google Scholar]
- Kim S-H, Yi SV.. 2007. Understanding relationship between sequence and functional evolution in yeast proteins. Genetica 131(2):151–156. [DOI] [PubMed] [Google Scholar]
- Kryuchkova-Mostacci N, Robinson-Rechavi M.. 2017. A benchmark of gene expression tissue-specificity metrics. Brief Bioinform. 18(2):205–214. [DOI] [PMC free article] [PubMed] [Google Scholar]
- Kuhn M.2008. Building predictive models in R using the caret package. 28:26. [Google Scholar]
- Kulakovskiy IV, Vorontsov IE, Yevshin IS, Soboleva AV, Kasianov AS, Ashoor H, Ba-Alawi W, Bajic VB, Medvedeva YA, Kolpakov FA, et al. 2016. HOCOMOCO: expansion and enhancement of the collection of transcription factor binding sites models. Nucleic Acids Res. 44(D1):D116–D125. [DOI] [PMC free article] [PubMed] [Google Scholar]
- Lettice LA, Williamson I, Devenney PS, Kilanowski F, Dorin J, Hill RE.. 2014. Development of five digits is controlled by a bipartite long-range cis-regulator. Development 141(8):1715–1725. [DOI] [PMC free article] [PubMed] [Google Scholar]
- Liao B-Y, Scott NM, Zhang J.. 2006. Impacts of gene essentiality, expression pattern, and gene compactness on the evolutionary rate of mammalian proteins. Mol Biol Evol. 23(11):2072–2080. [DOI] [PubMed] [Google Scholar]
- Long HK, Prescott SL, Wysocka J.. 2016. Ever-changing landscapes: transcriptional enhancers in development and evolution. Cell 167(5):1170–1187. [DOI] [PMC free article] [PubMed] [Google Scholar]
- Maurano MT, Humbert R, Rynes E, Thurman RE, Haugen E, Wang H, Reynolds AP, Sandstrom R, Qu H, Brody J, et al. 2012. Systematic localization of common disease-associated variation in regulatory DNA. Science 337(6099):1190–1195. [DOI] [PMC free article] [PubMed] [Google Scholar]
- McKay DJ, Lieb JD.. 2013. A common set of DNA regulatory elements shapes Drosophila appendages. Dev Cell. 27(3):306–318. [DOI] [PMC free article] [PubMed] [Google Scholar]
- Melton C, Reuter JA, Spacek DV, Snyder M.. 2015. Recurrent somatic mutations in regulatory regions of human cancer genomes. Nat Genet. 47(7):710–716. [DOI] [PMC free article] [PubMed] [Google Scholar]
- Mendizabal I, Shi L, Keller TE, Konopka G, Preuss TM, Hsieh TF, Hu E, Zhang Z, Su B, Yi SV.. 2016. Comparative methylome analyses identify epigenetic regulatory loci of human brain evolution. Mol Biol Evol. 33(11):2947–2959. [DOI] [PMC free article] [PubMed] [Google Scholar]
- Nguyen TA, Jones RD, Snavely AR, Pfenning AR, Kirchner R, Hemberg M, Gray JM.. 2016. High-throughput functional comparison of promoter and enhancer activities. Genome Res. 26(8):1023–1033. [DOI] [PMC free article] [PubMed] [Google Scholar]
- Ong C-T, Corces VG.. 2011. Enhancer function: new insights into the regulation of tissue-specific gene expression. Nat Rev Genet. 12(4):283–293. [DOI] [PMC free article] [PubMed] [Google Scholar]
- Osterwalder M, Barozzi I, Tissieres V, Fukuda-Yuzawa Y, Mannion BJ, Afzal SY, Lee EA, Zhu Y, Plajzer-Frick I, Pickle CS, et al. 2018. Enhancer redundancy provides phenotypic robustness in mammalian development. Nature 554(7691):239–243. [DOI] [PMC free article] [PubMed] [Google Scholar]
- Park J, Xu K, Park T, Yi SV.. 2012. What are the determinants of gene expression levels and breadths in the human genome? Hum Mol Genet. 21(1):46–56. [DOI] [PMC free article] [PubMed] [Google Scholar]
- Plank JL, Dean A.. 2014. Enhancer function: mechanistic and genome-wide insights come together. Mol Cell. 55(1):5–14. [DOI] [PMC free article] [PubMed] [Google Scholar]
- Pollard KS, Hubisz MJ, Rosenbloom KR, Siepel A.. 2010. Detection of nonneutral substitution rates on mammalian phylogenies. Genome Res. 20(1):110–121. [DOI] [PMC free article] [PubMed] [Google Scholar]
- Prabhakar S, Visel A, Akiyama JA, Shoukry M, Lewis KD, Holt A, Plajzer-Frick I, Morrison H, Fitzpatrick DR, Afzal V, et al. 2008. Human-specific gain of function in a developmental enhancer. Science 321(5894):1346–1350. [DOI] [PMC free article] [PubMed] [Google Scholar]
- Preger-Ben Noon E, Sabarís G, Ortiz DM, Sager J, Liebowitz A, Stern DL, Frankel N.. 2018. Comprehensive analysis of a cis-regulatory region reveals pleiotropy in enhancer function. Cell Rep. 22(11):3021–3031. [DOI] [PubMed] [Google Scholar]
- Kundaje A, Meuleman W, Ernst J, Bilenky M, Yen A, Heravi-Moussavi A, Kheradpour P, Zhang Z, Wang J, Ziller MJ, et al. 2015. Integrative analysis of 111 reference human epigenomes. Nature 518(7539):317–330. [DOI] [PMC free article] [PubMed] [Google Scholar]
- Roller M, Stamper E, Villar D, Izuogu O, Martin F, Redmond A, Ramachanderan R, Harewood L, Odom DT, Flicek P.. 2020. LINE elements are a reservoir of regulatory potential in mammalian genomes. bioRxiv 2020.2005.2031.126169. doi: 10.1101/2020.05.31.126169.
- Sabarís G, Laiker I, Preger-Ben Noon E, Frankel N.. 2019. Actors with multiple roles: pleiotropic enhancers and the paradigm of enhancer modularity. Trends Genet. 35(6):423–433. [DOI] [PubMed] [Google Scholar]
- Schwarz G.1978. Estimating the dimension of a model. Ann Stat. 6(2):461–464. [Google Scholar]
- Shlyueva D, Stampfel G, Stark A.. 2014. Transcriptional enhancers: from properties to genome-wide predictions. Nat Rev Genet. 15(4):272–286. [DOI] [PubMed] [Google Scholar]
- Villar D, Berthelot C, Aldridge S, Rayner TF, Lukk M, Pignatelli M, Park TJ, Deaville R, Erichsen JT, Jasinska AJ, et al. 2015. Enhancer evolution across 20 mammalian species. Cell 160(3):554–566. [DOI] [PMC free article] [PubMed] [Google Scholar]
- Waymack R, Fletcher A, Enciso G, Wunderlich Z.. 2020. Shadow enhancers can suppress input transcription factor noise through distinct regulatory logic. eLife 9:e59351. [DOI] [PMC free article] [PubMed] [Google Scholar]
- Yanai I, Benjamin H, Shmoish M, Chalifa-Caspi V, Shklar M, Ophir R, Bar-Even A, Horn-Saban S, Safran M, Domany E, et al. 2005. Genome-wide midrange transcription profiles reveal expression level relationships in human tissue specification. Bioinformatics 21(5):650–659. [DOI] [PubMed] [Google Scholar]
- Zhang G, Shi J, Zhu S, Lan Y, Xu L, Yuan H, Liao G, Liu X, Zhang Y, Xiao Y, et al. 2018. DiseaseEnhancer: a resource of human disease-associated enhancer catalog. Nucleic Acids Res. 46(D1):D78–D84. [DOI] [PMC free article] [PubMed] [Google Scholar]
Associated Data
This section collects any data citations, data availability statements, or supplementary materials included in this article.
Supplementary Materials
Data Availability Statement
All data underlying this article are available in the article and in its Supplementary Material online and in the provided github page (https://github.com/soojinyilab/Enhancer_Dataset_2020).