

Abstract
We present a scheme for correction of x-y-separable aberrations in optical coherence tomography (OCT) designed to work with phase unstable systems with no hardware modifications. Our approach, termed SHARP, is based on computational adaptive optics and numerical phase correction and follows from the fact that local phase stability is sufficient for the deconvolution of optical aberrations. We demonstrate its applicability in a raster-scan polygon-laser OCT system with strong phase-jitter noise, achieving successful refocusing at depths up to 4 times the Rayleigh range. We also present in vivo endoscopic and ex vivo anterior segment OCT data, showing significant enhancement of image quality, particularly when combining SHARP results with a resolution-preserving despeckling technique like TNode.
Optical coherence tomography (OCT) is an imaging modality susceptible to sample- and system-induced optical aberrations that degrade image quality and reduce the ability to resolve fine structures [1]. In most OCT systems, a lens is used to focus light onto the sample and to capture the backscattering; thus, optimal lateral resolution is only achieved within a limited depth of field (DoF) determined by the numerical aperture (NA) of the system. Outside of the DoF, defocus degrades resolution, and, in many applications, it is the most prominent aberration. To obtain high-resolution OCT images, aberrations can be corrected using hardware adaptive optics (AO) [1] or computational approaches [2,3]. AO compensates for wavefront aberrations in situ [1], increasing system complexity that limits adoption outside research applications, and yet not addressing the lateral-resolution–DoF trade-off. Computational approaches process the complex OCT signal using mathematical models based on the propagation of light. Interferometric synthetic aperture microscopy (ISAM) corrects defocus by solving an inverse scattering problem to provide focal resolution at an extended depth range [3]. Computational adaptive optics (CAO) compensates the wavefront of each en face plane by applying a phase filter defined from sub-apertures in the frequency domain [4], or from optimization by maximizing an image quality metric [5]. CAO can correct arbitrary aberrations, whereas ISAM accounts for defocus; however, ISAM uses a non-paraxial model necessary in high NA systems where CAO only partially works.
Requirements for CAO have so far included Nyquist sampling and volumetric phase stability, the latter being affected by phase noise arising from system and the sample [6,7]. Axial motion induces phase shifts that, in practical scenarios, only affect along the slow scan axis and are thus correctable in post-processing using existing one-dimensional (1D) numerical correction [8]. Separation of the pivot position of each galvanometer mirror and the back focal plane of the scan lens induces phase noise that affects all raster-scan OCT configurations [6], commonly used in commercial systems. Finally, most wavelength-swept source OCT (SS-OCT) systems—another common configuration—present strong phase instabilities caused by laser sweep fluctuations, and/or digitizer timing inaccuracies that produce depth-dependent phase noise that varies stochastically across A-lines [7], referred to as phase-jitter, resulting in two-dimensional (2D) phase unstable tomograms. Phase-jitter hinders CAO in absence of hardware mitigations [6], the most common being use of a k-clock, which requires an additional interferometer and a compatible digitizer. Correcting for phase-jitter in post-processing requires 2D phase correction, achievable only using hardware phase-reference signals: existing numerical corrections are 1D and have been shown to work only in systems with phase instability along a single axis [8]. There is no known generalization to 2D correction. For all these reasons, CAO in SS-OCT systems has been shown so far in specific configurations with volumetric phase stability, such as full-field systems [9], or k-clocked systems [4]. To the best of our knowledge, CAO has never been demonstrated in SS-OCT systems with 2D phase instability.
In this Letter, we present a novel CAO technique capable of correcting x-y–separable aberrations in OCT systems that have been so far unsuitable for CAO, even in absence of sample motion. Following the fact that only short-range phase stability—not full-volume phase stability—is required for CAO [6], we developed our technique SHort Aline-Range Phase-stability adaptive-optics (SHARP) that avoids the destruction of the orthogonal phase relation that occurs in attempts at 2D phase correction. SHARP integrates sequential 1D numerical phase and aberration correction steps and can operate in tomograms with phase noise arising from phase-jitter, galvanometer scanners, and sub-resolution sample axial bulk motion, as long as Nyquist sampling is fulfilled and not significant complex amplitude shifts due to strong motion are present. SHARP is suitable for OCT systems with no special phase reference signals nor specialized configurations that ensure phase stability along any scan axis. Although SHARP cannot correct arbitrary aberrations, correcting x-y-separable aberrations is sufficient for many applications. We show that SHARP can compensate defocus in tomograms acquired with 2D phase unstable SS-OCT systems exhibiting strong phase-jitter and can achieve in-plane refocusing of endoscopic phase unstable SS-OCT tomograms.
Traditional phase correction, brought from Doppler OCT, is intrinsically 1D [7], and fails when applied in 2D—along the fast axis x and the slow axis y—since successful correction is obtainable one axis at a time: subsequent correction along the second axis destroys the orthogonal phase relation. Correcting along x and then along y with global B-scan phase offsets—preserving intra–B-scan phase stability—is not possible either: the accumulation of long-range phase errors during the intra–B-scan correction frustrates the inter–B-scan correction using global phase offsets. SHARP is capable of correcting aberrations in x and y by performing two 1D steps as follows. First, phase-jitter is corrected along the x axis followed by a 1D aberration compensation in x. Then, phase-jitter correction in x is rolled back by applying the inverse correction to the 1D corrected tomogram. Secondly, phase-jitter is corrected along the y axis followed by a 1D aberration compensation in y, yielding a 2D computationally aberration-corrected volume. The rollback (RB) step is essential to remove the long-range phase errors introduced in the first correction that would frustrate the last step. Sequential 1D operations restrict the 2D aberrations that can be compensated to those that are separable into two 1D operations such as x-y astigmatism/coma, and defocus, the latter being the most significant in many OCT applications.
SHARP uses a simple 1D phase correction [8] based on the sample signal. With uz,x,y (or uzxy for simplicity) being the discrete—at least Nyquist sampled—counterpart to the complex OCT signal u(z, x, y), we consider the random phase offsets and slopes produced by all potential phase noise and jitter sources [7]. We perform an intensity-weighted linear fit of the phase differences between adjacent A-lines, and then apply the cumulative correction as . The same procedure is used to correct along y axis, with y being the variable of interest: we define the phase-correction operator as this procedure applied along an axis v (either x or y). As discussed, small errors in each Δzxy accumulate in the summation, resulting in long-range errors along the axis of interest; therefore, short-range rather than long-range phase stability is achievable, which is sufficient as CAO uses a deconvolution kernel that only mixes relatively local information in the spatial domain. It is evident that phase differences exceeding 2π are correctable by the corresponding measured phase modulo 2π in the range [−π, π] omitting additional cycles of 2π, which are inconsequential given uz,x,y = uz,x,y exp(i2πr), .
Hereafter, we consider low to moderate NA systems. Given the key role that phase correction plays in SHARP, we make use of a novel tool for its assessment. Defining FTv{·} as the Fourier transform (FT) along a coordinate v and as its inverse along the conjugate coordinate qv, we note that FTxy{u(z, x, y)}= H(z, qx , qy)S(z, qx , qy), where H is the effective generalized pupil of the optical system at depth z (resulting from the convolution of the illumination and detection generalized pupils), S is the frequency content of the sample, and (qx , qy) are the lateral spatial frequencies. For our NA regime, H does not have an axial frequency k dependence, and we assume its amplitude (but not its phase) is independent of depth; thus, H(z, qx , qy)=Ω(qx , qy) exp[iφ(z, qx , qy)], where Ω and φ are, respectively, the amplitude and phase of the electric field at the Fourier plane of the optical system. S is unknown in general, but is expected to resemble a random variable due to the complexity of biological samples, and therefore we assume its spectrum in (qx , qy) to be roughly flat. Thus, the mean power spectrum (MPS) in depth of uzxy is , where γ is the spectrally flat contribution from S after averaging Nz depths. Therefore, the shape of the MPS of the complex tomogram of a biological sample represents the effective beam intensity (illumination and detection paths convolved) at the Fourier plane of the optical system. Assuming Gaussian illumination, the MPS of a phase-stable tomogram must approximate a Gaussian function. Phase noise will distort the frequency content in FTxy{uzxy} by increasing high frequencies and, in completely phase unstable tomograms, will tend toward a flat spectrum. We postulate that, if resembles a Gaussian function after phase-jitter correction, long-range phase errors (which manifest as low-frequency distortions) will not disturb the CAO deconvolution. Thus, MPS analysis serves to verify Nyquist sampling and assess the quality of each phase correction step.
Defining the sample complex field s (z, x, y) and the impulse response function of the system , in absence of phase noise, an approximate sample complex field can be recovered, as long as Nyquist sampling is fulfilled, by a 2D deconvolution of u(z, x, y) with h(z, x, y) expressed as [5]. We define an approximation of the ideal H as . In SHARP, the x-y–separability condition implies allowing us to perform the deconvolution in two 1D steps,
| (1) |
where was defined before. In optimization-based CAO, the phase of is described in terms of basis functions Pi as , and the optimization finds the set of weights that maximizes an image quality metric [9]. In SHARP , with optimized first, then . We optimize Shannon’s entropy using MATLAB’s simplex algorithm and define Pi(qv) as 1D Legendre polynomials[10].
To avoid amplification of high-frequency noise, instead of a unity-valued amplitude, we apply the Wiener optimum filter (WOF) used in the restoration of astronomical images [11] , where is the Nyquist (or higher if available) frequency in axis qv.
We validated SHARP in experiments using a cucumis sativus sample, which displays prominent cellular walls with strong scattering, and low scattering large vacuoles. We used a raster-scan non-k-clocked SS-OCT system with a polygon-based wavelength-swept source affected by strong jitter from different sources: polygon facet-to-facet differences in sweep, frequency shifter with no phase locking, back focal plane of the lens positioned at the midpoint of the two galvo mirrors with no pivot point alignment. The repetition rate was 54 kHz, 120 nm 10 dB sweep range centered at 1310 nm, transverse e−2 beam diameter 2w0 = 22 μm (Thorlabs LSM03, USA) with a Rayleigh range zR = 290 μm in air. We acquired a reference dataset in which the focal plane is placed 0.6 mm below the sample surface, and an out of focus (OOF) tomogram with the focal plane shifted up by 0.9 mm (thus above the sample surface) in which we used SHARP. Each tomogram had 512 B-scans, 512 A-lines per B-scan, and a pixel pitch of 6 μm in air in z and x−y. We used Kx = Ky = 1, i.e., only defocus and x-y astigmatism. Figure 1 illustrates the steps of SHARP applied to the OOF tomogram. We present the raw unstable phase of a zx signal-rich (no holes) region of interest (ROI) in Fig. 1(a), and after in Fig. 1(b), a point in which the MPS along x shows a Gaussian shape [Fig. 1(e)]. After CAO along x (denoted SHARP-x), the zy plane remains unstable [Fig. 1(c)]. After the RB step , we applied to stabilize the phase along the y axis [Fig. 1(d)] obtaining a Gaussian MPS [Fig. 1(f)]. Without RB, the MPS is distorted [Fig. 1(f)]. Finally, CAO was applied along y. Figures 1(g)–1(k) show intensity en face views of the OOF tomogram, after 2D CAO [8], SHARP-x, SHARP without RB (showing degraded quality), and SHARP, respectively.
Fig. 1.
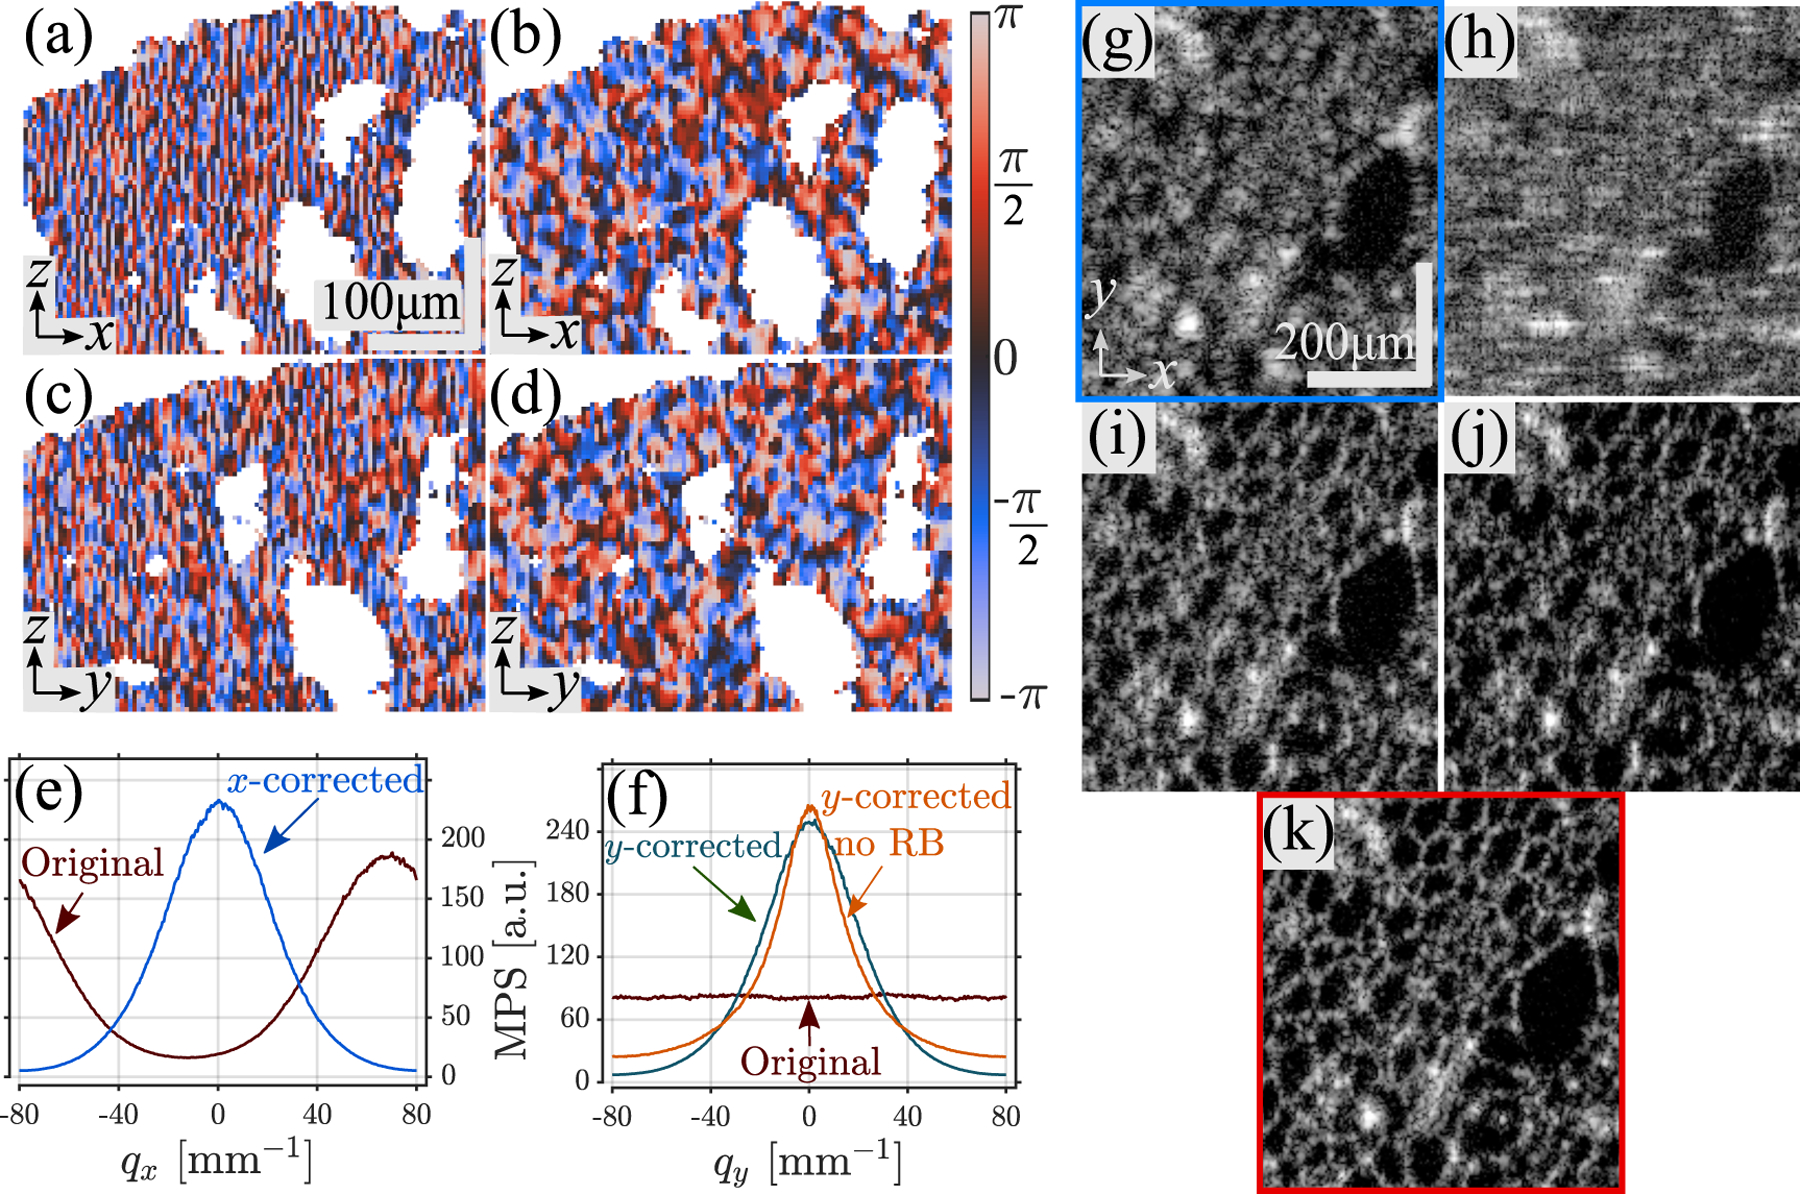
B-scan phase maps of cucumis sativus sample in a signal-rich ROI; (a) before, (b) after , and (e) corresponding MPS profiles. zy phase maps; (c) before, (d) after , and (f) corresponding MPS profiles with and without RB step. Intensity enface views: (g) original (blue box), (h) 2D CAO with slow axis phase correction [8], (i) SHARP-x, (j) SHARP without RB, and (k) SHARP (red box).
Figure 2 presents en face views at depths 2.9zR and 3.5zR from the focal plane of the OOF tomogram before and after SHARP, and insets of the corresponding in-focus reference tomogram. SHARP successfully restores the OOF tomogram despite the strong phase-jitter. Cell walls are significantly sharper compared to the OOF, approaching the in-focus counterparts. SHARP produced successful results up to 5zR (see Visualization 1). As the deconvolutional model only accounts for ballistic photons, we expect that far from the focal plane multiple scattering has a large sample-dependent contribution to the signal, which here frustrates CAO for z > 5zR.
Fig. 2.

En face views of cucumis sativus sample at 2.9zR = 0.8 mm [(a) and (b)] and 3.5zR = 1 mm [(c) and (d)]. (a), (c) Original OOF (blue insets) and (b), (d) SHARP (red insets).Yellow insets are from the reference tomogram; see Visualization 1 for a full comparison.
SHARP can perform 1D refocusing [using instead of in Eq. (1)] for defocus and/or astigmatism correction in endoscopic tomograms that do not satisfy requirements for 2D CAO since out-of-plane sampling is typically sub-Nyquist and prone to severe motion artifacts. We used SHARP-x (Kx = 4) in swine airway pullbacks acquired in vivo with a non-k-clocked catheter-based OCT system (NinePoint Medical Inc., Bedford, MA) with a 50 kHz polygon wavelength-swept source, 90 nm 10 dB bandwidth at 1310 nm, 2w0 = 40 μm, and zR = 1 mm in air. Figure 3 presents a B-scan ROI before and after SHARP-x. Although 1D-only correction is more limited, SHARP-x still provides an enhancement for z > zR. Debris in the mucus layer is brought into focus as seen in the insets, in which interpretation was improved by using the despeckling algorithm TNode, known to preserve resolution and improve image contrast [12]. Because blur should be dominated by x-defocus given the symmetry of luminal organs, SHARP-x can improve catheter-based imaging when there is no fixed probe-tissue working distance, such as in airway and intravascular imaging.
Fig. 3.

B-scan view of in vivo swine airway. (a) Original and (b) SHARP-x. Lines denote focal plane (FP) and the Rayleigh range (zR), respectively. For a detailed comparison, see Visualization 2.
We also used SHARP in anterior segment imaging of an excised swine eye with a similarly configured system to that used in Fig. 1 but with a 102 kHz repetition rate. We acquired a reference tomogram with the focal plane located at the paracentral zone, and an OOF tomogram with the focal plane located at the iris. Figure 4(a) shows an OOF B-scan where defocus is evident in all the corneal layers and structures inside the stroma. Due to confocal gating, there is a drop in signal-to-noise ratio (SNR) due to the large offset from the focal plane. We show in Fig. 4(b) that using the WOF alone (no phase filter) is very effective at reducing noise—due to low SNR—which improves overall contrast, but does not reduce blur as opposed to Fig. 4(c) that shows that after SHARP structures appear both sharper and with better contrast. We used Kx = Ky = 4 and set equal to due to poor optimization of as structures with near-y-axis symmetry dominate the ROI. Figures 4(g)–4(o) show three different TNode en face views of the OOF, SHARP, and reference tomograms at three depths indicated by lines in Figs. 4(d)–4(f). The dynamic range of each en face view was adjusted to equalize the contrast for visual comparison. Blurring increases toward the apex in the OOF views in Figs. 4(g)–4(i). In contrast, SHARP views [Figs. 4(j)–4(l)] have perceptually very similar resolution at all depths, enabling improved visualization of structures inside the stroma and clearer boundaries of the corneal epithelium, resembling reference images in Figs. 4(m)–4(o). These results show that SHARP could enable the examination of the iris and the full cornea in a single-shot acquisition with higher lateral resolution than currently possible without regard to phase noise, facilitating the accurate determination of parameters of clinical interest such as the stromal demarcation line and tissue layer thicknesses with existing OCT systems. See Visualization 3 and Visualization 4 for comparisons of all volumes.
Fig. 4.

Anterior segment of excised swine eye. Small ROI B-scans: (a) original, (b) WOF, and (c) SHARP. Full ROI B-scans after TNode: (d) original, (e) SHARP, and (f) reference [FP, focal plane; in (a)–(e), FP is in iris, out of image range]. En face at depths zi marked with lines in the B-scans: (g)–(i) original (blue boxes), (j)–(l) SHARP (red boxes), and (m)–(o) reference (yellow boxes). Each en face image shows its dynamic range.
In conclusion, we presented SHARP, a CAO technique for x-y–separable aberrations and for extending the DoF in phase unstable OCT systems. SHARP integrates phase correction with aberration compensation in two 1D steps and is compatible with most OCT systems with no hardware modifications. We have shown computational refocusing up to 5zR in a polygon-laser system affected by strong phase-jitter, demonstrating the potential to reduce the lateral-resolution–DoF trade-off in common OCT systems. SHARP enabled image quality enhancement in vivo and ex vivo in endoscopic and anterior segment imaging. SHARP in combination with TNode despeckling yield significant image quality improvement in anterior segment imaging. We implemented SHARP in MATLAB, available in Code 1, Ref. [10].
Supplementary Material
Funding.
National Institutes of Health (K25 EB024595, P41 EB015903); Universidad EAFIT (881-000010).
Footnotes
Disclosures. The authors declare no conflict of interest.
REFERENCES
- 1.Pircher M and Zawadzki RJ, Expert Rev. Ophthalmol 2, 1019 (2007). [Google Scholar]
- 2.Yasuno Y, Sugisaka J-I, Sando Y, Nakamura Y, Makita S, Itoh M, and Yatagai T, Opt. Express 14, 1006 (2006). [DOI] [PubMed] [Google Scholar]
- 3.Ralston TS, Marks DL, Carney PS, and Boppart SA, J. Opt. Soc. Am. A 23, 1027 (2006). [DOI] [PubMed] [Google Scholar]
- 4.Kumar A, Wurster LM, Salas M, Ginner L, Drexler W, and Leitgeb RA, Biomed. Opt. Express 8, 3369 (2017). [DOI] [PMC free article] [PubMed] [Google Scholar]
- 5.Adie SG, Graf BW, Ahmad A, Carney PS, and Boppart SA, Proc. Natl. Acad. Sci. USA 109, 7175 (2012). [DOI] [PMC free article] [PubMed] [Google Scholar]
- 6.Shemonski ND, Adie SG, Liu Y-Z, South FA, Carney PS, and Boppart SA, Opt. Express 22, 19183 (2014). [DOI] [PMC free article] [PubMed] [Google Scholar]
- 7.Vakoc BJ, Yun SH, de Boer JF, Tearney GJ, and Bouma BE, Opt. Express 13, 5483 (2005). [DOI] [PMC free article] [PubMed] [Google Scholar]
- 8.Shemonski ND, Ahn SS, Liu Y-Z, South FA, Carney PS, and Boppart SA, Biomed. Opt. Express 5, 4131 (2014). [DOI] [PMC free article] [PubMed] [Google Scholar]
- 9.Hillmann D, Spahr H, Hain C, Sudkamp H, Franke G, Pfäffle C, Winter C, and Hüttmann G, Sci. Rep 6, 35209 (2016). [DOI] [PMC free article] [PubMed] [Google Scholar]
- 10.Ruiz-Lopera S, Restrepo R, Cuartas-Vélez C, Bouma BE, and Uribe-Patarroyo N, “SHARP: Short aline-range phasestability adaptive optics,” Figshare, 2020, 10.6084/m9.figshare.12585530. [DOI] [PMC free article] [PubMed] [Google Scholar]
- 11.Brault JW and White OR, Astron. Astrophys 13, 169 (1971). [Google Scholar]
- 12.Cuartas-Vélez C, Restrepo R, Bouma BE, and Uribe-Patarroyo N, Biomed. Opt. Express 9, 3354 (2018). [DOI] [PMC free article] [PubMed] [Google Scholar]
Associated Data
This section collects any data citations, data availability statements, or supplementary materials included in this article.