

Abstract
Optical refractometry techniques enable realization of both pressure and temperature directly from properties of the gas. The NIST refractometer, a fixed length optical cavity (FLOC) has previously been evaluated for operation as pressure standard, and now in this paper, is evaluated for the feasibility of operation as a primary temperature standard as well. The challenge is that during operation, one cavity is filled with gas. Gas dynamics predicts that this will result in heating which in turn will affect the cavity temperature uniformity, impeding the ability to measure the gas temperature with sufficient accuracy to make the standard useful as a primary standard for temperature or pressure. Temperature uniformity across the refractometer must be less than 0.5 mK for measurements of the refractivity to be sufficiently accurate for the FLOC. This paper compares computer modeling to laboratory measurements, enabling us to validate the model to predict thermal behavior and to accurately determine the measurement uncertainty of the technique. The results presented in this paper show that temperature of the glass elements of the refractometer and ‘thermal-shell’ copper chamber are equivalent to within 0.5 mK after an equilibration time of 3000 s (when going from 1 kPa to 100 kPa). This finding enables measurements of the copper chamber to determine the gas temperature to within an uncertainty (k = 1) of 0.5 mK. Additionally, the NIST refractometer is evaluated for feasibility of operation as temperature standard.
Keywords: pressure, temperature, standard, FLOC, refractive index, thermal, quantum-based standards
1. Introduction
The foundation of the some of the most accurate and precise primary realizations of pressure and temperature have their roots in the relationship between the polarizability of atoms or molecules of a gas and its refractive index, which can be used to measure density. These approaches have garnered global interest because traceability can be achieved through quantum chemical properties of the helium atom, thus a quantum traceability to the SI. Optical interferometric techniques for measuring gas density based on refractive index are advancing the field of pressure metrology [1–8]. The methodology has gained acceptance globally because of the demonstrated an expanded uncertainty (k = 2) less than 9 μPa Pa−1 at atmospheric pressure [4]. The approach is a primary realization of the pascal when using helium, where the refractive index is known to 0.1 parts in 10−6 accuracy from quantum chemistry calculations [9]. The quantum-based optical technique is now approaching the lowest uncertainty primary pressure standards [10, 11].
For traceability to the kelvin, refractive index gas thermometry (RIGT) [12] and dielectric gas constant thermometry (DGCT) [13] have realized thermodynamic temperature with uncertainties of 9 μK K−1 and 2.5 μK K−1, respectively. These uncertainties are comparable to acoustic gas thermometry [14], Johnson noise thermometry [15], and doppler broadening thermometry [16], that achieve uncertainties near 1 μK K−1, 5 μK K−1, and 24 μK K−1, respectively, using different properties to achieve quantum traceability. Recent optical experiments for the determination of the Boltzmann constant [17] have proven the technique can achieve an uncertainty of 12 μK K−1. In this paper we demonstrate our dual Fabry–Perot fixed length optical cavity (FLOC) as an optical technique for measuring temperature as a refractive index gas thermometer.
Approaches that utilize measurements of refractive index have gained momentum because primary realization is possible when using helium gas. The theory connecting refractive index to density has been around for over 100 years, from the well-known Lorentz–Lorenz equation,
| (1) |
where n is the refractive index of the gas, AR, BR, CR are constants representing the refractivity virial coefficients, and ρ is the mass density. The main difference between microwave RIGT and DGCT versus the optical RIGT is in the virial refractivity coefficient, AR. This term consists of a static and dynamic terms of the molar polarizability. The first term is static term and the dynamic terms are functions of frequency. RIGT and DGCT only require the static component [9]. Where the refractivity virial coefficients are known, the number density can be determined from a measurement of the refractive index, and pressure of a gas can be determined from
| (2) |
where P is the pressure, is the number density,kB is Boltzmann constant, T is the thermodynamic temperature, and Bρ, Cρ are the density virial coefficients. This equation shows that gas temperature and pressure are directly related to number density. Pressure can be determined if thermodynamic temperature is measured using a traceable thermometer. A thermometer with calibration to the international temperature scale 1990 (ITS-90) can be used by correcting to thermodynamic temperature using the accepted offsets (T–T90) [18]. Alternatively, if pressure is known equation (2) can be used to show that number density can be used to measure temperature. With the pressure measured using a primary piston gauge or other standard, and if number density of the gas is known from an optical measurement or quantum calculations, direct traceability to the international unit of kelvin can be achieved.
2. Optical thermometer design
TheFLOC [1, 3, 4] was designed to achieve a temperature stability of better than 0.5 mK. While this target is relatively straightforward in a static environment the FLOC needs to be evaluated under pressurization and flow of the gas molecules that occurs in a typical calibration system. The FLOC consists of a set of two Fabry–Perot optical cavities on a spacer made of ultra-low expansion glass (ULE) to limit errors caused by variations in length due to thermal effects. The spacer has a hole drilled through the lower section to create a reference cavity (vacuum) and an upper cavity consisting of a slot to allow gas to easily flow in and out (figures 1 and 2). The glass cavity is placed inside a chamber which allows for gas to be pumped out and pressures to be changed. Because the determination of temperature is primarily dependent on density (via refractivity) and pressure, we can define the FLOC as a primary realization of temperature for a gas of known refractivity. Similarly, if the temperature is measured using a calibrated high accuracy standard platinum resistance thermometer (SPRT) the pressure can be measured and is directly traceable to the international unit of pascal.
Figure 1.
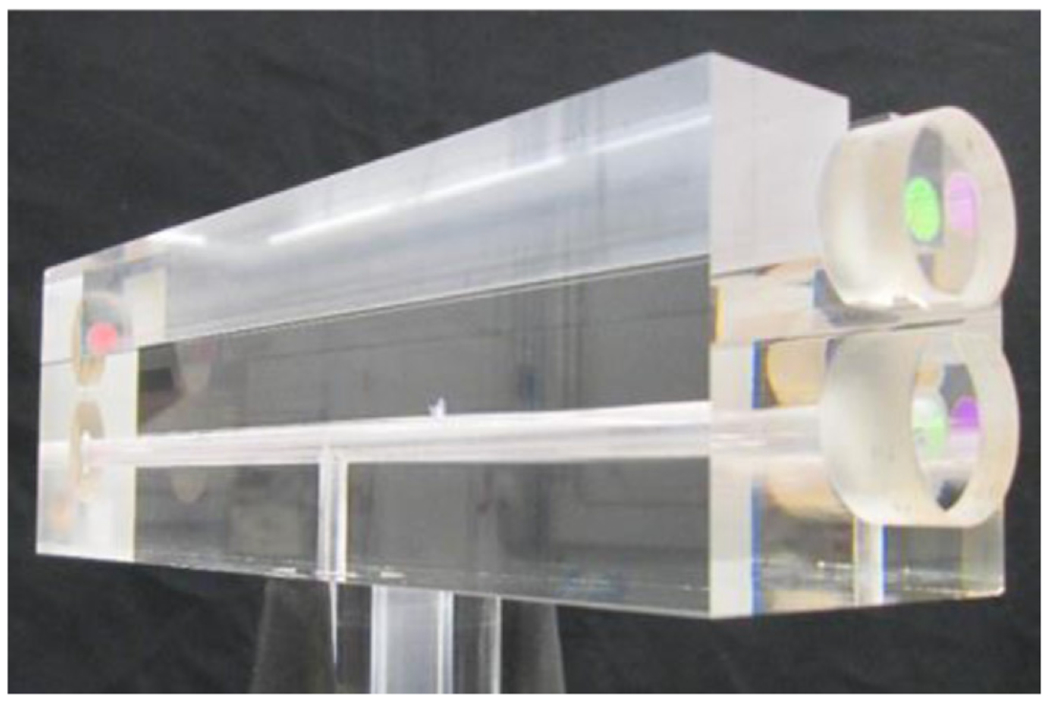
FLOC prototype showing glass cell and laser mirrors that form Fabry–Perot Cavity.
Figure 2.

FLOC laser cavities. Upper cavity is allowed to interact with gas molecules (represented with dots) and the lower cavity is at vacuum (<1 mPa).
Temperature can be determined from an FLOC via measurement of the optical interference frequency between the reference (vacuum) cavity and the gas (measurement) cavity. The measurement is dependent on the refractivity virial coefficients (AR, BR, CR), density virial coefficients (Bρ, Cρ), pressure (P), Boltzmann constant (kB), and FLOC cavity characteristics which include the free spectral range (FSR), optical mirror coating dispersion (εα), reference cavity frequency (fRf). Equations (1) and (2) are combined using series expansion to form the following equations:
| (3) |
where
| (4) |
| (5) |
| (6) |
| (7) |
fBi, fBf represents the measured initial and final frequency, respectively, of the optical interference frequency between the measurement cavity and reference cavity and c4 and c5 are measured values that account for the bulk distortion due to compression and mirror distortion due to compression, respectively. Bρ has a small temperature dependence that can be solved through iterative processing.
An FLOC traceability to the kelvin comes from using a gas of known refractive index (determined from quantum chemistry calculations or from independent measurements) and the equation of state when a known or fixed pressure is applied from an independent pressure standard. Helium is the best gas due to its direct link via quantum calculations [9], however helium gas has lower sensitivity to temperature change, larger uncertainty due to impurities/outgassing, and is subject to systematic uncertainties due to its ability to absorb into the glass cell [19]. The optical RIGT was tested using nitrogen with the pressure applied using a piston gauge which can generate a pressure with a stability better than 1 μPa Pa−1 at atmospheric pressure and can measure pressure to better than 5 μPa Pa−1 [20]. In order to account for any thermal expansion of the glass, the FLOC must be pumped out to vacuum (<1 mPa) to measure the initial frequency (fBi) which is subtracted from all frequency measurements at pressure. Therefore, operating the FLOC as a temperature or pressure standard will require the internal gas pressure changes over a range from vacuum (10−3 Pa) to atmospheric pressure (105 Pa).
3. Temperature effects of pressurization
When adding gas to increase the pressure of a system, thermodynamic work is done which causes gas molecules to become hot and transmit that heat to the walls of the chamber and into the glass. The NIST FLOC system was designed to accommodate corresponding temperature changes and remove excess heat while retaining the primary goal of isolation from thermal noise due to environmental effects. The chamber was designed minimize internal volume (172 cm3) which reduces the total heat flux and to provide thermal conductivity so there will be no gradients between the glass/copper/gas while still providing thermal isolation from the environment. To accomplish this, the glass cavity was designed to be within 1 mm of the copper walls on the sides, top, and bottom (avoiding actual mechanical contact with the copper that might cause temperature-dependentdistortions of the optical cavities). This has the benefit of reducing the overall volume of gas in the system and increasing the heat transmission between the glass and copper.
The chamber, shown in figure 3, is constructed of oxygen-free high thermal conductivity copper. The use of copper for the chamber has the benefit of a large heat capacity so that added heat will have a smaller overall temperature change. The glass (shown in gray) is mounted via viton7 o-ring, but does not touch the copper in any location. The temperature is kept constant by a heated aluminum box/shell (not shown) which surrounds the chamber and is controlled to within 0.001 K of the setpoint. An gap between the aluminum shell and the copper chamber (filled with atmospheric air) provides isolation from thermal variations which improves thermal stability of the copper chamber, however the air conducts enough heat to equilibrate the chamber temperature to the setpoint. Similarly, the gap between the glass and copper (which is filled with the measurement gas) provides additional thermal insulation, further improving thermal stability of the glass. The thermal conductivity of the aluminum and copper ensures minimal thermal gradients. A foam insulation layer (not shown) prevents temperature fluctuations of the surrounding environment to affect the outer chamber. SPRTs placed in the system were monitored over 100 h at a setpoint of 302.920 K while the system was at vacuum. The temperature of the aluminum shell was stable to within 1 mK (k = 1), which allowed for 0.1 mK stability of the copper chamber, and less than 0.05 mK stability of the glass (figure 4).
Figure 3.

A cutaway view of the FLOC thermal chamber design. Thin film PRTs are mounted in the locations indicated via dots (#1 on left, and #2 on right). An SPRT is mounted into the wall of the copper chamber near the center of the glass cavity.
Figure 4.

Thermal stability of the FLOC and chamber.
Pressurization of the FLOC chamber has two effects that we must consider: temperature gradients in the system and overall temperature rise. An ideal gas approximation of the first order adiabatic compression of adding gas to the system can be used to estimate the temperature rise of the system. This calculation is outlined in appendix A. For a pressurization from 1 kPa to 100 kPa the gas temperature changes by 120 K. This indicates that during a pressurization, in short time scales large gradients will exist in the system and can cause significant drift in refractivity measurements. However, the heat quickly transfers to the glass and copper and some heat will leave the system, so overall temperature rise in our system should be less than 3.4 mK.
4. Finite element modeling of thermal effects
To more accurately determine the temperature gradients along with equalization and stabilization time, the system was analyzed using 3D computer modeling software. For this project we used Solidworks7 to construct the geometry and comsol multiphysics7 to analyze the thermal effects. The goal was to understand when the system would reach equilibrium after adding gas.
Because of the small temperature changes and high accuracy required, it is very critical to correctly define the boundary conditions. The aluminum outer chamber is kept at a constant 302.920 K (±0.001) making it a stable boundary. Therefore, the model includes the glass optical cell, measurement gas (N2), copper chamber, stainless and aluminum fittings, and the air inside the thermal chamber (shell). Immediately prior to entering the chamber the gas enters through a heat exchanger at 302.920 K. Because of this, the larger volume of gas in the tubing and valves which may cause the gas to heat up (or cool down due to nozzle effects) is negligible and is excluded from the models. As with any computer model, assumptions needed to be made about the materials and interfaces used. The model assumes ideal thermal contact of materials (no gaps between mating surfaces) and that materials have uniform thermal conductivity. Conductivities were assigned to be standard values provided by material vendors. To simplify the system, the dynamic fluid calculations for air are ignored. This assumption is reasonable because convective gas movement due to millikelvin temperature differences are negligible for low Rayleigh number (Ra < 1). Therefore, for this analysis we approximate air as solid with very low density and all convection is ignored.
The gas flow into the measurement cavity was set to be 0.16 Pa m3 s−1 of 100% nitrogen taking 100 s to fill from 1 kPa to 100 kPa. This equates to 17.3 J of total energy input for our volume [appendix A], or a constant input (step function) of 0.173 W over the 100 s fill. Pressurization below 1 kPa has very little temperature effects (less than 0.2 J of total energy) and because the mean free path is large the molecules equilibrate with the wall within a few seconds. The results, shown in figure 5, illustrate how the residual heat of the gas moves through the system. The four snapshots show the progression at 600 s, 1200 s, 2400 s, and 3600 s after the gas fill is started. The ends of the cavity feature the largest volume due to the required clearance for optical mirrors and windows. The localized heating shown in figure 5 is a combined effect of additional heat due to the larger volume and an increased distance between the glass and copper which slows heat transmission from the ends of the cavity. This results in the cavity ends retaining heat longer and the glass cavity having a >5 mK difference after 600 s. In contrast, the high thermal conductance and thermal mass of the copper prevents spatial gradients and consequently shows an overall difference of less than 2.5 mK. The heat slowly conducts from the glass to the copper through the sides which are located within 1 mm of the copper. From there the heat transmits through the surrounding environment to the walls of the aluminum chamber. By 2400 s, the glass temperature is just slightly elevated from the copper and by 3600 s the temperatures are equivalent.
Figure 5.

Thermal model of pressure cell at 600, 1200, 2400, 3600 s after start of gas fill.
By placing evaluation points on the model at the locations where PRTs are mounted on the actual FLOC, we can quantitatively determine differences between the model and measured data. Figures 6 and 7 show the temperature vs time plots of the simulated SPRT temperatures. Figure 6 shows the difference between the copper chamber temperature and the temperature of the TFPRTs mounted on the glass cell. Figure 7 shows the change in copper temperature relative to 302.920 K. The model simulated the first 50 ks after temperature fill to determine the time required for the copper temperature to return to the initial temperature of 302.920 K. The plot of the copper/glass gradient show that by 2900 s the temperatures are equivalent within our threshold of 0.5 mK. The absolute temperature shows that the copper temperature peaks at 302.9224 K and slowly decays over the following 14 h back to the setpoint. This can be estimated with an exponential decay with a time constant of 2.8 h.
Figure 6.

Simulated gradient between glass and copper from two locations analogous to the PRTs. The inset graph shows data below 5 mK.
Figure 7.

Simulated change in temperature of the copper chamber over time. The temperature is relative to 302.92 K of the aluminum shell.
To solve the simulation, the 3D model was meshed (divided) into 505 000 components. A temporal resolution of 10 s was used, for a total of 5,000 steps. The solutions were run with several solvers, with the direct heat transfer PARDISO solver producing the results shown here. The model was run and then re-run with a different mesh size and temporal size to verify mesh independent results. The final simulation ran on a quad core 3.5 GHz processor with 16 Gbytes of RAM for just over 55 h for the highest resolution models.
5. Comparison to physical measurements of temperature
To compare the theoretical temperature effects to measurable changes in the system, two sensors were installed on the glass cavity. The small space available and accuracy needed dictated that thin film PRTs (TFPRTs) were used. The TFPRTs were adhered inside the channel of the slot cavity in the locations indicated in figure 3 by the dots on left and right of the glass. Additionally, a calibrated rosemount7 162D capsule PRT was inserted into the wall of the copper chamber.
The TFPRTs and SPRT were read with a microK precision thermometry bridge7 which compares thermometer resistance to a calibrated standard resistor. A channel expander was used to ensure continuous power to the PRTs and prevent instability due to self-heating which was measured at 0.0068 mA μW−1 for the SPRT and 0.76 and 0.32 mA μW−1 for the TFPRT. The bridge averaged data for (15–20) s per channel and therefore each thermometer was read approximately once per minute. Capsule SPRTs are not ideal for dynamic measurements. They consist of a platinum wire contained in a steel sheath (filled with helium), which provides mechanical isolation but limits the ability to measure transient thermal peaks (dynamic). Thin film PRTs have faster response times for dynamic measurements because they contain no helium isolation and have lower mass, however they are usually less stable in the long term. Since we are only concerned with the change in temperature, the TFPRTs were compared to the 162D at a stable temperature with 1 kPa of gas inside the chamber (T0 = TTFPRT – TSPRT). The system was then pressurized to 100 kPa. The pressurization was done using a fill of less than 100 s to complete. The value of T0 is subtracted from all other measurements to eliminate long term drift of the TFPRTs (Tdifference = TTFPRT – TSPRT – T0). This value is equivalent to the difference from the glass temperature to the copper, or the maximum possible variations in gas temperature within the FLOC. Temperature data was collected over 14 h following the pressurization. Figure 8 shows the difference between TFPRTs (PRT1 and PRT2) and the copper temperature. Due to dimensional (clearance for laser beam path) and purity constraints (outgassing of electrical components), the TFPRTs must be removed prior to making refractivity measurements. This means the beat frequency cannot be measured when measuring temperature of the glass. Therefore the goal of this project is to determine time constants for when the gas and glass temperature are uniform with the copper temperature to an uncertainty (k = 1) of 0.5 mK so refractivity measurements can be made.
Figure 8.

Measurement data illustrating the gradient between glass and copper reference temperature from two PRT locations. The inset graph is a zoom of data below 5 mK.
The results, shown in figure 8, clearly display a sharp rise in temperature due to gas pressure increase, peaking at 170 mK gradient on TFPRT #1 and 90 mK on TFPRT #2. The slight difference between peak temperature and location (spatial gradient in glass cavity) is either due to the non-symmetric chamber design or from the delay between reading of the TFPRTs. However, after a few 100 s the TFPRTs no longer show the spatial gradient but retain a gradient (relative to the 162D SPRT) between the glass and copper of 20 mK. The gradient slowly decays and reaches within 0.5 mK after 3100 s. Figure 9 displays the measurements of the 162D over the course of 14 h after filling with gas overlaid with the results from the thermal modeling. The data shows a slightly faster exponential decay with a time constant of 2.5 h. It is evident that the heat added to the system takes several hours to dissipate, allowing the copper chamber to return to its original temperature. However, it is not critical for operation that the chamber temperature return to the exact original setpoint. Measurement can be made given gradients between glass and copper are less than the threshold of 0.5 mK. At this gradient the contribution to the relative uncertainty (k = 1) on a pressure standard is less than 1.7 μPa Pa−1.
Figure 9.

Change in temperature of the copper chamber over time.
The time required for this equalization is fixed by the geometry and materials of the device, so this value can be used as the equalization time for all future pressurizations without continuous monitoring of PRTs. However, the equalization time depends on the pressure change of the system and the time constant of the cell. At long time intervals (hundreds of seconds after fill) this time constant is limited by the thermal conductivity of the gas, which is significantly slower than that of the other materials in the FLOC. Therefore, we can assume the time constant after a few 100 s is a constant at all pressures (changes in thermal conductivity of the gas in the range of (1–100)kPa are small). The time constant was determined to be approximately 600 s from the modeling data and the physical results (evaluated from 1000 s to 3000 s). However, there is another time constant of the decay of copper chamber temperature as it drifts back to the set point of 302.92 K. The combined effect of these two processes can be seen when the temperature difference approaches 0.5 mK and the difference between the glass and copper flattens out to a more linear decay, as seen in figure 8 between 3000 and 4000 s. Due to this effect, pressurizations above 20 kPa (where the copper temperature change is significant) require additional wait time to ensure the difference is within the threshold. For our system, 600 s was determined to be sufficient to ensure temperature stabilization is within our requirements.
The total energy input during pressurization in the system is linear with pressure and directly impacts the maximum glass temperature. We can estimate the glass temperature by dividing the total energy by the thermal capacity of the glass. This assumption gives an overestimation because some energy will go directly to the chamber walls. However, using this approximation we know proceeding a 10 kPa pressure change that the average glass temperature should rise less than 2.3 mK and therefore we can calculate a wait time of 1.5 time constants (900 s) can be used. Using this technique, we can estimate 4.8 time constants (2900 s) for a 100 kPa pressurization to reach a differential temperature of 0.5 mK which aligns with the data seen in figures 6 and 8.
The system performs similarly when reducing the pressure, except that the gas will cool as the pressure decreases. However, it should be noted that when pumping out the system to vacuum it is possible to insulate the glass from the copper creating a heat island effect. It is important to note that the thermal conductivity drops by a factor of two between 100 Pa and 10 Pa and will approach zero as the pressure decreases. To ensure no gradients exist, our system is kept at 100 Pa till the copper temperature stabilizes to within 0.1 mK of the setpoint. Pumping out from 100 Pa to vacuum has less than a 0.1 mK temperature change and is therefore negligible. The pressurization tests (and the simulation was designed to match) were initiated from 1 kPa instead of vacuum to ensure uniform temperature across the device.
When operating the FLOC as a pressure standard, absolute temperature must be determined using an SPRT and has the following sources of uncertainty: propagated uncertainty of the ITS-90 calibration, measurement of the resistance ratio, stability and uncertainty of reference resistors, and drift of the SPRT resistance. The propagated uncertainty (k = 1) of a NIST ITS-90 calibration between the water triple point and the gallium point is ±0.035 mK. The FLOC requires absolute thermodynamic temperature, so a correction term of 4.38 mK ± 0.4 mK must be applied to the ITS-90 calibration performed between triple points [18]. The uncertainty of the calibration therefore is ±0.4 mK. A thermometry bridge is used to determine the resistance ratio and has an uncertainty of ±0.125 mK for measurements approaching unity. The stability and uncertainty (k = 1) of the reference resistor was less than 5 × 10⁻⁶ Ω or approximately ±0.05 mK uncertainty when measuring a 25 Ω SPRT (sensitivity: 10 mK mΩ−1). The drift uncertainty of the SPRT was determined by repeat calibrations. Over a two-year interval the SPRT drifted by 0.2 mK at 302.92 K. We assign this as a typical two-year drift uncertainty with a 2/3 probability that future drift will be similar scale and therefore, we can use an uncertainty of ±0.1 mK/year (k = 1). Combining these uncertainties, we can estimate an uncertainty for the 25 Ω SPRT as u (k = 1) = ±0.43 mK. This uncertainty is used when operating the FLOC as a pressure standard. The 1 kΩ TFPRTs used in the thermal testing were utilized to determine changes in temperature and therefore we have no need to evaluate the absolute uncertainty of these devices. For differential measurements we only care about short term drift and linearity. The short-term drift over a few hours was estimated to be less than 0.5 mK and linearity error was less than 0.1 mK. The combined uncertainty of the 1 kΩ PRTs are u (k = 1) = ±0.51 mK.
6. FLOC temperature measurements
In order to evaluate the sensitivity of the FLOC measurement to changes in operating temperature the FLOC temperature was set to four different setpoints and a Fluke7 9600 series piston gauge was used to control the pressure at 100.014 kPa. The relative frequency change was then recorded and plotted in figure 10. Measurements were taken over several days in random order to eliminate hysteresis effects. The FLOC was pumped out to 100 Pa while the temperature was changed. Once temperature was stable to 0.1 mK, the FLOC was pumped below 0.1 mPa and the zero frequency was recorded. The FLOC was then pressurized to 100 kPa and allowed to thermally equalize for over 100 min. The frequencies were then recorded and compared with the frequency at 302.920 K. The frequency shifted linearly by 396.2 MHz K−1. The theoretical sensitivity of the FLOC laser frequency measurement is on the order of 100 Hz (equivalent to 0.25 μK, however the pressure stability of the piston gauge at 100 kPa causes drift of around 0.2 MHz, so the theoretical resolution limit of this technique is 0.5 mK.
Figure 10.
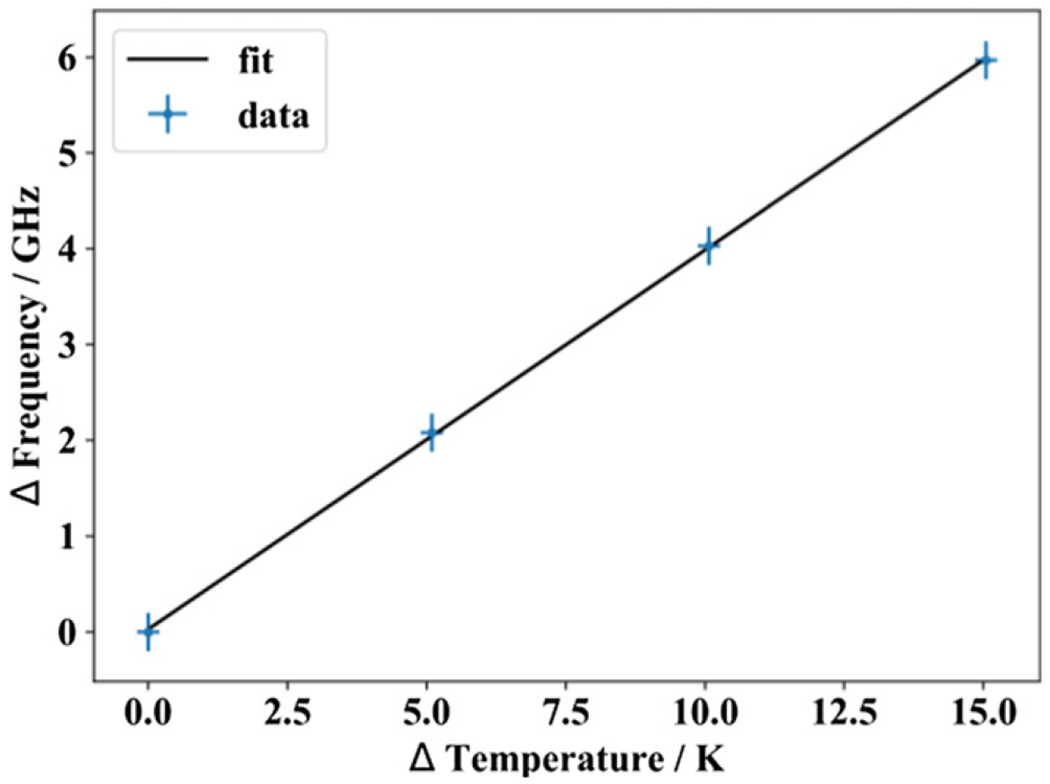
Linear frequency change from reference vs temperature.
A primary FLOC thermometer would need to utilize helium, however a portable transfer standard using this technology could be envisioned operating using a gas such as nitrogen. Nitrogen is simpler to use in an FLOC and would still provide a device that would never need recalibration. The data shown in figure 10 was collected using nitrogen gas, however nitrogen refractivity must be used to calculate absolute temperature. The frequency measurements of this refractometer along with the SPRT and pressure standard combination were used to determine refractivity and therefore a comparison of absolute temperature would be circular. Several ongoing projects are underway around the world to measure nitrogen gas refractivity independently. Table 1 shows a sample uncertainty of a refractometer transfer standard using this method which is dominated by refractive index measurements (7.5 μK K−1), pressure standard uncertainty (5.0 μK K−1), and the density virial coefficients (3.7 μK K−1). Nitrogen gas with a purity of 99.9999% would be needed and when combined with estimates of chamber outgassing would have minimal impact on temperature uncertainty. The compression of the FLOC glass is measured and contributes a small overall uncertainty. Thermal expansion of the glass causes minimal error because any length change of the glass is subtracted by using the zero-frequency measurement at that temperature.
Table 1.
Relative and Absolute Standard Uncertainty (k = 2) for optical thermometer measurement.
| Parameter | Contribution( u × 106 ) | Contribution (mK) |
|---|---|---|
| Gas refractivity | 7.5 | 2.27 |
| Density virial | 3.7 | 1.11 |
| Gas impurity | 0.5 | 0.15 |
| FLOC compression | 0.1 | 0.03 |
| Thermal gradients | 1.7 | 0.5 |
| Pressure standard | 5.0 | 1.52 |
| Combined uncertainty: | 9.9 | 3.0 |
An expanded uncertainty of 3 mK is achievable and provides enough accuracy to calibrate many types of thermometers. This accuracy could be improved if using helium gas which has a lower refractivity uncertainty (around 0.1 parts in 106), however helium does have some disadvantages. Notably the estimated frequency shift per temperature change is 20 times smaller (18.8 MHz K−1), however the pressure instability will also cause less frequency change. Helium absorption may cause some issues, but these can be corrected and should be a small source of uncertainty. An FLOC with uncertainty around 1 mK is feasible. The FLOC can provide SI traceability through gas refractivity and will never require recalibration.
7. Discussion
The FLOC can measure temperature with reasonable accuracy and traceability through the refractive index, however there are still many aspects that need to be evaluated. Most notably is the temperature range of the device. The mechanical properties of the glass were assumed to be constant over the small temperature range, however as the temperature increases it is unlikely that the FLOC compression constants c4 and c5 are constant. High temperatures (above ~600 K) can also damage mirror coatings, so the upper limit may depend on mirror selection. The FLOC can be reduced in size which may have some benefits at the cost of measurement sensitivity.
Overall, the 3D computer model shows a reasonable approximation of the flow of heat through the system and can be used to predict behavior of future FLOC designs for temperature or pressure standards. The analysis of the gas compression showed the computer model agreed with the physical data to within an acceptable margin. This data verifies the assumptions and boundary conditions of the computer model, notably that the mating surfaces have good interaction with low thermal resistance, that the inner wall of the thermal chamber can be set at a constant temperature boundary, that the heat generated by gas compression can be applied as a uniform constant energy step function, and that the thermal convection can be ignored. Additionally, we have confirmed that the standard material properties can be used. The verified model allows for future computer design of new FLOCs with improved performance (equilibrium time and temperature rise) and to evaluate new features such as a gas pre-cooling system or minimizing the volume near the ends of the cavity to limit temperature increase.
Some notable differences between the model and physical data include peak temperatures. The maximum peak temperature on the glass was 23 mK from the computer model vs the measured values of 170 mK and 90 mK. The higher temperature of the measured values is most likely due to the TFPRTs not being in perfect thermal contact with the bulk of the ULE Glass. The small TFPRTs heat up from contact with hot gas molecules, however the mounting of the PRT may present a small resistance to heat transfer. The time constant of this effect would be significantly less than the system equalization time so differences in modeling of the peak temperature are not critical to determining equilibration time. Additionally, the manual control method in which the gas flowed into the system, which used a valve that was slowly opened vs the constant 0.16 Pa m3 s−1, may have impacted the peak temperatures. The TFPRTs were taken (15–20) s apart due to bridge integration time, however as seen in figure 8, the two measurements of PRT1 bracketing the PRT2’s peak value are at least 1.5 times larger than the peak PRT2 measurement. This indicates that some spatial gradients exist across the glass cavity. The transient flow of gas was not modeled to reduce the complexity, however, the 1 mm gap between the gas and walls will create a flow restriction which may account for higher temperatures on the upstream PRT. Because this flow of gas was not included in the model, no gradient was shown between the two TFPRT locations in the calculated results. This defect with the model may cause some errors in evaluating spatial gradients and peak measurements, however the time for both TFPRTs to equilibrate with the copper agrees within 10% so this computational simplification is valid for estimating time constant for equilibration.
Conversely, the peak temperature of the copper chamber was 0.24 mK lower than the computer model. This is most likely a result of the computer model’s lower thermal mass as a result of the mounting hardware (screw/bolt heads were not included) which would reduce the peak chamber temperature. The slower response to dynamic temperature of the SPRT could also reduce peak temperature. The desired output of the modeling was a verification of the time required to reach equilibrium (glass to copper) and the time to reach the temperature setpoint. The system reached equilibrium after 2900 s in the model and 3100 s with PRT measurements. The time required for the copper chamber to return to the setpoint temperature of 302.92 K, within 0.5 mK was 4.3 h with the computer model and 3.7 h for the measured data.
The equilibration time of 3000 s seems like a relatively long wait time for pressure standards that try to achieve multiple datapoints per run, however in practice 100 kPa changes are not common for a working pressure standard. In comparison, the current NIST primary pressure standard takes 900 s for a 10 kPa pressure change. For operation of an FLOC with higher uncertainties, larger temperature variations may be acceptable. This evaluation proves an FLOC with uncertainty of 0.003% is achievable with only a 10 s wait per kPa of pressure change. At time scales of less than this, the system is undergoing rapid exchange of heat with the chamber and glass cell. In this dynamic temperature environment, the temperature of the thermometer (in any location) will not be an accurate representation of gas temperature and therefore cannot be used for pressure determination from gas refractivity. For a pressure standard, an absolute measurement of temperature will be determined via calibrated SPRT. For the NIST FLOC pressure standard, the uncertainty of the PRT combines with the uncertainty of the gradients (after wait time) to form a total uncertainty of 0.65 mK. This is equivalent to 2.1 μPa Pa−1 (k = 1) of pressure uncertainty.
8. Conclusion
For high accuracy temperature and pressure measurements via refractive index, a stable temperature environment is required. The FLOC chamber design meets this criterion and the computer modeling and physical data supports the conclusion that the copper chamber is an accurate measurement of gas temperature within an uncertainty of 0.5 mK (k = 1) after a wait time constant of 600 s. Wait times after filling to pressure are related to the magnitude of gradients in the system which can be the dominant temperature uncertainty term at very short time scales. Looking toward the future, it may be possible to substantially reduce this wait time by employing design modifications, such as a copper insert surrounding the beam path, so that the gas temperature is less influenced by the slow-responding ULE [1]. This study also shows that when operating as a pressure standard, a single PRT can be used to measure system temperature. This method contributes less than 1.6 μPa Pa−1 (k = 1) to the pressure uncertainty. The FLOC has proven to be a pressure measurement device capable of determining pressure to an accuracy and performance that can replace traditional standards such as Mercury manometers. [3, 4]
When operated as a temperature standard using nitrogen, the FLOC has an uncertainty of less than 3 mK at 300 K (10 ppm) when combined with a traditional high-pressure standard such as a piston gauge. These standards will be traceable through measurements and quantum calculations of the refractive index of the gas and will require no recalibration. Future optical RIGT may be capable of uncertainties of 1 mK depending on the abilities to determine refractivity with direct quantum traceability. Quantum mechanics is enabling improvements to long calibration chains and putting lower uncertainty pressure and temperature measurements into the hands of end users.
Acknowledgments
The authors thank Ronald Tosh for the beneficial discussions on improving the COMSOL results and also thank Gregory Strouse and Michal Chojnacky for the selection and calibration of SPRTs.
Appendix A
For the FLOC system, the largest temperature effects occur when pressurizing between a low pressure (for the simulation we use 1 kPa) and 100 kPa. Fills below 1 kPa result in negligible heating effects. Therefore, we can estimate the temperature rise from the conservation of energy and conservation of mass:
| (A1) |
| (A2) |
| (A3) |
where m1 is the mass of gas before pressurization, m2 is the mass after. u2 and u1 represent the internal energy of the system. The mass flow rate of gas entering the system is and there are no outflows from the system, so mout = 0. hin and hout represent the enthalpy of the gas entering and exiting the system. For a quick pressurization, we can assume heat flux Q1→2 = 0. This approximation assumes a perfectly insulated system and therefore calculates the highest possible temperature rise. Finally, since we are not doing any mechanical work W1→2 = 0, therefore the equation becomes:
| (A4) |
Using ideal gas approximation and molar mass, M, for nitrogen, , and assuming that the volume is constant, we can find an equation in terms of thermodynamic properties:
| (A5) |
Using the approximation that u1 = CvT1, u2 = CvT2, and hin = CPT1, then we find:
| (A6) |
Simplifying the equation using the specific heat ratio , we can find the following equation for T2:
| (A7) |
For nitrogen pressures below one ATM and temperatures around 300 K, γ = 1.4. Therefore, we can calculate the temperature rise for our system to be:
| (A8) |
The pressurization results in a 120 K change in temperature, which would have a large impact on the system and our ability to measure temperature to 1 mK, however the gas has a very small heat capacity:
| (A9) |
where VN2 = 172 cm3, ρN2 (420 K) = 0.805*10−6 kg cm−3, and cN2(420 K) = 1046 J kg−1 K−1.
If we allow this heat to equilibrate into the system (assuming no heat loss to the outer environment), the temperature rise is very small:
| (A10) |
| (A11) |
given that from the materials and properties of the glass, copper, aluminum, and stainless steel of the chamber design.
For the simulation, a constant density is assumed, and the thermal change is approximated as a constant heat input, therefore we calculate the heat source using equation (A10) resulting in an equivalent heat input of 17.3 J.
Footnotes
Any mention of commercial products within this article is for information only; it does not imply recommendation or endorsement by NIST.
References
- [1].Egan PF, Stone JA, Scherschligt JK and Harvey AH 2019. Measured relationship between thermodynamic pressure and refractivity for six candidate gases in laser barometry J. Vac. Sci. Technol. A 37 031603. [PMC free article] [PubMed] [Google Scholar]
- [2].Jousten K et al. 2017Perspectives for a new realization of the pascal by optical methods Metrologia 54S146–61 [Google Scholar]
- [3].Egan PF, Stone JA, Ricker JE and Hendricks JH 2016. Comparison measurements of low-pressure between a laser refractometer and ultrasonic manometer Rev. Sci. Instrum. 87 053113. [DOI] [PMC free article] [PubMed] [Google Scholar]
- [4].Egan PF, Stone JA, Hendricks JH, Ricker JE, Scace GE and Strouse GF 2015. Performance of a dual Fabry–Perot cavity refractometer Opt. Lett. 40 3945–8 [DOI] [PubMed] [Google Scholar]
- [5].Egan P and Stone JA 2011. Absolute refractometry of dry gas to ±3 parts in 109 Appl. Opt. 50 3076–86 [DOI] [PubMed] [Google Scholar]
- [6].Takei Y, Arai K, Yoshida H, Bitou Y, Telada S and Kobata T 2020. Development of an optical pressure measurement system using an external cavity diode laser with a wide tunable frequency range Measurement 151 107090 [Google Scholar]
- [7].Mari D, Pisani M and Zucco M 2019. Towards the realization of an optical pressure standard Measurement 132 402–7 [Google Scholar]
- [8].Yang L, Li Y and Wei H 2018. High-precision gas refractometer by comb-mode-resolved spectral interferometry Sci. Rep. 8 16447. [DOI] [PMC free article] [PubMed] [Google Scholar]
- [9].Puchalski M, Piszczatowski K, Komasa J, Jeziorski B and Szalewicz K 2016. Theoretical determination of the polarizability dispersion and the refractive index of helium Phys. Rev. A 93 032515 [Google Scholar]
- [10].Hendricks J 2018Quantum for pressure Nat. Phys. 14100. [DOI] [PMC free article] [PubMed] [Google Scholar]
- [11].Ricker J, Hendricks J, Bock T, Dominik P, Kobata T, Torres J and Sadkovskaya I 2017. Final report on the key comparison CCM.P-K4.2012 in absolute pressure from 1 Pa to 10 kPa Metrologia 54 07002. [DOI] [PMC free article] [PubMed] [Google Scholar]
- [12].Rourke PMC, Gaiser C, Gao B, Ripa DM, Moldover MR, Pitre L and Underwood RJ 2019. Refractive-index gas thermometry Metrologia 56 032001. [DOI] [PMC free article] [PubMed] [Google Scholar]
- [13].Gaiser C, Zandt T and Fellmuth B 2015. Dielectric-constant gas thermometry Metrologia 52 S217–26 [Google Scholar]
- [14].Moldover MR, Gavioso RM, Mehl JB, Pitre L, de Podesta M and Zhang JT 2014. Acoustic gas thermometry Metrologia 51 R1–R19 [Google Scholar]
- [15].Qu J, Benz S, Rogalla H, Tew W, White D and Zhou K 2019. Johnson noise thermometry Meas. Sci. Technol. 30 112001. [DOI] [PMC free article] [PubMed] [Google Scholar]
- [16].Gianfrani L. Linking the thermodynamic temperature to an optical frequency: recent advances in Doppler broadening thermometry. Phil. Trans. R. Soc. A. 2016;374:20150047. doi: 10.1098/rsta.2015.0047. [DOI] [PMC free article] [PubMed] [Google Scholar]
- [17].Egan PF, Stone JA, Ricker JE, Hendricks JH and Strouse GF 2017. Cell-based refractometer for pascal realization Opt. Lett. 42 2944–7 [DOI] [PMC free article] [PubMed] [Google Scholar]
- [18].CCT Working Group 4. 2010 https://www.bipm.org/utils/common/pdf/ITS-90/Estimates_Differences_T-T90_2010.pdf.
- [19].Avdiaj S, Yang Y, Jousten K and Rubin T 2018. Note: diffusion constant and solubility of helium in ULE glass at 23 °C J. Chem. Phys. 148 116101. [DOI] [PubMed] [Google Scholar]
- [20].Olson DA, Driver RG and Bowers WJ 2010. A gas pressure scale based on primary standard piston gauges J. Res. Natl Inst. Stand. Technol. 115 393–412 [DOI] [PMC free article] [PubMed] [Google Scholar]