

In this retrospective study in patients with neovascular age-related macular degeneration, medium and large subretinal macular neovascularization and the presence of subretinal fibrovascular tissue at presentation were identified as independent predictors of eventual outer retinal tubulation formation. Therefore, Type 2 neovascularization with subsequent contraction of subretinal fibrosis may be responsible for outer retinal tubulation formation.
Key words: age-related macular degeneration, macular neovascularization, outer retinal tubulations, subretinal fibrosis
Abstract
Purpose:
To investigate the role of Type 2 macular neovascularization with subsequent subretinal fibrosis in the pathogenesis of outer retinal tubulation (ORT).
Methods:
We conducted a retrospective cohort study of patients with stabilized inactive exudative macular degeneration who had been treated with intravitreal injections of antivascular endothelial growth factor agents. Baseline fluorescein and optical coherence tomography images were included. Macular neovascularizations (MNVs) were classified by type and size. Consecutive optical coherence tomography images analyzed for ORT development.
Results:
One hundred forty-four eyes of 134 patients were included in this study. Sixty eyes presented with pure Type 1 MNV. Eighty-four eyes presented with some Type 2 component of MNV. In total, evidence of ORT is shown in 55 (38%) eyes. In the Type 1 group, 6.7% developed ORT. Outer retinal tubulation developed in 61% of eyes with some Type 2 component of the MNV. Among eyes that developed ORT, 92.7% presented with some Type 2 component. In a multivariate analysis, Type 2 membranes on optical coherence tomography (22.2 [6.1–80.8]; P < 0.001), larger MNV size {>1 DA (5.1 [1.1–24.2]; P = 0.041) and >1.5 DA (9.0 [1.8–44.0]; P = 0.007)}, and presence of subretinal fibrovascular material (3.1 [1.1—8.5]; P = < 0.03) are associated with higher odds of ORT formation. Once the ORT is formed, fibrosis was observed directly underlying the ORT on SD-optical coherence tomography in 70.9% of cases.
Conclusion:
Type 2 membranes at presentation predict ORT formation. Fibrosis often underlies ORT. This suggests that contraction of Type 2 MNV-derived fibrosis may be important in ORT formation.
Outer retinal tubulations (ORTs) were first described by Zweifel in 2009 as a novel optical coherence tomography (OCT) finding.1 Since then ORT has been described in numerous degenerative retinal conditions, including both wet and dry age-related macular degeneration (AMD) and hereditary retinal dystrophies.2–6 On OCT cross-sectional scans, ORTs appear as round or ovoid hyporeflective spaces with hyperreflective borders in the outer nuclear layer. A branching tubular structure to these lesions was demonstrated with the help of en-face OCT.
The exact pathophysiology of ORT formation remains uncertain. The commonly accepted hypothesis is that ORTs form a part of a process involving the degeneration of photoreceptors, activation of Müller cells, and disruption of retinal pigment epithelium (RPE). When Zweifel et al first described ORTs, they postulated that it was the common final pathway for a variety of retinal degenerations and proposed that a sublethal injury to the photoreceptors and RPE was the first step. They theorized that disruption of tight junctions by the injury leads to outward folding of the photoreceptor layer until opposite margins of the fold established contact to form a tubular structure.1,7 More recent studies postulate that ORTs may represent a retinal response to progressive photoreceptors damage in an attempt to preserve photoreceptor survival. Müller cells are proposed as the prime mechanical drivers in ORT formation.9–11
The exact mechanism of ORT formation is still unclear. Dolz-Marco et al proposed that ORT formation is a neurodegenerative and gliotic process leading to structural changes in patients with advanced outer retinal diseases, and suggested that ORT may be the final common pathway of many types of neuroretinal degeneration. These authors also suggested that RPE atrophy, especially active extension of the RPE damage such as in the case of neovascular AMD, is required for ORT development.11 The authors, however, did not explain how RPE atrophy is related to ORT formation.
Preti et al further analyzed sequential OCT images of ORT formation, identified outer plexiform subsidence sign as evidence of Müller cell participation in the pathogenetic process. They also identified a vertical hyperreflective line within open outer retina tubules before bifurcation. They did not speculate as to the nature of this interesting OCT finding.10
In exudative AMD, the importance of Type 2 neovascularization in ORT formation has been demonstrated by Faria-Correia et al.12 They showed that patients with AMD with a classic component in their lesions are more prone to develop ORT.12
The purpose of this study is to ask whether the presence of Type 2 neovascular membrane is integral to the formation of ORT. Through sequential OCT imaging, we also suggest a novel hypothesis of ORT pathogenesis, not involving Müller cells or any attempt at photoreceptor preservation but resulting from traction of the subretinal scar exerted on the outer retina.
We will not explore the pathogenetic mechanism of ORT formation in geographic atrophy (GA) or other retinal degenerative conditions.
Methods
This study was approved by the IRB of McGill University Health Center. We conducted a retrospective chart review of all new patients diagnosed with neovascular AMD at a referral retina center between 2011 and 2015. All patients included were recruited from the practice of one single ophthalmologist (J.C.C.). Only patients treated with antivascular endothelial growth factor (VEGF), with at least 5 months of follow-up, and had resolution of subretinal fluid for at least two consecutive visits were included. All patients entered into the study had both SD-OCT images and fluorescein angiography before the initiation of anti-VEGF treatment. Baseline patient clinical and imaging characteristics were recorded. Patients with poor baseline images of fluorescein angiogram and/or OCT were excluded. Indocyanine green angiography was occasionally used in confirming the diagnosis of Type 3 neovascularization or polypoid choroidal vasculopathy. All eyes in this study had imaging (fluorescein angiogram, indocyanine green angiography, infrared, autofluorescence, and OCTs) performed using Spectralis HRA + OCT (Heidelberg Engineering GmbH, Dossenheim, Germany). Although this is a retrospective study, the imaging protocol may not be consistent with each patient at each visit, but our center's technicians were instructed to follow a certain OCT imaging protocol for patients receiving anti-VEGF therapy. Most of the OCTs had analyzed area from 20° × 10° to 30° × 25°. Line spacing ranged from 11 to 242 µm and ART from 10 to 25. Demographic and clinical data collected for each patient included age, sex, comorbidities, affected eye, visual acuity, and fundus biomicroscopy findings. Baseline imaging features recorded include fluorescein angiographic features of neovascularization (occult, minimally classic, or predominantly classic) and OCT features using the Consensus on neovascular AMD nomenclature of neovascular AMD.13 That is, classification of macular neovascularization (MNV) as Type 1, 2, 3, or mixed. The type of anti-VEGF agent used was recorded. All patients were treated according to the treat-and-extend protocol; the interval between visits (in months) was recorded.
Baseline SD-OCT images were analyzed by each of the coauthors, cross-referenced with the fluorescein angiographic image, for the location of the MNV (Type 1 being sub-RPE and occult on angiogram, Type 2 being subretinal and either minimally or predominantly classic on angiogram, and Type 3 if retinal angiomatous proliferation is identified. Polypoidal choroidal vasculopathy (PCV) is diagnosed when typical features on OCT is identified with consistent fluorescein and indocyanine green angiographic findings). For the purpose of this study, patients were labeled as either having no Type 2 MNV (e.g., pure occult membranes or Type 1 MNVs), predominantly Type 2 MNV, or minimally Type 2 MNV. Polypoidal choroidal vasculopathy eyes are either labeled as pure Type 1 lesion or mixed type if some Type 2 component can be seen on OCT. For retinal angiomatous proliferation (RAP) eyes, or eyes with Type 3 MNV, OCT images may often suggest the presence of neovascular tissue also in the subretinal space (Type 2 MNV) and below RPE. If no visible Type 2 component can be seen, these RAP eyes would be labeled as no Type 2 MNV; if some Type 2 component is seen, they would be classified as minimally Type 2 MNV. Additional features of the OCT images, such as pigment epithelial detachment, fibrous scarring, subretinal fluid, and subretinal hyperreflective material, were also recorded. The membranes were also graded by size with small = < 1 disc area (DA), medium = 1 to 1.5 DA, and large = > 1.5 DA.
At each subsequent patient visit, the SD-OCT images were analyzed and the presence of ORT formation documented. A patient was considered to have developed ORT if closed ORTs were noted on the SD-OCT images on at least two subsequent visits. ORT was diagnosed on SD-OCT B-scans by the appearance of the characteristic round hyporeflective lesions delineated by a hyperreflective border, located at the level of the outer nuclear layer.
Statistical Analysis
Descriptive statistics were produced for all study variables, consisting of the mean and SD (or the median and range in case of data skewness) for continuous variables, as well as frequency distributions for categorical variables. For the comparison of eyes developing versus not developing ORT in terms of characteristics at the time of initial diagnosis, the t-test was used for continuous variables and the chi-square or Fisher exact test, as appropriate, for categorical variables. For variables with multiple measurements over time, generalized estimating equations were used. To identify factors independently associated with ORT formation, a two-step approach was followed where potential predictors were first identified based on whether they showed a statistical trend (P < 0.15) in univariate analysis, as described above. These factors were then considered in multivariate regression analysis and backward variable selection was applied to derive the parsimonious model.
All analyses were conducted using SPSS software version 24 (Armonk, NY: IBM Corp.).
Sequential Qualitative Imaging Analysis
Besides static correlation between initial imaging characteristics and final ORT development, we also performed sequential imaging analysis with each case to understand the process of neovascular involution and cicatrization. Specifically, the process of ORT formation is scrutinized.
Results
A total of 144 eyes of 134 patients with new onset wet AMD were included in the study. There were 93 female and 41 male subjects. The mean age was 81 years at time of presentation. Patients had an average of 15 visits (range 5–44) during the study period, and the mean follow-up period was 24 months (range 5–52).
Univariate analysis showed no difference between patients with and without ORT for the above variables. There were, however, significant differences in visual acuity between the two groups; mean baseline Snellen visual acuity was 20/66 (0.52 logarithm of the minimum angle of resolution) in eyes without ORT versus 20/107 (0.73 logarithm of the minimum angle of resolution) in eyes with ORT (P = 0.003). At last follow-up visit, the mean acuity was 20/52 (0.42 logarithm of the minimum angle of resolution) versus 20/90 (0.65 logarithm of the minimum angle of resolution), respectively (P = 0.01).
Macular neovascularization of Type 1, Type 2, and mixed Type 1 and Type 2 membranes was found in 66% of the eyes; polypoid choroidal vasculopathy (a particular form of Type 1 membranes) was diagnosed in 7.6% of eyes; Type 3 neovascularization or RAP occurred in 26.4%. ORTs were identified in 55 of the 144 eyes (38.2%).
The initial fluorescein angiograms were classified as having either classic, occult, or mixed neovascularization. Nine eyes were excluded from the analysis as preretinal and retinal hemorrhages prevented accurate angiographic classification. Of the 135 eyes analyzed, 51 (37.7%) developed ORT. Among the eyes in the ORT group, the incidence of the different types of membranes was predominantly classic in 41.2%, occult in 33.3%, and minimally classic in 25.5%. Therefore, 66.7% of eyes with eventual ORT formation presented with either predominantly classic or minimally classic membranes compared with 33.3% with occult membranes. The opposite was seen in the group of patients without ORT: occult membranes accounted for 71.4% of cases and minimally or predominantly classic membranes made up the remaining 28.6% (P < 0.001). The neovascular membranes were also classified according to size on initial angiography (small = < 1 DA , medium = 1 to 1.5 DA, and large = > 1.5 DA). Eyes with eventual ORT formation had a high incidence of medium (39.2%) or large (47.1%) neovascular membranes at presentation. In eyes with small neovascular membranes, ORT was found in 13.7%. In the non-ORT group, we again found the opposite distribution, with small (37.2%) and medium (41.9%) membranes having a higher incidence than large membranes (20.9%) (P < 0.001).
The incidence of ORT formation according to the initial macular neovascular membrane visible on SD-OCT imaging at presentation was as follows: 4 (6.7%) of the 60 patients with no Type 2 MNV component at presentation developed ORT, 13 (68.4%) of the 19 cases who presented with predominantly Type 2 MNVs manifested ORT, and 38 (58.5%) of the 65 cases with minimally Type 2 membranes developed ORT. When grouping together, for the 84 eyes that presented with a Type 2 component to the membrane (predominantly and minimally Type 2 membranes), the incidence of ORT formation by the presenting membrane was as follows: Only 6.7% of eyes that presented with no Type 2 MNV developed ORT compared with 60.7% (51 of 84) of eyes that presented with some Type 2 component to the MNV (P <0.001). For this portion of the analysis, eyes diagnosed with polypoid choroidal vasculopathy and RAP or type 3 membranes are included and segregated according to the presence of Type 2 components of the membrane only.
Among the 55 eyes that developed ORT, the incidence of different types of MNV, based on the initial SD-OCT appearance, was as follows: 69.1% presented with a mixed MNV consisting of both Type 1 and Type 2 elements; 23.6% had only a Type 2 membrane and no Type 1 element; and 7.3% had only a Type 1 membrane at presentation. Together, this means that among eyes that progressed to ORT 92.7% of cases presented with some Type 2 membranes and only 7.3% presented with only Type 1 membranes. This is in comparison with the non-ORT group, where only 37.1% had a Type 2 component to the initial membrane and most eyes (62.9%) presented with only the Type 1 membrane (P < 0.001) (Table1).
Table 1.
Incidence of Different Types of MNV in the Non-ORT and ORT Cohorts
| Non-ORT | ORT | P | |
| Type of initial MNV on OCT, n (%) | |||
| Type 1 | 56 (62.9) | 4 (7.3) | <0.001 |
| Type 2 | 6 (6.7) | 13 (23.6) | |
| Mixed Type 1 and Type 2 | 27 (30.3) | 38 (69.1) | |
| Type of initial MNV on OCT, n (%) | |||
| Type 1 | 56 (62.9) | 4 (7.3) | <0.001 |
| All Type 2 | 33 (37.1) | 51 (92.7) | |
| Type of initial MNV on FA, n (%) | |||
| Occult | 60 (71.4) | 17 (33.3) | <0.001* |
| Mixed + classic | 24 (28.6) | 34 (66.7) | |
| Mixed | 13 (15.5) | 13 (25.5) | |
| Classic | 11 (13.1) | 21 (41.2) | |
| Size of MNV on FA, n (%) | |||
| <1 DA | 32 (37.2) | 7 (13.7) | <0.001 |
| 1–1.5 DA | 36 (41.9) | 20 (39.2) | |
| >1.5DA | 18 (20.9) | 24 (47.1) | |
| Diagnosis, n (%) | |||
| AMD | 49 (55.1) | 46 (83.6) | 0.002 |
| RAP | 31 (34.8) | 7 (12.7) | |
| PCV | 9 (10.1) | 2 (3.6) | |
| Initial membrane by diagnosis, n (%) | |||
| AMD | |||
| Type 1 | 31 (63.3) | 3 (6.5) | <0.001 |
| Type 2 | 3 (6.1) | 11 (23.9) | |
| Mixed Type 1 and Type 2 | 15 (30.6) | 32 (69.6) | |
| RAP | |||
| Type 1 | 18 (58.1) | 1 (14.3) | 0.095 |
| Type 2 | 3 (9.7) | 2 (28.6) | |
| Mixed Type 1 and Type 2 | 10 (32.3) | 4 (57.1) | |
| PCV | |||
| Type 1 | 7 (77.8) | 0 (0.0) | 0.109 |
| Mixed Type 1 and Type 2 | 2 (22.2) | 2 (100.0) |
P- value is <0.001 for both comparison of two levels and three levels.
In stratified analysis by diagnosis, the nAMD cohort consisted of 95 patients of which 46 (48.4%) developed ORT; 6.5% of these cases had only a Type 1 membrane and 93.5% had some Type 2 membrane at presentation. In the non-ORT nAMD group, 63.3% of eyes had only Type 1 membrane and 36.7% some Type 2 membrane (P < 0.001). When looking at Type 3 or patients with RAP separately, among the 38 cases, seven developed ORT. Six of these seven eyes (85.7%) had an identifiable Type 2 component, and one eye (14.3%) did not show an identifiable Type 2 component at presentation. In patients with RAP who did not develop ORT, 18 (58.1%) had no identifiable Type 2 component and 13 (42%) had some visible Type 2 component (P = 0.095). Of the 11 cases of PCV, 2 (18.2%) developed ORT and a Type 2 membrane was present in both (100%) of these at presentation. Of the remaining nine eyes that did not develop ORT, Type 1 membranes were found in 7 (77.8%) and Type 2 membranes in 2 (22.2%) (P < 0.109).
In eyes that developed ORT, we identified and categorized the tissue directly underlying the ORT by its SD-OCT appearance. The most common scenario was scar-tissue–without-RPE (47.3%), followed by scar-on-top-of-RPE (23.6%). Intact RPE was found in 18.2% of cases, and RPE atrophy and RPE-on-a-scar in 9.1% and 1.8% of cases, respectively. Therefore, scar tissue appeared to be directly under the ORT in 70.9% of cases with no visible intervening RPE between the ORT and underlying tissue in 80.0% of cases.
In multivariate analysis, initial membrane type on fluorescein angiography and OCT, initial MNV size, and the presence of subretinal fibrovascular tissue were identified as significant independent predictors of ORT development. Mixed and classic membranes on fluorescein angiography (OR [95% CI]: 4.0 [1.0–15.2]; P = 0.044) and any Type 2 membrane on OCT (22.2 [6.1–80.8]; P < 0.001) were associated with higher odds compared with occult membranes and Type 1 membranes, respectively, and MNV sizes 1 to 1.5 DA (5.1 [1.1–24.2]; P = 0.041) and >1.5 DA (9.0 [1.8–44.0]; P = 0.007) were associated with higher odds compared with MNV sizes ≤1 DA. Similarly, the presence of subretinal fibrovascular tissue (3.1 [1.1–8.5]; P = 0.03) was associated with higher odds compared with absence thereof (Table 2).
Table 2.
Final Multivariate Model for ORT Development On Selection of Significant Variables
| Odds Ratio | 95% CI | P | ||
| Lower | Upper | |||
| Mixed + classic versus occult | 4.0 | 1.0 | 15.2 | 0.044 |
| All Type 2 (predominant and minimal) versus no Type 2 | 22.2 | 6.1 | 80.8 | <0.001 |
| Initial size of MNV >1.5 DA versus = <1 DA | 9.0 | 1.8 | 44.0 | 0.007 |
| Initial size of MNV 1–1.5 DA versus = <1 DA | 5.1 | 1.1 | 24.2 | 0.041 |
| Subretinal fibrovascular tissue yes versus No | 3.1 | 1.1 | 8.5 | 0.030 |
Through sequential qualitative OCT imaging analysis, we observed that in many cases of eventual ORT development, at early stages, we can clearly see the formation of a large loculated space of subretinal fluid lined by fibrotic scar, often with intervening slightly hyperreflective lines stretching across the cavity. Unlike most of the subretinal space seen in active nAMD where at the edge the neuroretina forms an acute angle with the underlying tissue, the loculated space has a more rounded edge. We interpret this feature to be the result of extension of fibrovascular proliferation onto the external surface of the neuroretina. The intervening hyperreflective lines stretching across this cavity may represent fibrovascular septae spanning the cavity (Figure 1). All of the cases presenting with this feature progressed to ORT formation.
Fig. 1.
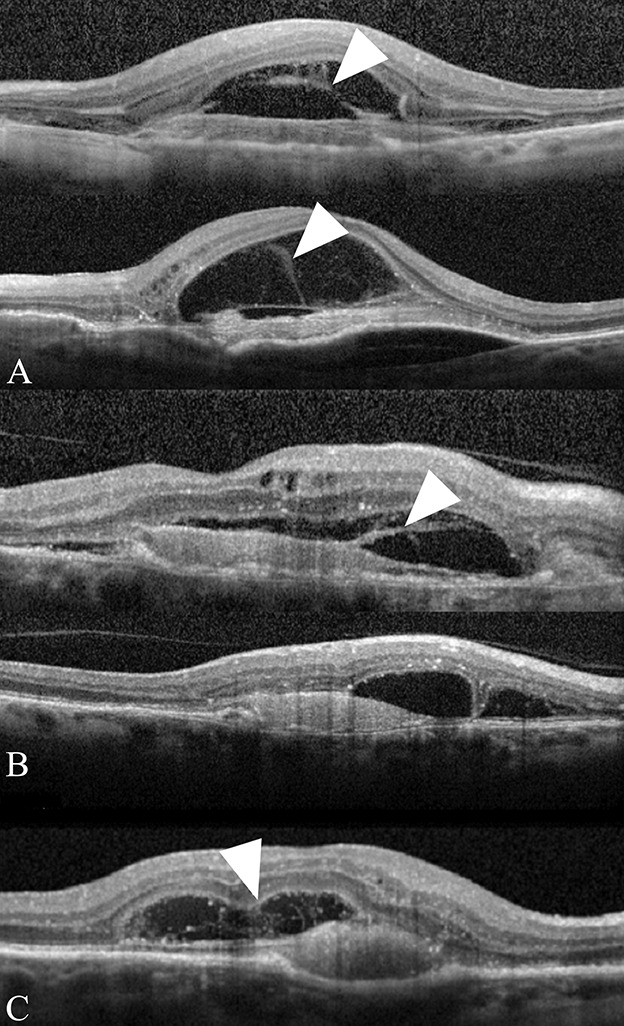
Parts A–C. Initial SD-OCT images depicting fibrous stands in a rounded subretinal space. The SD-OCT images of three patients (A–C) with Type 2 MNV are shown. Fibrous strands (arrowheads) can be seen connecting the underside of the outer retina with the underlying fibrovascular membrane. Note the rounded edges (arrows) of the subretinal space. All three patients developed ORT.
At presentation, Type 2 membranes are seen as lamellar structures parallel to the Bruch membrane. After anti-VEGF injections, at the same time as the resolution of subretinal and intraretinal fluid, the fibrovascular tissue contracts and forms a more compact disciform scar. At this point, the subretinal scar becomes thinner, smaller, and the lamellar arrangement becomes less distinct. The septae observed spanning the subretinal loculated cavity at presentation gradually become invisible as the subretinal fluid resorbs. As the inner aspect of the cavity settles down, with the overlying neuroretina, somewhat irregularly, open type of ORT is observed. Further contraction of the subretinal fibrosis then causes the open tubules to close (Figure 2).
Fig. 2.
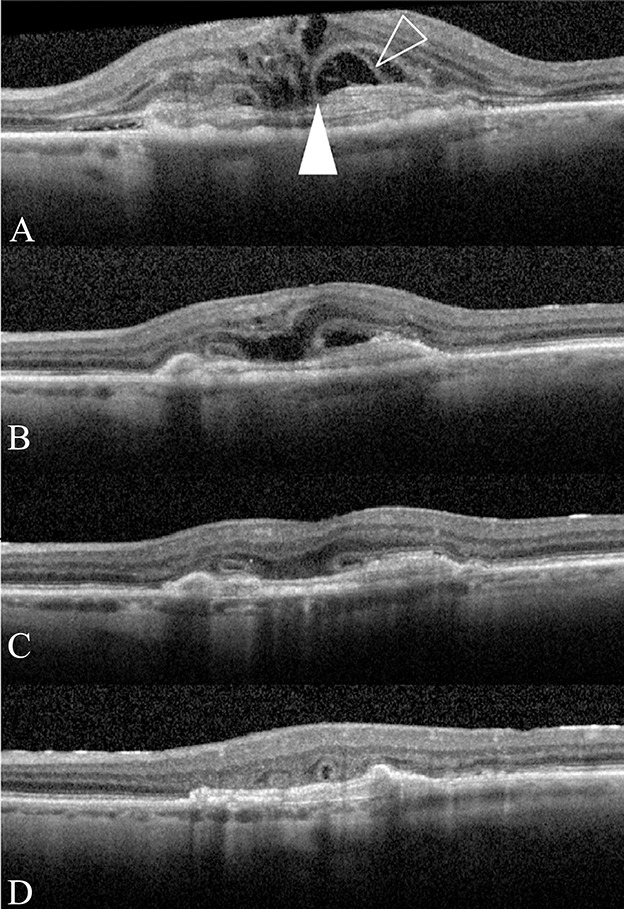
Part A–D sequential SD-OCT images depicting progression from Type 2 MNV to ORT formation. A. A Type 2 MNV with intraretinal and subretinal fluid. The subretinal space has a rounded edge with fine lines (outlined arrowhead) spreading from the fibrous scar to the underside of the retina. The free edge of the ELM is tacked down on the fibrous tissue (solid white arrowhead). B–D. After anti-VEGF treatment, the subretinal space collapse with compacting of the fibrous scar and the free edge of the ELM is seen to progressively scroll until closed ORTs are formed.
A summary of the entire process of ORT formation in AMD with Type 2 neovascularization is depicted by a cartoon diagram (Figure 3).
Fig. 3.
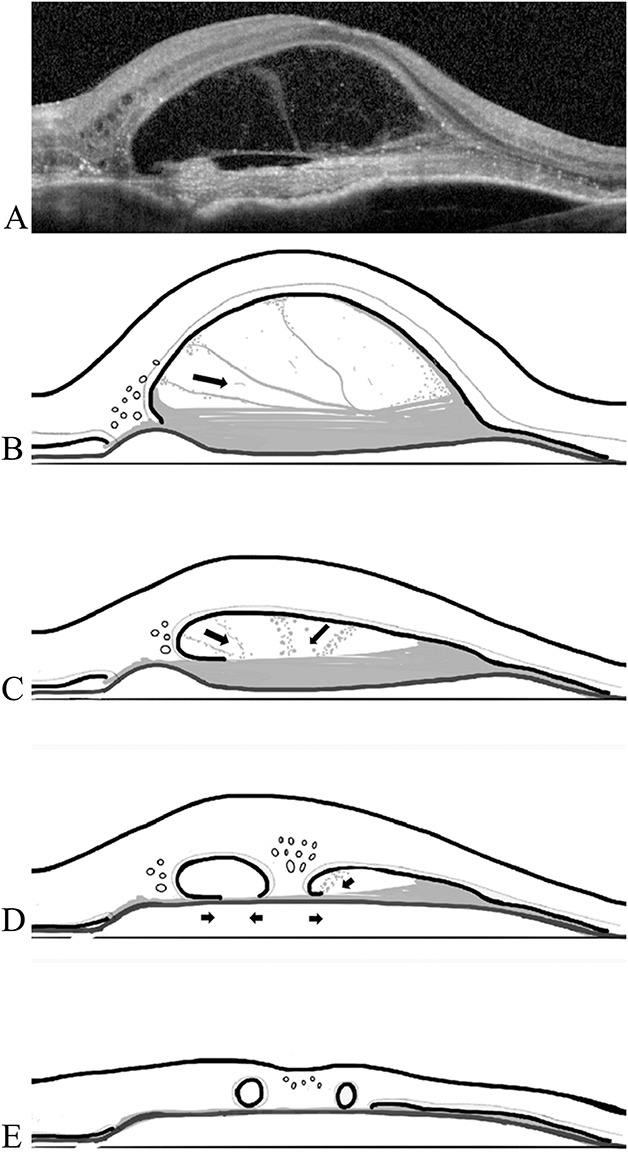
Parts A–E diagram of the proposed role of subretinal fibrosis in ORT formation. A. SD-OCT image of Type 2 MNV with strands (fibrin) spanning the subretinal space and attaching to the underside of the outer retina (same patient as in panel A of Fig. 1). B–E. (B). Presentation; (C) one month later after first anti-VEGF injection; (D) two months later after two injections; (E) three months later after third anti-VEGF injection ensuing contraction of the subretinal fibrosis results in compacting of the subretinal scar and ultimate ORT formation. Black arrows indicate the directions of presumed fibrous contraction.
Discussion
Recent articles have described the evolution, stages in progression, and characteristics of ORT. Schaal et al's work correlating spectral domain optical coherence tomography characteristics of ORTs with histological findings provided important clinical–pathologic correlations. Their work helped us understand the OCT imaging characteristics of ORT. It defined four components of ORT formation.9 These are as follows: ORTs are always confined to the outer nuclear layer; there is a hyperreflective band in open or closed configuration; the underlying RPE is absent or dysmorphic; and finally, there seems to be an external limiting membrane (ELM) “free edge” necessary for ORT to form. These authors implied that Müller cells and gliotic process are causally involved in ORT formation, somewhat similar to what was observed in reattached retina after chronic experimental retinal detachment. They also suggested, somewhat teleologically that “ORT demonstrates that photoreceptors have an extended will to live even in advanced AMD.” Our interpretation of their conclusion is that ORT formation is a programmed, protective tissue response, mediated through Müller cells, to the retinal degenerative process caused by advanced AMD.
With the valuable insight provided by this OCT histologic comparison study, two clinical articles, through documenting sequential evolution of ORT by OCT, furthered this understanding.10,11 During the evolution of ORT, the ELM can be seen on SD-OCT to descend and gradually start to scroll to form open tubules. After the formation of open tubules, a vertical hyperreflective line can sometimes be seen on OCT that marks the site of splitting of the open tubule into separate smaller closed tubules. Initially, the tubules are lined with degenerating photoreceptor inner segments. These eventually disappear as the photoreceptors continue to degenerate. Both of these studies did not advance any new hypothesis for the formation of ORT. Their findings are consistent with the thesis that the main motor in ORT formation is activated Müller cells in response to continued retinal degeneration. The trigger of the Müller cells activation has been proposed to be the loss of RPE cells.
Our findings demonstrate that ORT is more likely to develop when the presenting neovascular membranes have a large Type 2 component, compared with small Type 2 or isolated Type 1 membranes. Moreover, once these neovascular membranes are stabilized by intraocular anti-VEGF injections, we found fibrotic scar tissue to be the most common tissue directly underlying ORT, without an intervening intact RPE layer. These findings are consistent with those of previous studies in that large MNVs, Type 2 lesions, and lesions with a classical component on fluorescein angiography are associated with ORT formation.12,14 A study in ORT associated with choroidal osteomas similarly reported that ORT was found either on top of or very close to areas of subretinal MNV.2 This suggests that the presence of a fibrovascular membrane directly under the neuroretina is in all likelihood not only a prerequisite for ORT formation but that it is also the main driver of the process. A Type 2 membrane with the ensuing contraction of subretinal fibrosis is central to the pathophysiological mechanism of ORT formation.
To elaborate, we postulate that fibrotic proliferation on the underside of the neuroretina is responsible for the initial tack-down of the outer retina. Subsequent contraction of the fibrovascular membrane leads to the progressive irregular puckering and folding of the outer retina to eventually from branching networks of ORT. The concept can be likened to the pathophysiological mechanism of RPE tears after fibrovascular PED or macular puckering of epimacular proliferation.15,16
The mechanical traction exerted by anti-VEGF-treated type 2 neovascularization undergoing involution and cicatrization may be the proximate cause of ORT formation is particularly evident in cases where there is the blunting or rounding of the angle formed by the presence of subretinal fluid (Figures 1–3). In most cases of exudative AMD, at the limit of the subretinal fluid, where the detached neuroretina becomes attached with the underlying structure (RPE or neovascular tissue) forms an acute angle. In cases where ORT eventually develop, the subretinal fluid forms a more loculated space. At the limit of this space, the angle formed is less acute and more rounded. External to this loculated space, OCT images show a lamellar arrangement of Type 2 fibrovascular tissue, with or without underlying intact RPE, with or without concurrent Type 1 fibrovascular structure. On the other side of the loculated space, external and adherent to the neuroretina, a hyper reflective layer of what we interpret as fibrovascular or gliotic tissue is observed. At the limit of the loculated space (where detached neuroretina becomes attached), the angle formed is much less acute and more rounded. The rounding of the angle is caused by the “climbing” of the Type 2 fibrovascular tissue and fusing with the overlying neuroretina. In addition, within this loculated subretinal fluid space, faint vertical lines of slight hyper reflectance can be seen spanning the entirety of this cavity. The intervening hyperreflective lines stretching across this cavity may represent fibrovascular septae.
The cases illustrated in Figure 1 represent visually most spectacular examples of Type 2 membranes at presentation. We believe that a similar process may occur in most if not all cases of Type 2 membranes. That is, Type 2 neovascular membranes may not stay flat on the external limit of the subretinal space in most cases at presentation. There most likely is some attachment to the overlying neuroretina that is just not visible on OCT. At later stages, as the neovascular tissue involutes with continued anti-VEGF treatment, it becomes more and more fibrosed. It contracts and forms a more compact fibrous scar. Together with the resolution of subretinal fluid, the involuted fibrovascular tissue contracts, but somewhat unevenly and irregularly, causing the settling of the overlying neuroretina to wrinkle and form open, tubules. Further contraction of the subretinal fibrosis may then cause the well-described sequential evolution of open tubules to close and to branch. Figure 2 illustrates this process from initial presentation to ORT formation, and Figure 3 depicts this process by cartoon diagram.
The cases illustrated in Figures 1 and 2 are likely extreme examples of Type 2 neovascularization that fibrose early and rapidly, even without treatment, as evidenced by the thick lamellar arrangement at presentation. They also seem to respond to anti-VEGF treatment well, with rapid settling of subretinal fluid. This rapid sequencing makes ORT formation more likely because the rapid contraction of fibrous tissue cause more neuroretinal tissue distortion as it settles. Interestingly, most of these eyes show that the fibrous tissue also becomes compacted easily. With follow-up, these Type 2 fibrous membranes become thinner on sequential OCT imaging.
Not all cases presented with this loculated subretinal fluid sign. The more common scenario likely occurs when a Type 2 MNV involutes with anti-VEGF therapy before significant fibrosis occurs. The subsequent subretinal fibrosis in such cases is thinner and often becomes indistinguishable from the underlying RPE or Bruch membrane by the time ORT is seen on SD-OCT. In fact, ORT may not form in those cases where minimal fibrosis occurs or fibrosis forms slowly.
Although our study does not address cases with geographic atrophy, we will take some liberty in proposing that ORT formation in patients with geographic atrophy also follow the same pathway as described above and is associated and preceded by a neovascular process (albeit subclinical). The early clinicopathological studies by Sarks et al demonstrated the existence of subclinical nonexudative MNV associated with degenerating drusen or areas of geographic atrophy.17,18 More recently, OCT-A imaging demonstrated the presence of subclinical quiescent MNV in GA.19,20 Outer retinal tubulation usually forms near the edge of the atrophy in a perilesional pattern.8 In GA, MNVs are found at the border of the atrophy, a similar location to ORT. This close spatial relationship between MNV and ORT in geographic atrophy is illustrated with the help of a clinical case in Figure 4. A single ORT is formed in the center of an area of GA and near the location of the initial Type 2 MNV. In cases where the initial subclinical MNV was a Type 1 MNV, it stands to reason that as the area of GA expands with ensuing RPE loss, the originally sub-RPE fibrovascular sheet is exposed and placed in direct contact with the outer neuroretina, providing the opportunity for the outer retina and ELM to be tacked down by fibrosis and the process of ORT formation to begin. Sarks et al stated that neovascularization seemed to be dependent on viable RPE and in cases of progressing geographic atrophy, the atrophy limits the growth of the MNV. Keeping this in mind, it is worthwhile to note that in cases of geographic atrophy, the presence of ORT is associated with a significantly slower GA enlargement rate, despite eyes with ORT usually having larger lesions at baseline.7 One explanation for this phenomenon could be that the slower GA growth rate allows for larger subclinical MNV to form providing increased fibrous tissue that may contribute to ORT formation. Of course, specific studies designed to test this hypothesis, likely involving OCT-A imaging, need to be performed.
Fig. 4.
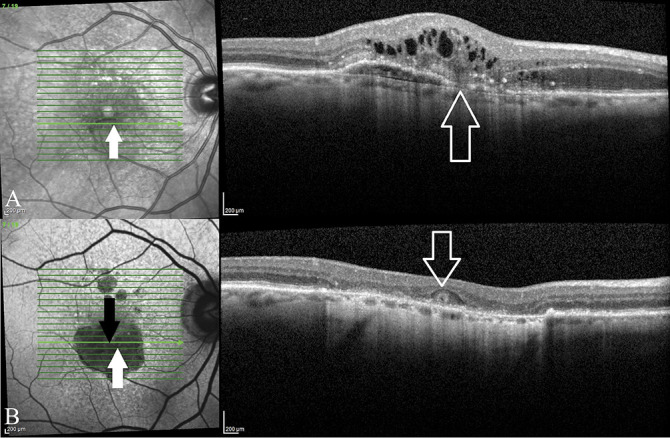
Parts A and B the spatial relationship between MNV and ORT in macular atrophy. A. This patient presented with a Type 3 MNV (RAP lesion). B. With anti-VEGF therapy, signs of a neovascular process disappeared and there is development of macular atrophy. The epicenter of the initial Type 3 MNV is indicated (upward arrows) along with the location of the single ORT that developed (downward arrows). This case illustrates ORT forming near the location of a preceding MNV in the context of macular atrophy.
Outer retinal tubulation is associated with poorer visual acuity at baseline and at last follow-up in AMD in our study, and in other studies.12,13 Outer retinal tubulation is associated with absent or dysmorphic RPE, damaged outer retina, and subretinal scars. We have previously shown that the location of a disciform scar correlates strongly with the final visual outcome.21 Subfoveal scars in the sub-RPE space resulting from Type 1 membranes with overlying intact RPE were associated with better visual outcomes compared with subretinal scars after Type 2 membranes. The finding that ORT is associated with poorer visual outcome is likely a consequence of ORT association with subretinal fibrovascular tissue and the associated disruption of RPE.
This study has several limitations that include its retrospective nature, small sample size, and lack of histological correlation. The strengths of this study include the long-term follow-up and SD-OCT eye-tracked images.
In conclusion, we showed that larger sized Type 2 membranes at presentation predict ORT formation and that fibrosis is frequently found directly underneath established ORT. We propose that formation of ORT, at least in cases of neovascular ARMD, rather than being a retinal response to preserve photoreceptor survival, is likely the result of mechanical traction exerted through uneven subretinal fibrous tissue contraction derived from Type 2 subretinal neovascular membranes. This new hypothesis is robust. It is not in contradiction with a Müller cell-driven, gliotic process proposed by earlier investigators. Indeed, both processes may participate in the pathogenesis of ORT. It has been shown histologically that at the end stage of neovascular AMD where there is macular atrophy glial proliferation occurs and fuses with a subretinal fibrovascular scar.22 Further studies would be needed to corroborate these hypotheses.
Footnotes
Supported by a grant from the Association of Physicians Finance Committee and the Research Proposal Funding Committee of McGill University.
None of the authors has any financial/conflicting interests to disclose.
Contributor Information
Ernst Janse van Rensburg, Email: ernstjvr1@gmail.com.
Christina L. Ryu, Email: christina.ryu@gmail.com.
Emmanouil Rampakakis, Email: ERampakakis@jssresearch.com.
Natalia Vila, Email: natalia.vila.grane@gmail.com.
Errol W. Chan, Email: ewechan@gmail.com.
References
- 1.Zweifel SA, Engelbert M, Laud K, et al. Outer retinal tubulation: a novel optical coherence tomography finding. Arch Ophthalmol 2009;127:1596–1602. [DOI] [PubMed] [Google Scholar]
- 2.Xuan Y, Zhang Y, Wang M, et al. Multimodal fundus imaging of outer retinal tubulations in choroidal osteoma patients. Retina 2018;38:49–59. [DOI] [PubMed] [Google Scholar]
- 3.Heymann HB, Colon DA, Jampol LM. Acute idiopathic maculopathy: 7-year follow-up with development of outer retinal tubulations. Retina Cases Brief Rep 2019;13:224–226. [DOI] [PubMed] [Google Scholar]
- 4.Hua DA, Barteselli G, Chhablani J. Outer retinal tubulation in subretinal neovascularization associated with macular telangiectasia type 2. Semin Ophthalmol 2018;33:331–337. [DOI] [PubMed] [Google Scholar]
- 5.Braimah IZ, Dumpala S, Chhablani J. Outer retinal tubulation in retinal dystrophies. Retina 2017;37:578–584. [DOI] [PubMed] [Google Scholar]
- 6.Iriyama A, Aihara Y, Yanagi Y. Outer retinal tubulation in inherited retinal degenerative disease. Retina 2013;33:1462–1465. [DOI] [PubMed] [Google Scholar]
- 7.Hariri A, Nittala MG, Sadda SR. Outer retinal tubulation as a predictor of the enlargement amount of geographic atrophy in age-related macular degeneration. Ophthalmology 2015;122:407–413. [DOI] [PubMed] [Google Scholar]
- 8.Wolff B, Matet A, Vasseur V, et al. En face OCT imaging for the diagnosis of outer retinal tubulations in age-related macular degeneration. J Ophthalmol 2012;2012:542417. [DOI] [PMC free article] [PubMed] [Google Scholar]
- 9.Schaal KB, Freund KB, Litts KM, et al. Outer retinal tubulation IN advanced age-related macular degeneration: optical coherence tomographic findings correspond to histology. Retina 2015;35:1339–1350. [DOI] [PMC free article] [PubMed] [Google Scholar]
- 10.Preti RC, Govetto A, Filho RGA, et al. Optical coherence tomography analysis OF outer retinal tubulations: sequential evolution and pathophysiological insights. Retina 2018;38:1518–1525. [DOI] [PubMed] [Google Scholar]
- 11.Dolz-Marco R, Litts KM, Tan ACS, et al. The evolution of outer retinal tubulation, a neurodegeneration and gliosis prominent in macular diseases. Ophthalmology 2017;124:1353–1367. [DOI] [PubMed] [Google Scholar]
- 12.Faria-Correia F, Barros-Pereira R, Queirós-Mendanha L, et al. Characterization of neovascular age-related macular degeneration patients with outer retinal tubulations. Ophthalmologica 2013;229:147–151. [DOI] [PubMed] [Google Scholar]
- 13.Spaide RF, Jaffe GJ, Sarraf D, et al. Consensus nomenclature for reporting neovascular age-related macular degeneration data: consensus on neovascular age-related macular degeneration nomenclature study group. Ophthalmology 2020;127:616–626. [DOI] [PMC free article] [PubMed] [Google Scholar]
- 14.Lee JY, Folgar FA, Maguire MG, et al. Outer retinal tubulation in the comparison of age-related macular degeneration treatments trials (CATT). Ophthalmology 2014;121:2423–2431. [DOI] [PMC free article] [PubMed] [Google Scholar]
- 15.Spaide RF. Enhanced depth imaging optical coherence tomography of retinal pigment epithelial detachment in age-related macular degeneration. Am J Ophthalmol 2009;147:644–652. [DOI] [PubMed] [Google Scholar]
- 16.Lafaut BA, Aisenbrey S, Vanden Broecke C, et al. Clinicopathological correlation of retinal pigment epithelial tears in exudative age related macular degeneration: pretear, tear, and scarred tear. Br J Ophthalmol 2001;85:454. [DOI] [PMC free article] [PubMed] [Google Scholar]
- 17.Sarks JP, Sarks SH, Killingsworth MC. Evolution of geographic atrophy of the retinal pigment epithelium. Eye 1988;2:552–577. [DOI] [PubMed] [Google Scholar]
- 18.Sarks SH. Ageing and degeneration in the macular region: a clinico-pathological study. Br J Ophthal 1976;6:324. [DOI] [PMC free article] [PubMed] [Google Scholar]
- 19.Capuano V, Miere A, Querques L, et al. Treatment-Naïve quiescent choroidal neovascularization in geographic atrophy secondary to nonexudative age-related macular degeneration. Am J Ophthalmol 2017;182:45–55. [DOI] [PubMed] [Google Scholar]
- 20.Carnevali A, Vittoria Cicinelli M, Capuano V, et al. Optical coherence tomography angiography: a useful tool for diagnosis of treatment-Naı¨veNaı¨ve quiescent choroidal neovascularization. Am J Ophthalmol 2016;169:189–198. [DOI] [PubMed] [Google Scholar]
- 21.Ryu CL, Al-Humaid S, Rampakakis E, et al. Correlation of visual acuity with fibrotic scar location in treated neovascular age-related macular degeneration eyes. Retina 2016;36:1324–1330. [DOI] [PubMed] [Google Scholar]
- 22.Zanzottera EC, Ach T, Huisingh C, et al. Visualizing retinal pigment epithelium phenotypes in the transition to atrophy in neovascular age-related macular degeneration. Retina 2016;36:S26–S39. [DOI] [PMC free article] [PubMed] [Google Scholar]